The global Power System Simulator market report provides a detailed overview of the market along with the summary of market dynamics including drivers, restraints, and opportunities. In an effort to improve grid reliability and stability, utilities and industries worldwide are more than ever relying on advanced simulation tools. Technological dependence like Internet of things (IoT) and artificial intelligence (AI) based power system and market area is further flouring the market growth.
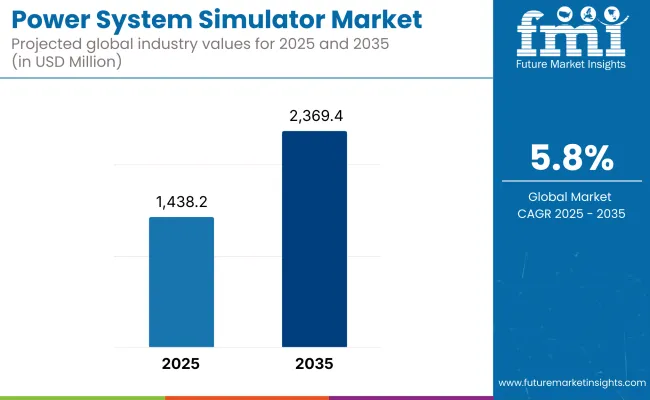
| Metric | Value |
|---|---|
| Market Size in 2025 | USD 1,438.2 Million |
| Projected Market Size in 2035 | USD 2,369.4 Million |
| CAGR (2025 to 2035) | 5.8% |
Moreover, the increasing focus on cost reduction and energy efficiency is reinforcing the utilization of power system simulators in different domains. The market is expected to grow with a CAGR of 5.8% over the forecasted period, i.e., the market is expected to reach USD 2,369.4 Million by 2035 from USD 1,438.2 Million in 2025.
The growing demand for renewable energy and investment in new and advanced infrastructures will be boosting the market of power system simulator in North America.
Given the region's increasing emphasis on incorporating new generation technologies like smart grids or distributed energy resources, complex simulation programs that accurately emulate grid behavior have become critical for maintaining grid stability and optimizing grid efficiency. Market growth is also being driven by regulatory initiatives focused on increasing grid resilience.
The power system simulator market is growing steadily in Europe supported by the region's strong commitment towards renewable energy integration as well as strict environmental regulations.
Germany, France, and the UK, for example, are all investing heavily in smart grid technologies and energy storage solutions, which is propelling demand for advanced simulation tools. Similarly, the focus on meeting energy efficiency objectives and lowering carbon outputs is driving the use of power system simulators in multiple sectors throughout Europe.
The Asia-Pacific region is projected to be the fastest-growing market, driven by rapid industrialization, urbanization, and rising energy demand. The rising demand for power system simulators are primarily driven by countries like China and India that are working on augmenting their power generating capacities and investing in modern grid projects.
Simulation technologies play a critical role in this context, enabling the power sector to integrate renewable energy generation, develop smart cities, and ensure reliable, efficient power distribution.
High Implementation Costs, Complexity in Modeling, and Integration with Legacy Systems
Several challenges have mitigated the growth of the power system simulator market, including the high cost required for simulation platforms and hardware setups, especially for developing economies where utilities and grid operators operate.
Complex algorithms and legacy of expert knowledge simulating real-time behaviors of modern power systems, including renewable integration, distributed energy resources (DERs) and smart grid dynamics, often requires proprietary software tools.
Also, there are technical challenges when it comes to integrate simulators with existing legacy grid infrastructure, SCADA and antique network models, creating a drag on the adoption of these technologies by traditional utility companies.
Renewable Energy Integration, Smart Grids, and Digital Grid Planning
Nevertheless, the global transition towards renewable energy sources, micro grids, and grid modernization is sending the market skyward, overcoming challenges. Power system simulators aid stakeholders in visualizing grid behavior, predicting energy loads, optimizing generation scheduling, and evaluating emergency scenarios free of real-world risk.
As penetration by solar, wind, battery storage, and EV charging networks increases, simulators are vital for maintaining grid stability, reliability, and resilience. There are opportunities in real-time digital twin simulation, AI-enhanced grid modelling and cyber-physical system testing.
Utility suppliers and transmission operators are applying simulators for control room teaching & learning, system dynamic behavior planning, and realistic pre-deployment testing of power electronics & defense systems. Energy modeling for smart cities and optimal operation of hybrid energy systems simulators platforms would also be a focus of investments made by governments and research institutes
The market witnessed steady growth from 2020 to 2024, propelled by grid digitization undertakings, system operator training in remote locations, and growing renewables penetration. The simulators were utilized for workforce training during the pandemic, DER planning, and contingency scenario simulation in hybrid grids. But narrow modeling flexibility and slow regulatory standardization held back wider deployment.
By 2025 to 2035, the market will move towards cloud-based, AI-enabled simulation platform providing a real-time, decentralized and scalable power system analysis. The development of interconnected regional energy markets, smart substations, and grid-edge technologies will drive demand for adaptive, high-fidelity simulators. Use cases will evolve well beyond that: into predictive outage simulation, carbon optimization, and autonomous grid control testing.
Market Shifts: A Comparative Analysis 2020 to 2024 vs. 2025 to 2035
| Market Shift | 2020 to 2024 Trends |
|---|---|
| Regulatory Landscape | Grid modernization grants and DER modeling compliance |
| Consumer Trends | Use in micro grid design and academic training programs |
| Industry Adoption | Popular in utilities, system integrators, and grid planners |
| Supply Chain and Sourcing | Built with custom software and simulation hardware |
| Market Competition | Dominated by engineering software firms and automation OEMs |
| Market Growth Drivers | Growth driven by renewables variability, training needs, and outage risk mitigation |
| Sustainability and Environmental Impact | Used for grid stress testing and emissions modeling |
| Integration of Smart Technologies | Basic simulator-EMS/SCADA linkage |
| Advancements in Simulation Tools | Use of static and transient simulation modules |
| Market Shift | 2025 to 2035 Projections |
|---|---|
| Regulatory Landscape | Standardization of real-time simulation protocols and interoperability norms |
| Consumer Trends | Expansion into decarbonization modeling, smart grid analytics, and prosumer forecasting |
| Industry Adoption | Broader adoption in energy startups, policy modeling, and AI-augmented grid labs |
| Supply Chain and Sourcing | Shift toward cloud-deployed, API-integrated, and modular simulation ecosystems |
| Market Competition | Entry of cloud-native simulation platforms, digital twin developers, and energy AI providers |
| Market Growth Drivers | Accelerated by electrification of transport, decentralized energy, and digital resilience planning |
| Sustainability and Environmental Impact | Core tool for carbon neutrality planning, low-loss grid architecture design, and energy efficiency modeling |
| Integration of Smart Technologies | Use of real-time data feeds, AI scenario generation, and edge-computing compatibility |
| Advancements in Simulation Tools | Rise of real-time dynamic simulators, immersive VR/AR interfaces, and cross-domain energy models |
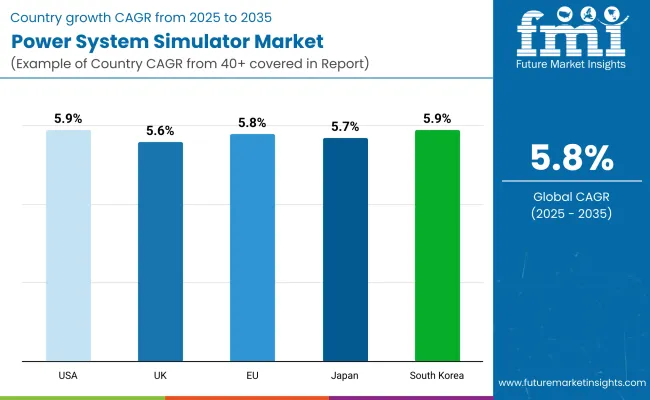
The United States accounts major chunk of the global market share in adoption of power system simulators, driven by high investments in renewable integration, energy storage, and grid reliability testing. Simulators are being used by utilities and national labs for cybersecurity assessments, interconnection studies and smart grid pilot projects. So we are scaling up major simulation platforms for NERC compliance and digital twin energy modeling.
| Country | CAGR (2025 to 2035) |
|---|---|
| USA | 5.9% |
In the UK, simulators are in demand for renewable dispatch modeling, electric vehicle load forecasting and low-voltage network stability-testing as a result of decarbonization targets and smart grid initiatives. Feds are funding open-source, AI-driven grid simulation platforms developed in collaboration with universities and transmission operators.
| Country | CAGR (2025 to 2035) |
|---|---|
| UK | 5.6% |
Within frameworks such as the Clean Energy for All Europeans package, the EU market is rapidly growing. offshore wind integration and real-time congestion management methods are critical and best achieved through simulators in cross-border grid coordination. AI-based power forecasting tools and training simulators for control room operators are being led by Germany, France and the Netherlands
| Country | CAGR (2025 to 2035) |
|---|---|
| EU | 5.8% |
Moreover, the structure of distributed grid and the strategy of energy security in Japan stimulate simulation tool for Disaster, renewable stabilization and Peak shaving system. Virtual Power Plants and Utilities are deploying simulators for management of virtual power plants especially in the earthquake prone zones.
| Country | CAGR (2025 to 2035) |
|---|---|
| Japan | 5.7% |
The smart grid master plan of South Korea is driving simulator adoption across distributed resource planning, EV grid impact modeling, and substation automation training. In order to realize clean energy and resilience objectives, the government is funding R&D for real-time digital simulators, and AI-enabled energy optimization technologies.
| Country | CAGR (2025 to 2035) |
|---|---|
| South Korea | 5.9% |
Growing complexity of grid, renewable integration and digital transformation in utility operation is expected to drive the demand for power system simulator market. Simulators create a model of real electrical conditions, helping grid operators, engineers, and planners make better decisions and establish preventative maintenance strategies.
Additionally, the load flow simulation module type segment, as well as software-based offerings, hold the largest market share as such modules are used extensively for grid stability studies, network planning, and fault analysis. These solutions provide operational visibility, control accuracy, and long-term infrastructure reliability.
Electric utilities, research institutions, and grid modernization projects are increasingly turning to advanced simulation platforms to assess energy flow and identify bottlenecks, and to simulate fault conditions before turning a wrench. Simulation Tools for Decentralized and Digitized Power Systems As prospective power systems witness an increased decentralization and digitization, simulation tools help sustain their performance under varying perturbations to ensure resilience.
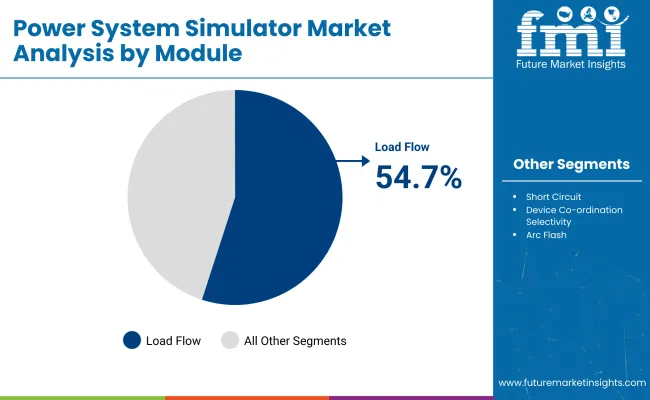
| Module | Market Share (2025) |
|---|---|
| Load Flow | 54.7% |
Load flow modules are the most prevalent in this space, forming the base for simulating the various voltage levels, real and reactive power flow, and losses occurring at each point in an electrical network. These include transmission and distribution-focused modules, which enable engineers to evaluate how various components of the system will react to multiple load and generation scenarios.
Load flow simulations are vital for utilities and grid consultants to design systems, balance loads and improve voltage stability. These modules also enable what-if analysis of system extensions, contingency mapping, and renewable integration evaluation.
Load flow engines are being extended further with advancements in real-time inputs for data, automated updates to control models, and AI-based optimization by simulation developers. This boosts the speed and accuracy of the simulation, notably in smart grid and micro grid applications.This broader scope has kept load flow ahead of short circuit and transient modules, even if these remain critical for protection coordination and stability studies, both of which might Project.
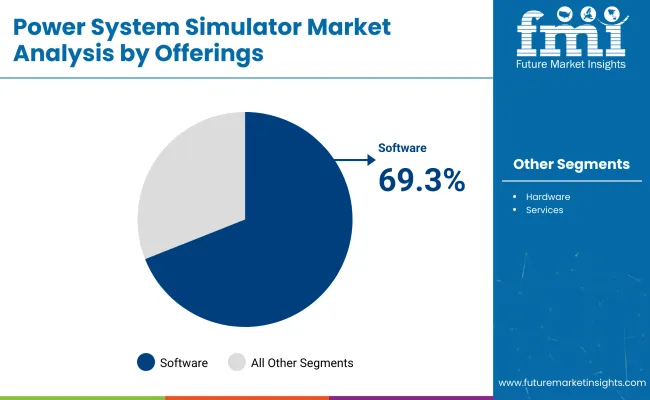
| Offerings | Market Share (2025) |
|---|---|
| Software | 69.3% |
Software solutions represent the most significant share in the power system simulator market by virtue of flexibility and cost-effectiveness when added to existing software solutions and digital infrastructures. These platforms allow complex electrical modeling, automatic simulation runs, and implementation of cloud scenario, making them indispensable in planning, training, and real-time control applications.
An urgent need for scalable and customizable software tools can become evident as the demand for decentralized energy, electric vehicle charging networks, and hybrid power systems increases; these tools must be able to simulate topologies on an increasingly evolving grid.
Because the software is hosted remotely, you can access it from multiple devices, work with others in real time, and constantly receive updates all of which are crucial pipeline elements for worldwide utilities, as well as research libraries and academic science labs.
Simulation software vendors now leverage AI and machine learning to allow for predictive analytics, system diagnostics, and grid forecasting. These platforms lend themselves to hybrid deployment in conjunction with SCADA, EMS, and GIS systems due to modular design and integration capabilities via API.
Hardware-based simulators are always preferred in high-fidelity, hardware-in-the-loop (HIL) testing and training environments, while software still reigns supreme when it comes to adaptability and a wider variety of application areas across the simulation lifecycle.
With demand for power system simulators by utilities, grid operators, industrial power networks, and renewable energy integration projects driving growth, the power system simulator market is fast gaining momentum. The transition to smart grids, technological advances, growing complexity of distributed energy resources (DERs), and regulatory pressure for grid resilience are driving a step change in real-time, digital twin, and AI-enhanced simulation tools.
This includes investing in hybrid simulation environments, electromagnetic transient (EMT) modeling, and cloud-based collaborative simulators. Modernization of the grid, cybersecurity, and SCADA / EMS interoperability continue to be important areas of focus for established players as well as niche engineering firms.
Market Share Analysis by Key Players & Power System Simulator Providers
| Company Name | Estimated Market Share (%) |
|---|---|
| Siemens AG | 14-18% |
| General Electric (GE Digital) | 12-16% |
| OPAL-RT Technologies | 10-14% |
| RTDS Technologies Inc. | 8-12% |
| ETAP (Operation Technology Inc.) | 6-9% |
| Other Simulator Providers | 30-40% |
| Company Name | Key Offerings/Activities |
|---|---|
| Siemens AG | In 2024, integrated its PSS®E platform with AI-driven grid forecasting modules; in 2025, introduced a multi-domain simulator for T&D convergence and DER integration. |
| General Electric (GE Digital) | Enhanced its GridOS™ suite in 2024 with real-time hybrid simulation for renewables; in 2025, launched a cloud-based power system sandbox for training and R&D labs. |
| OPAL-RT Technologies | In 2024, released OPAL-RT HYPERSIM™ enhancements for EMT and cyber-physical simulations; in 2025, added AI-based anomaly detection for HIL testing environments. |
| RTDS Technologies Inc. | Upgraded its real-time digital simulator in 2024 with improved latency for wide-area protection studies; in 2025, deployed high-fidelity renewable infeed models for inverter-based resource testing. |
| ETAP (Operation Technology Inc.) | Launched ETAP 2024 with cloud-synced model management and simulation version control; in 2025, integrated real-time operational digital twin and power analytics engine. |
Key Market Insights
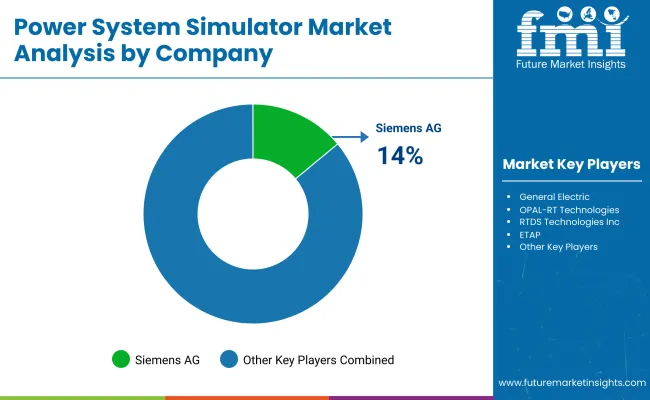
Siemens AG (14-18%)
Siemens continues to lead with its modular PSS® platform, integrating AI and DER-aware simulation for complex grid planning. Its 2024 to 2025 upgrades enhance utility readiness for decentralized and dynamic grid conditions.
General Electric (GE Digital) (12-16%)
GE Digital advances simulator functionality with its GridOS™ environment. The 2025 cloud sandbox release supports grid operator collaboration, DER scenario testing, and workforce training at scale.
OPAL-RT Technologies (10-14%)
OPAL-RT is a leading player in real-time simulation and HIL solutions. Its 2024 to 2025 releases emphasize cyber-physical modeling and fault detection across transmission, micro grid, and EV infrastructure domains.
RTDS Technologies Inc. (8-12%)
RTDS remains a trusted provider of real-time EMT simulators for utilities and research centers. The 2025 renewable infeed models and ultra-low latency capabilities are critical for evolving grid stability studies.
ETAP (6-9%)
ETAP delivers industry-standard digital twins and offline-to-online transition tools. The 2024 to 2025 features strengthen model management, improve simulation accessibility, and support live network analytics.
Other Key Players (30-40% Combined)
Numerous academic, engineering, and automation-focused firms are contributing to simulation innovation in renewable-rich, data-intensive, and grid-interactive ecosystems. These include:
The overall market size for the power system simulator market was USD 1,438.2 Million in 2025.
The power system simulator market is expected to reach USD 2,369.4 Million in 2035.
The demand for power system simulators is rising due to the increasing complexity of electrical grids, integration of renewable energy sources, and the need for accurate load flow analysis and system planning. Advancements in simulation software and rising investments in smart grid infrastructure are further fueling market growth.
The top 5 countries driving the development of the power system simulator market are the USA, China, Germany, India, and Japan.
Load flow modules and software are expected to command a significant share over the assessment period.


Full Research Suite comprises of:
Market outlook & trends analysis
Interviews & case studies
Strategic recommendations
Vendor profiles & capabilities analysis
5-year forecasts
8 regions and 60+ country-level data splits
Market segment data splits
12 months of continuous data updates
DELIVERED AS:
PDF EXCEL ONLINE
Power Plant Boiler Market Forecast Outlook 2025 to 2035
Power Ring Rolling Machine Market Size and Share Forecast Outlook 2025 to 2035
Power Supply Equipment for Data Center Market Size and Share Forecast Outlook 2025 to 2035
Power Electronics Market Size and Share Forecast Outlook 2025 to 2035
Power Quality Equipment Market Size and Share Forecast Outlook 2025 to 2035
Power Generator for Military Market Size and Share Forecast Outlook 2025 to 2035
Power Tools Market Size and Share Forecast Outlook 2025 to 2035
Power Supply Isolation Equipment Market Size and Share Forecast Outlook 2025 to 2035
Power Window Lift Motor Market Size and Share Forecast Outlook 2025 to 2035
Powered Surgical Staplers Market Size and Share Forecast Outlook 2025 to 2035
Power Distribution Component Market Size and Share Forecast Outlook 2025 to 2035
Power Over Ethernet (PoE) Controllers Market Size and Share Forecast Outlook 2025 to 2035
Power Inverter Market Size and Share Forecast Outlook 2025 to 2035
Power Sports Market Size and Share Forecast Outlook 2025 to 2035
Power Conditioner Market Size and Share Forecast Outlook 2025 to 2035
Power Control Commercial Surge Protection Devices Market Size and Share Forecast Outlook 2025 to 2035
Power Transmission Component Market Size and Share Forecast Outlook 2025 to 2035
Power Optimizer Market Size and Share Forecast Outlook 2025 to 2035
Power Plants Heavy Duty Gas Turbine Market Size and Share Forecast Outlook 2025 to 2035
Power Over Ethernet (PoE) Solutions Market Size and Share Forecast Outlook 2025 to 2035

Thank you!
You will receive an email from our Business Development Manager. Please be sure to check your SPAM/JUNK folder too.
Chat With
MaRIA