Power Tool Gears Market Outlook from 2025 to 2035

The increasingly worldwide development of power tool gears market has been encouraged by the growing need for more effective, resilient tools in use across construction, manufacturing and other do it yourself applications.

Power tool gears are an integral part of the electric and cordless drill, as well as other power tools, and they directly impacts and dictate how efficient the tool is, how much torque it transmits, and much more. Mounting investments in infrastructure projects, coupled with the upsurgence of home improvement activities, are boosting the market demand.

Use of high-strain lightweight materials & technological advancement in manufacturing systems are improving the functioning of gears. Moreover, rise of the cordless power tools are contributing the demand for compact and robust gear mechanisms in modern tools.

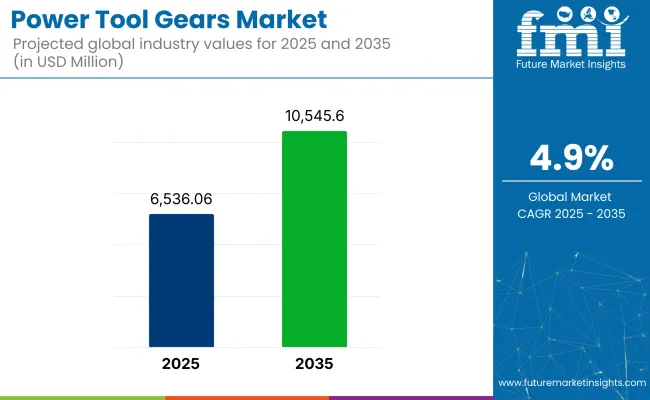
In 2025, the power tool gears market size is estimated at approximately USD 6,536.06 million. By 2035, it is projected to reach USD 10,545.60 million, growing at a compound annual growth rate (CAGR) of 4.9%.
Power Tool Gears Market

Metric Value
Market Size in 2025 USD 6,536.06 million
Projected Market Size in 2035 USD 10,545.60 million
CAGR (2025 to 2035) 4.9%

Growth is fueled by the rising adoption of power tools in emerging economies, technological innovations in gear design, and increased consumer preference for high-performance, durable tools. The expansion of the e-commerce sector also provides manufacturers wider market reach, making power tools more accessible to both professional and amateur users globally.

Regional Market Trends

North America

In North America, the power tool gears market is largely driven by the construction industry and the culture of DIY home projects driving a large share of the market in this region. The USA and Canada are leading the way, reaping the rewards of rapid urbanization and advancements in tool technology.

Moreover, Eco-friendly and battery-powered equipment adoption is supporting for the need for more efficient gears system. Moreover, collaboration between manufacturers and e-commerce in order to improve availability of products in the region is expected to fuel the product demand, propelling the regional market growth.

Europe

Thanks to strong demand from end-use industries like automotive, aerospace, and construction, the European demand for power tool gears remains neutral. France Germany and the UK, among others, are rolling out smart manufacturing technologies that call for precise and durable implement of power.

Sustainable campaigns to urge energy-efficient cogs. The new composites and materials under development are also leading to lighter weight, modular designs, as well as new opportunities for gear manufacturers to address new demands from their industrial and consumer markets.

Asia-Pacific

Fastest growing in the power tool gears market in Asia-pacific region owing to rapid industrialization, urbanization and infrastructure development in countries such as China, India & Japan. The growing construction and automotive industries are fuelling the demand for power tools with advanced gear systems in these sectors.

Additionally, local manufacturers are focusing on product innovation and reaching out to customers through online sale channels, enabling them to access high-quality tools and equipment. The power tools gears market is expected to be sustainable and account for a significant compound annual growth rate (CAGR) during the forecast period.

Evolving materials, novel manufacturing processes, and innovative gear designs are all redefining what tools can do. As things like cordless tools and the do-it-yourself culture come into their own, gear makers will have to innovate from the ground up to remain competitive. Increase in construction activities and modernization projects around the world will create lucrative opportunities for professionals and companies operating in this dynamic market.

Challenges and Opportunities

Challenges

High Manufacturing Costs

Manufacturing power tool gears is an expensive process since top quality materials and machine tools are needed to come up with durable and precision-engineered components. Many smaller manufacturers find it difficult to compete with large, vertically integrated players. So too are soaring energy prices and labor costs around the world, which are adding to the operational challenges facing gear manufacturers.

Intense Competitive Pressure

Competition in the market has been intense with both entrenched brands and newcomers competing for offering more for less. This cutthroat competition compresses margins and forces firms to continually pour money into R&D. Frequent technological advancements also reduce the product life cycle and created a pressure to offer fast innovations.

Opportunities

Rising DIY Culture and Home Improvement Trends

The rising trend of do-it-yourself and home improvement projects among consumers (particularly post-pandemic) has driven the demand for compact, powerful tools. This trend creates significant opportunities for gear makers to produce lightweight and high torque durable gear solutions for cordless and portable power tools.

Growth in Industrial and Construction Sectors

The industrial application of power tools is being propelled by the rapid urbanization trend and infrastructure development projects, especially in developing countries such as India, China, and Brazil. As noted, this rise in construction and manufacturing activities leads to steady demand for high-performance gears that can sustain heavy-duty operations.

Shifts in the Power tool gears market from 2020 to 2024 and Future Trends 2025 to 2035

The power tool gears market observed a boom in home improvement activities witnessed during 2020 to 2024, accelerated urbanization, and technological advancements such as brushless motors. During this time, companies invested heavily in conducting research that allowed them to create lighter and more efficient gears suited for battery-powered tools, which fueled even more growth in the market.

From 2025 to 2035, the market will demand smart gears with IoT features enabling predictive maintenance and better performance. Sustainable manufacturing practices and emerging gears using recycled and composite materials will be facilitated due to the global economy regulations as well as circular economy efforts.

Market Shifts: A Comparative Analysis 2020 to 2024 vs. 2025 to 2035

Market Aspect 2020 to 2024 Trends
Key Growth Driver DIY boom, infrastructure development
Material Innovations Lightweight alloys and composites
Technological Advancements Brushless motor integration
Main Application Areas Residential, construction sectors
Dominant Regions North America, Europe
Regulatory Landscape Focus on energy efficiency standards
Investment Trends R&D in lightweight durable gears
Customer Base Homeowners, construction firms
Competitive Strategy Product quality improvement, cost reduction
Market Aspect 2025 to 2035 Projections
Key Growth Driver Smart tools adoption, sustainability focus
Material Innovations Recycled materials, bio-based composites
Technological Advancements IoT -enabled smart gears
Main Application Areas Smart manufacturing, predictive maintenance
Dominant Regions Asia-Pacific, Latin America
Regulatory Landscape Emphasis on sustainable production and recycling
Investment Trends Smart gear systems and green technologies
Customer Base Smart factories, green builders
Competitive Strategy Smart innovation, sustainability branding

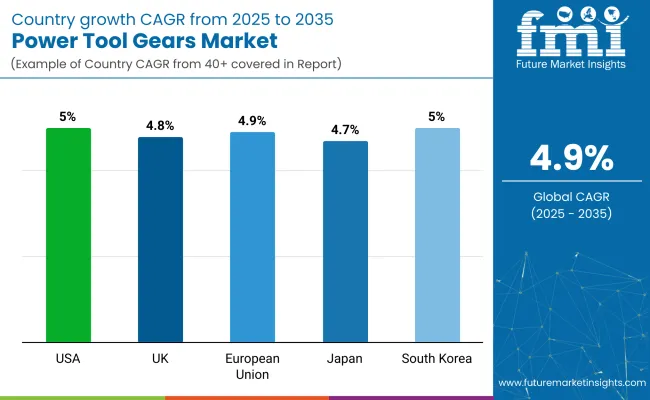
Country-wise Outlook- Power Tool Gears Market

Power Tool Gears Market By Country

United States

The USA power tool gears market is benefiting from robust growth in construction, automotive repair, and do-it-yourself (DIY) sectors. Strong gear manufacturing advancements are driven by growing home renovation trends and demand for cordless power tools.

Further, the introduction of smart technologies and lightweight materials are improving the efficiency and durability of the gear. Manufacturing excellence in the country and the surge of e-commerce for power tools to further propel growth in all major regions of the market.

Country CAGR (2025 to 2035)
USA 5.0%

United Kingdom

The growth of infrastructure projects, industrial automation, and a flourishing do-it-yourself culture are the major causes of the expansion of the power tool gears market in the UK This is driving gear innovations, with increasing emphasis on ergonomic, lightweight, and energy-efficient power tools.

Development in the field of technology is bringing system, parts, or motors in brushless type as per demanding precision engineering, so, generating a high demand for these kinds of durable gear systems. Additionally, supportive government regulations encouraging construction activities and energy-efficient manufacturing practices are expected to drive the market growth robustly over the projected timeframe.

Country CAGR (2025 to 2035)
UK 4.8%

European Union

The automotive, aerospace, and construction industries are expected to fuel the growth of the power tool gears market in the European region due to the increasing demand for the European Union. And gear production is booming as countries like Germany, France and Italy pour money into modernizing industrial manufacturing.

To meet stringent environmental standards, businesses are designing power tool gears with greater durability and efficiency. YET, increasing adoption of modular, interchangeable power tools used in consumer and business applications is also generating demand for high-performance, low-maintenance gears in the region.

Region CAGR (2025 to 2035)
European Union (EU) 4.9%

Japan

Japan power tool gears market is benefitting from the robust manufacturing ecosystem in the country along with skills` development in the country and high rate of precision tool adoption. I still remember how the country’s major industries like electronics, automotive manufacturing, and shipbuilding rely heavily on specialized power tools with advanced gears.

The need for compact, lightweight and high-torque powertrain systems is geared up with the advancements in metallurgy and material science. Japanese manufacturers have also been aggressively making technological investments in sustainable manufacturing to meet global carbon footprint reduction goals.

Country CAGR (2025 to 2035)
Japan 4.7%

South Korea

As industrialization continues to gain pace in South Korea, the market potential of power tool gears is considerable, especially due to electronics production at large, alongside bigger investments from smart manufacturing. Domestic and export market demand for high-efficiency tools is driving gear innovations.

Furthermore, automotive repair, shipbuilding, and aerospace industries are witnessing growth, driving the demand for advanced power tool gears. Tapping the new opportunities for the gear manufacturers in the country, Government initiatives are also encouraging Industry 4.0 adoption in the manufacturing process.

Country CAGR (2025 to 2035)
South Korea 5.0%

Segmentation Outlook- Power Tool Gears Market

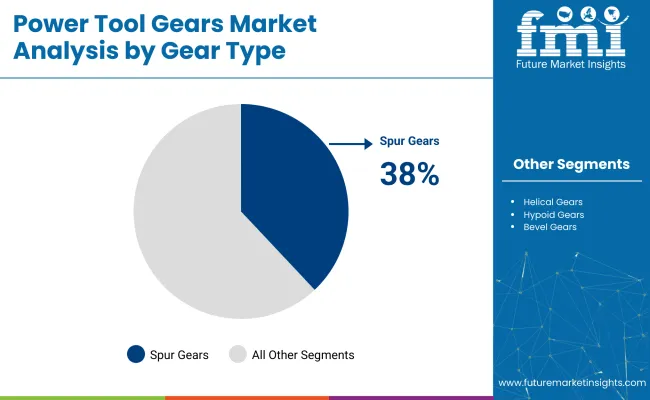
Spur Gears Dominate the Gear Type Segment

Power Tool Gears Market By Gear

Gear Type Market Share (2025)
Spur Gears 38%

On the other hand, spur gears occupy a major space in the power tool gears market as they are simple, efficient, easy to manufacturer, and inexpensive when used in common tools such as drills, saws, and grinders.

One of the oldest and most common types of gears, spur gears have straight teeth and parallel shafts. The simple design allows them to transmit power with high efficiency so they are a good fit for power tools that require high torque and moderate rpm.

Spur gears are simple in design, which leads to lower costs of manufacturing, making them ideal for manufacturing in bulk, which is important in the competitive field of power tools. For drills, they offer the required torque multiplication to allow efficient drilling and consistent operation in differing load conditions.

In saws and grinders, spur gears also enable accurate rotational speeds and constant torque output, which are essential for smooth cutting and grinding action. Durability is another major benefit of spur gears. Since they only create axial loads (unlike helical gears, which also create radial loads), they are easier to align, maintain and repair.

That reliability makes them particularly well-suited for both professional-grade power tools and consumer products, where ease of maintenance and long service life are significant selling points. With the recent drive for more cordless and more compact power tools, manufacturers are consistently steering toward spur gears, as they also provide the ability to reduce weight while also improving energy efficiency and production costs.

Furthermore, improvements in gear materials and manufacturing technologies, including powder metallurgy and precision forging, have also enhanced the strength and performance of spur gears, solidifying their place as the leading design choice in gear systems.

These benefits of spur gears are likely to solidify their dominance in the global power tool gears market as demand for lightweight, durable and economic power tools continues to increase for both professional and DIY applications.
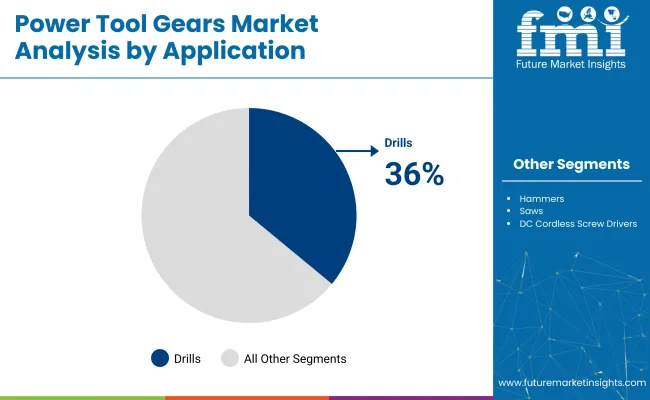
Drills Lead the Application Segment

Power Tool Gears Market By Application

Application Market Share (2025)
Drills 36%

The growing use of efficient, lightweight and durable tools is fuelling high demand for drills in the construction and woodworking industries as well as do-it-yourself activities, making drills the leading power tool gears application segment.

Drills are essential tools in industrial, commercial, and residential applications and are widely used to drill holes, fasten materials, and assemble buildings. Growing construction industries, driven by rapid urbanization and massive infrastructure & housing projects around the world, lowered the demand for high-performance drills offering good consistency, torque, precision, and service life.

In parallel, the increasing trend of DIY home improvement & crafts has widened consumer scope for drill and led to demand for lightweight, easy-to-use and convenient drill types. These days, power drills are becoming more efficient, which means they run better, are more energy efficient, and many of them are battery powered and are compact in size.

Variable speed controls, brushless motors and ergonomic designs also add to their appeal. The selection of durable and efficient gear train systems (typically spur gears) within these drills allows for optimal torque transmission and reduced energy losses, ultimately enhancing the tool's efficiency and reliability.

In addition, developments in battery technologies (such as lithium-ion batteries) and smart tool innovations (like connected drills with Bluetooth monitoring) have boosted the segment growth. What these technological improvements mean is that drills are not just more powerful but longer lasting and easier to maintain, further solidifying their dominance if the application space.

Based on these trends, the drills segment is expected to retain its dominant position in the power tool gears market, owing to the continued expansion of industrial activity, increased home improvement and DIY culture, and technological advancements in design and functionality of tools.

Competitive Outlook

The power tool gears market continues to expand at a healthy rate due to the increasing need for efficient and long lasting tools across the construction, automotive and industrial sectors. The technology of gear manufacturing necessarily provides the essence of improved tool performance and user comfort with the use of lightweight components where applicable.

The movement to cordless and battery powered tools is driving the demand for compact, high efficiency gears. Furthermore, the trend toward DIY and home improvement projects is broadening the customer base beyond just professionals.

The market is anticipated to experience steady growth, with the Compound Annual Growth Rate (CAGR) during 2025 to 2035 projected to cross 4.9% backed by constant innovation, increasing urbanization and growing infrastructure projects worldwide.

Market Share Analysis by Company

Company Name Estimated Market Share (%)
Stanley Black & Decker 18-22%
Bosch Power Tools 15-18%
Makita Corporation 10-14%
Hilti Group 8-10%
Techtronic Industries (TTI) 7-9%
Other Companies (combined) 30-40%

Key Company Offerings and Activities

Company Name Key Offerings/Activities
Stanley Black & Decker In 2025, launched high-torque gears for cordless impact tools. Invested in smart tool tracking technology and expanded its product portfolio for heavy-duty applications.
Bosch Power Tools In 2024, introduced next-gen gears designed for extended battery life and optimized performance. Strengthened its presence in Asia-Pacific through new manufacturing facilities.
Makita Corporation In 2025, released ultra-lightweight gears for its compact cordless drill lineup. Focused on energy-efficient product innovations and green manufacturing practices.
Hilti Group In 2024, developed precision gears for specialty construction tools. Enhanced service offerings with predictive maintenance features integrated into smart tools.
Techtronic Industries (TTI) In 2025, launched modular gear components for flexible tool configurations. Expanded its Milwaukee and Ryobi product lines to target broader consumer segments.

Key Company Insights

Stanley Black & Decker (18-22%)

With a significant market position, Stanley Black & Decker employs strategic acquisitions and innovative practices to retain its position. And by honing in on intelligent, long-lasting, high-torque gears, it's able to respond to both the demands of pros and DIY fans.

Bosch Power Tools (15-18%)

Investing heavily in advanced gear technology for increased tool life and performance, Bosch is used to precision and reliability. It features a robust competitive advantage and customer reach by expanding aggressively into emerging markets.

Makita Corporation (10-14%)

Makita focuses on the prosumer and consumer segments, emphasizing lightweight design and energy efficiency. Its presence in the ever-changing power tool market is further cemented by commitment to eco-friendly innovations and progressive cordless solutions.

Hilti Group (8-10%)

Hilti specializes in high-end, specialized tools for the construction industry. Leveraging innovative gear solutions and predictive maintenance technologies places it ahead of other companies in some premium market segments.

Techtronic Industries (TTI) (7-9%)

TTI differentiates itself with modular designs and a deep breadth of products under Milwaukee and Ryobi branding. The company is focused on user-centric innovations and flexible configurations, which given its customer base, should continue to drive strong growth.

Other Key Players (30-40% Combined)

  • Festool - Specializes in premium woodworking tools with high-precision gears.
  • Hitachi Koki - Offers durable, cost-effective power tools suited for industrial applications.
  • Metabo - Focuses on robust, high-torque tools for construction and metalworking.
  • Ingersoll Rand - Known for industrial-grade gear solutions and pneumatic tools.
  • Dewalt - Expanding aggressively into smart tool segments with sensor-optimized gears and connectivity features.

Key segments of Power Tool Gears Market

By Gear Type:

  • Bevel Gears
  • Spiral Gears
  • Spur Gears
  • Helical Gears
  • Hypoid Gears

By Application:

  • Grinding Machines
  • Drills
  • Hammers
  • Saws
  • DC Cordless Screw Drivers

By End User:

  • Professional
  • DIY (Consumer)

By Region:

  • North America
  • Latin America
  • Europe
  • South Asia Pacific
  • East Asia
  • MEA

Table of Content

  1. Executive Summary
  2. Industry Introduction, including Taxonomy and Market Definition
  3. Market Trends and Success Factors, including Macro-economic Factors, Market Dynamics, and Recent Industry Developments
  4. Global Market Demand Analysis 2020 to 2024 and Forecast 2025 to 2035, including Historical Analysis and Future Projections
  5. Pricing Analysis
  6. Global Market Analysis 2020 to 2024 and Forecast 2025 to 2035
    • By Gear Type
    • By Application
    • By End User
  7. Global Market Analysis 2020 to 2024 and Forecast 2025 to 2035, By Gear Type
    • Bevel Gears
    • Spiral Gears
    • Spur Gears
    • Spur Gears
    • Hypoid Gears
  8. Global Market Analysis 2020 to 2024 and Forecast 2025 to 2035, By Application
    • Grinding Machines
    • Drills
    • Hammers
    • Saws
    • DC Cordless Screw Drivers
  9. Global Market Analysis 2020 to 2024 and Forecast 2025 to 2035, By End User
    • Professional
    • DIY (Consumer)
  10. Global Market Analysis 2020 to 2024 and Forecast 2025 to 2035, By Region
    • North America
    • Latin America
    • East Asia
    • South Asia & Pacific
    • Eastern Europe
    • Western Europe
    • Middle East & Africa
  11. North America Sales Analysis 2020 to 2024 and Forecast 2025 to 2035, by Key Segments and Countries
  12. Latin America Sales Analysis 2020 to 2024 and Forecast 2025 to 2035, by Key Segments and Countries
  13. East Asia Sales Analysis 2020 to 2024 and Forecast 2025 to 2035, by Key Segments and Countries
  14. South Asia & Pacific Sales Analysis 2020 to 2024 and Forecast 2025 to 2035, by Key Segments and Countries
  15. Eastern Europe Sales Analysis 2020 to 2024 and Forecast 2025 to 2035, by Key Segments and Countries
  16. Western Europe Sales Analysis 2020 to 2024 and Forecast 2025 to 2035, by Key Segments and Countries
  17. Middle East & Africa Sales Analysis 2020 to 2024 and Forecast 2025 to 2035, by Key Segments and Countries
  18. Sales Forecast 2025 to 2035 By Gear Type, By Application, and By End User for 30 Countries
  19. Competition Outlook, including Market Structure Analysis, Company Share Analysis by Key Players, and Competition Dashboard
  20. Company Profile
    • hGears
    • Matex Co., Ltd.
    • TFM Group
    • TAIZHOU BAK INDUSTRY CO., LTD
    • Yangzhou Haichang New Material Co., Ltd. (Seashine)
    • Porite Group
    • Jinhua Xintian Gear Co., Ltd. (Ne Sky)
    • Junxing Electromechanical International Co., Ltd. (KH Gears)
    • Zhejiang Fengli Intelligent Technology Co., Ltd. (Fore)
    • Pragati Transmission Pvt.Ltd.

List of Tables

  • Table 01: Global Market Forecast (000’ Units) Value (USD Million) Historical Data 2020 - 2024 and Forecast 2025 - 2035 by End User
  • Table 02: Global Market Forecast (000’ Units) Value (USD Million) Historical Data 2020 - 2024 and Forecast 2025 - 2035 by Gear Type
  • Table 03: Global Market Value (USD Million) and Volume (‘000 Units) Historical Data 2020 - 2024 and Forecast 2025 - 2035 by Application
  • Table 04: Global Market Value (USD Million) and Volume (‘000 Units) Historical Data 2020 - 2024 and Forecast 2025 - 2035 by Application
  • Table 05: Global Market Forecast (000’ Units) Value (USD Million) Historical Data 2020 - 2024 and Forecast 2025 - 2035 by Gear Type
  • Table 06: Global Market Value (USD Million) and Volume (‘000 Units) Historical Data 2020 - 2024 and Forecast 2025 - 2035 by Application
  • Table 07: Global Market Value (USD Million) and Volume (‘000 Units) Historical Data 2020 - 2024 and Forecast 2025 - 2035 by Application
  • Table 08: Global Market Value (USD Million) and Volume (‘000 Units) Historical Data 2020 - 2024 and Forecast 2025 - 2035 by Region
  • Table 09: North America Market Value (USD Million) and Volume (‘000 Units) Historical Data 2020 - 2024 and Forecast 2025 - 2035 by Country
  • Table 10: North America Market Forecast (000’ Units) Value (USD Million) Historical Data 2020 - 2024 and Forecast 2025 - 2035 by End User
  • Table 11: North America Market Forecast (000’ Units) Value (USD Million) Historical Data 2020 - 2024 and Forecast 2025 - 2035 by Gear Type
  • Table 12: North America Market Value (USD Million) and Volume (‘000 Units) Historical Data 2020 - 2024 and Forecast 2025 - 2035 by Application
  • Table 13: North America Market Value (USD Million) and Volume (‘000 Units) Historical Data 2020 - 2024 and Forecast 2025 - 2035 by Application
  • Table 14: North America Market Forecast (000’ Units) Value (USD Million) Historical Data 2020 - 2024 and Forecast 2025 - 2035 by Gear Type
  • Table 15: North America Market Value (USD Million) and Volume (‘000 Units) Historical Data 2020 - 2024 and Forecast 2025 - 2035 by Application
  • Table 16: North America Market Value (USD Million) and Volume (‘000 Units) Historical Data 2020 - 2024 and Forecast 2025 - 2035 by Application
  • Table 17: Latin America Market Value (USD Million) and Volume (‘000 Units) Historical Data 2020 - 2024 and Forecast 2025 - 2035 by Country
  • Table 18: Latin America Market Forecast (000’ Units) Value (USD Million) Historical Data 2020 - 2024 and Forecast 2025 - 2035 by End User
  • Table 19: Latin America Market Forecast (000’ Units) Value (USD Million) Historical Data 2020 - 2024 and Forecast 2025 - 2035 by Gear Type
  • Table 20: Latin America Market Value (USD Million) and Volume (‘000 Units) Historical Data 2020 - 2024 and Forecast 2025 - 2035 by Application
  • Table 21: Latin America Market Value (USD Million) and Volume (‘000 Units) Historical Data 2020 - 2024 and Forecast 2025 - 2035 by Application
  • Table 22: Latin America Market Forecast (000’ Units) Value (USD Million) Historical Data 2020 - 2024 and Forecast 2025 - 2035 by Gear Type
  • Table 23: Latin America Market Value (USD Million) and Volume (‘000 Units) Historical Data 2020 - 2024 and Forecast 2025 - 2035 by Application
  • Table 24: Latin America Market Value (USD Million) and Volume (‘000 Units) Historical Data 2020 - 2024 and Forecast 2025 - 2035 by Application
  • Table 25: Europe Market Value (USD Million) and Volume (‘000 Units) Historical Data 2020 - 2024 and Forecast 2025 - 2035 by Country
  • Table 26: Europe Market Forecast (000’ Units) Value (USD Million) Historical Data 2020 - 2024 and Forecast 2025 - 2035 by End User
  • Table 27: Europe Market Forecast (000’ Units) Value (USD Million) Historical Data 2020 - 2024 and Forecast 2025 - 2035 by Gear Type
  • Table 28: Europe Market Value (USD Million) and Volume (‘000 Units) Historical Data 2020 - 2024 and Forecast 2025 - 2035 by Application
  • Table 29: Europe Market Value (USD Million) and Volume (‘000 Units) Historical Data 2020 - 2024 and Forecast 2025 - 2035 by Application
  • Table 30: Europe Market Forecast (000’ Units) Value (USD Million) Historical Data 2020 - 2024 and Forecast 2025 - 2035 by Gear Type
  • Table 31: Europe Market Value (USD Million) and Volume (‘000 Units) Historical Data 2020 - 2024 and Forecast 2025 - 2035 by Application
  • Table 32: Europe Market Value (USD Million) and Volume (‘000 Units) Historical Data 2020 - 2024 and Forecast 2025 - 2035 by Application
  • Table 33: East Asia Market Value (USD Million) and Volume (‘000 Units) Historical Data 2020 - 2024 and Forecast 2025 - 2035 by Country
  • Table 34: East Asia Market Forecast (000’ Units) Value (USD Million) Historical Data 2020 - 2024 and Forecast 2025 - 2035 by End User
  • Table 35: East Asia Market Forecast (000’ Units) Value (USD Million) Historical Data 2020 - 2024 and Forecast 2025 - 2035 by Gear Type
  • Table 36: East Asia Market Value (USD Million) and Volume (‘000 Units) Historical Data 2020 - 2024 and Forecast 2025 - 2035 by Application
  • Table 37: East Asia Market Value (USD Million) and Volume (‘000 Units) Historical Data 2020 - 2024 and Forecast 2025 - 2035 by Application
  • Table 38: East Asia Market Forecast (000’ Units) Value (USD Million) Historical Data 2020 - 2024 and Forecast 2025 - 2035 by Gear Type
  • Table 39: East Asia Market Value (USD Million) and Volume (‘000 Units) Historical Data 2020 - 2024 and Forecast 2025 - 2035 by Application
  • Table 40: East Asia Market Value (USD Million) and Volume (‘000 Units) Historical Data 2020 - 2024 and Forecast 2025 - 2035 by Application
  • Table 41: South Asia & Pacific Market Value (USD Million) and Volume (‘000 Units) Historical Data 2020 - 2024 and Forecast 2025 - 2035 by Country
  • Table 42: South Asia Pacific Market Forecast (000’ Units) Value (USD Million) Historical Data 2020 - 2024 and Forecast 2025 - 2035 by End User
  • Table 43: South Asia Pacific Market Forecast (000’ Units) Value (USD Million) Historical Data 2020 - 2024 and Forecast 2025 - 2035 by Gear Type
  • Table 44: South Asia Pacific Market Value (USD Million) and Volume (‘000 Units) Historical Data 2020 - 2024 and Forecast 2025 - 2035 by Application
  • Table 45: South Asia Pacific Market Value (USD Million) and Volume (‘000 Units) Historical Data 2020 - 2024 and Forecast 2025 - 2035 by Application
  • Table 46: South Asia Pacific Market Forecast (000’ Units) Value (USD Million) Historical Data 2020 - 2024 and Forecast 2025 - 2035 by Gear Type
  • Table 47: South Asia Pacific Market Value (USD Million) and Volume (‘000 Units) Historical Data 2020 - 2024 and Forecast 2025 - 2035 by Application
  • Table 48: South Asia Pacific Market Value (USD Million) and Volume (‘000 Units) Historical Data 2020 - 2024 and Forecast 2025 - 2035 by Application
  • Table 49: MEA  Market Value (USD Million) and Volume (‘000 Units) Historical Data 2020 - 2024 and Forecast 2025 - 2035 by Country
  • Table 50: MEA Market Forecast (000’ Units) Value (USD Million) Historical Data 2020 - 2024 and Forecast 2025 - 2035 by End User
  • Table 51: MEA Market Forecast (000’ Units) Value (USD Million) Historical Data 2020 - 2024 and Forecast 2025 - 2035 by Gear Type
  • Table 52: MEA Market Value (USD Million) and Volume (‘000 Units) Historical Data 2020 - 2024 and Forecast 2025 - 2035 by Application
  • Table 53: MEA Market Value (USD Million) and Volume (‘000 Units) Historical Data 2020 - 2024 and Forecast 2025 - 2035 by Application
  • Table 54: MEA Market Forecast (000’ Units) Value (USD Million) Historical Data 2020 - 2024 and Forecast 2025 - 2035 by Gear Type
  • Table 55: MEA Market Value (USD Million) and Volume (‘000 Units) Historical Data 2020 - 2024 and Forecast 2025 - 2035 by Application
  • Table 56: MEA Market Value (USD Million) and Volume (‘000 Units) Historical Data 2020 - 2024 and Forecast 2025 - 2035 by Application

List of Figures

  • Figure 01: Global Historical Volume (000’ Units), 2020 - 2035
  • Figure 02: Global Volume (000' Units) Forecast, 2025 - 2035
  • Figure 03: Global Value (USD Million) Historical Data and Forecast 2020 - 2035
  • Figure 04: Global Absolute $ Opportunity Analysis, 2020 - 2035
  • Figure 05: Global Market Share and BPS Analysis by End User - 2025 & 2035
  • Figure 06: Global Market Y-o-Y Growth Projections by End User, 2025 - 2035
  • Figure 07: Global Market Attractiveness by End User, 2025 - 2035
  • Figure 08: Global Market Absolute $ Opportunity by Professional
  • Figure 09: Global Market Absolute $ Opportunity by DIY (Consumer)
  • Figure 10: Global Market Share and BPS Analysis by Gear Type - 2025 & 2035
  • Figure 11: Global Market Y-o-Y Growth Projections by Gear Type, 2025 - 2035
  • Figure 12: Global Market Attractiveness by Gear Type, 2025 - 2035
  • Figure 13: Global Market Absolute $ Opportunity by Bevel Gears
  • Figure 14: Global Market Absolute $ Opportunity by Spiral Gears
  • Figure 15: Global Market Absolute $ Opportunity by Spur Gears
  • Figure 16: Global Market Absolute $ Opportunity by Helical Gears
  • Figure 17: Global Market Absolute $ Opportunity by Hypoid Gears
  • Figure 18: Global Market Share and BPS Analysis by Application - 2025 & 2035
  • Figure 19: Global Market Y-o-Y Growth Projections by Application, 2025 - 2035
  • Figure 20: Global Market Attractiveness by Application, 2025 - 2035
  • Figure 21: Global Market Absolute $ Opportunity by Grinding Machines
  • Figure 22: Global Market Absolute $ Opportunity by Drills
  • Figure 23: Global Market Absolute $ Opportunity by Hammers
  • Figure 24: Global Market Absolute $ Opportunity by DC Cordless Screw Drivers
  • Figure 25: Global Market Absolute $ Opportunity by Saws
  • Figure 26: Global Market Absolute $ Opportunity by Others
  • Figure 27: Global Market Share and BPS Analysis by Gear Type - 2025 & 2035
  • Figure 28: Global Market Y-o-Y Growth Projections by Gear Type, 2025 - 2035
  • Figure 29: Global Market Attractiveness by Gear Type, 2025 - 2035
  • Figure 30: Global Market Absolute $ Opportunity by Bevel Gears
  • Figure 31: Global Market Absolute $ Opportunity by Spiral Gears
  • Figure 32: Global Market Absolute $ Opportunity by Spur Gears
  • Figure 33: Global Market Absolute $ Opportunity by Helical Gears
  • Figure 34: Global Market Absolute $ Opportunity by Hypoid Gears
  • Figure 35: Global Market Share and BPS Analysis by Application - 2025 & 2035
  • Figure 36: Global Market Y-o-Y Growth Projections by Application, 2025 - 2035
  • Figure 37: Global Market Attractiveness by Application, 2025 - 2035
  • Figure 38: Global Market Absolute $ Opportunity by Grinding Machines
  • Figure 39: Global Market Absolute $ Opportunity by Drills
  • Figure 40: Global Market Absolute $ Opportunity by Hammers
  • Figure 41: Global Market Absolute $ Opportunity by DC Cordless Screw Drivers
  • Figure 42: Global Market Absolute $ Opportunity by Saws
  • Figure 43: Global Market Absolute $ Opportunity by Others
  • Figure 44: Global Market Share and BPS Analysis by Region - 2025 & 2035
  • Figure 45: Global Market Y-o-Y Growth Projections by Region, 2025 - 2035
  • Figure 46: Global Market Attractiveness by Region, 2025 - 2035
  • Figure 47: North America Market Absolute $ Opportunity
  • Figure 48: Latin America Market Absolute $ Opportunity
  • Figure 49: Europe Market Absolute $ Opportunity
  • Figure 50: South Asia & Pacific Market Absolute $ Opportunity
  • Figure 51: East Asia Market Absolute $ Opportunity
  • Figure 52: Middle East & Africa Market Absolute $ Opportunity
  • Figure 53: North America Market Share and BPS Analysis by Country - 2025 & 2035
  • Figure 54: North America Market Y-o-Y Growth Projections by Country, 2025 - 2035
  • Figure 55: North America Market Attractiveness by Country, 2025 - 2035
  • Figure 56: U.S. Market Absolute $ Opportunity
  • Figure 57: Canada Market Absolute $ Opportunity
  • Figure 58: North America Market Share and BPS Analysis by End User - 2025 & 2035
  • Figure 59: North America Market Y-o-Y Growth Projections by End User, 2025 - 2035
  • Figure 60: North America Market Attractiveness by End User, 2025 - 2035
  • Figure 61: North America Market Share and BPS Analysis by Gear Type - 2025 & 2035
  • Figure 62: North America Market Y-o-Y Growth Projections by Gear Type, 2025 - 2035
  • Figure 63: North America Market Attractiveness by Gear Type, 2025 - 2035
  • Figure 64: North America Market Share and BPS Analysis by Application - 2025 & 2035
  • Figure 65: North America Market Y-o-Y Growth Projections by Application, 2025 - 2035
  • Figure 66: North America Market Attractiveness by Application, 2025 - 2035
  • Figure 67: North America Market Share and BPS Analysis by Gear Type - 2025 & 2035
  • Figure 68: North America Market Y-o-Y Growth Projections by Gear Type, 2025 - 2035
  • Figure 69: North America Market Attractiveness by Gear Type, 2025 - 2035
  • Figure 70: North America Market Share and BPS Analysis by Application - 2025 & 2035
  • Figure 71: North America Market Y-o-Y Growth Projections by Application, 2025 - 2035
  • Figure 72: North America Market Attractiveness by Application, 2025 - 2035
  • Figure 73: Latin America Market Share and BPS Analysis by Country- 2025 & 2035
  • Figure 74: Latin America Market Y-o-Y Growth Projections by Country, 2025 - 2035
  • Figure 75: Latin America Market Attractiveness by Country, 2025 - 2035
  • Figure 76: Brazil Market Absolute $ Opportunity
  • Figure 77: Mexico Market Absolute $ Opportunity
  • Figure 78: Rest of Latin America Market Absolute $ Opportunity
  • Figure 79: Latin America Market Share and BPS Analysis by End User - 2025 & 2035
  • Figure 80: Latin America Market Y-o-Y Growth Projections by End User, 2025 - 2035
  • Figure 81: Latin America Market Attractiveness by End User, 2025 - 2035
  • Figure 82: Latin America Market Share and BPS Analysis by Gear Type - 2025 & 2035
  • Figure 83: Latin America Market Y-o-Y Growth Projections by Gear Type, 2025 - 2035
  • Figure 84: Latin America Market Attractiveness by Gear Type, 2025 - 2035
  • Figure 85: Latin America Market Share and BPS Analysis by Application - 2025 & 2035
  • Figure 86: Latin America Market Y-o-Y Growth Projections by Application, 2025 - 2035
  • Figure 87: Latin America Market Attractiveness by Application, 2025 - 2035
  • Figure 88: Latin America Market Share and BPS Analysis by Gear Type - 2025 & 2035
  • Figure 89: Latin America Market Y-o-Y Growth Projections by Gear Type, 2025 - 2035
  • Figure 90: Latin America Market Attractiveness by Gear Type, 2025 - 2035
  • Figure 91: Latin America Market Share and BPS Analysis by Application - 2025 & 2035
  • Figure 92: Latin America Market Y-o-Y Growth Projections by Application, 2025 - 2035
  • Figure 93: Latin America Market Attractiveness by Application, 2025 - 2035
  • Figure 94: Europe Market Share and BPS Analysis by Gear Type - 2025 & 2035
  • Figure 95: Europe Market Y-o-Y Growth Projections by Gear Type, 2025 - 2035
  • Figure 96: Europe Market Attractiveness by Gear Type, 2025 - 2035
  • Figure 97: Germany Market Absolute $ Opportunity
  • Figure 98: Italy Market Absolute $ Opportunity
  • Figure 99: France Market Absolute $ Opportunity
  • Figure 100: U.K. Market Absolute $ Opportunity
  • Figure 101: Spain Market Absolute $ Opportunity
  • Figure 102: Russia Market Absolute $ Opportunity
  • Figure 103: BENELUX Market Absolute $ Opportunity
  • Figure 104: Rest of Europe Market Absolute $ Opportunity
  • Figure 105: Europe Market Share and BPS Analysis by End User - 2025 & 2035
  • Figure 106: Europe Market Y-o-Y Growth Projections by End User, 2025 - 2035
  • Figure 107: Europe Market Attractiveness by End User, 2025 - 2035
  • Figure 108: Europe Market Share and BPS Analysis by Gear Type - 2025 & 2035
  • Figure 109: Europe Market Y-o-Y Growth Projections by Gear Type, 2025 - 2035
  • Figure 110: Europe Market Attractiveness by Gear Type, 2025 - 2035
  • Figure 111: Europe Market Share and BPS Analysis by Application - 2025 & 2035
  • Figure 112: Europe Market Y-o-Y Growth Projections by Application, 2025 - 2035
  • Figure 113: Europe Market Attractiveness by Application, 2025 - 2035
  • Figure 114: Europe Market Share and BPS Analysis by Gear Type - 2025 & 2035
  • Figure 115: Europe Market Y-o-Y Growth Projections by Gear Type, 2025 - 2035
  • Figure 116: Europe Market Attractiveness by Gear Type, 2025 - 2035
  • Figure 117: Europe Market Share and BPS Analysis by Application - 2025 & 2035
  • Figure 118: Europe Market Y-o-Y Growth Projections by Application, 2025 - 2035
  • Figure 119: Europe Market Attractiveness by Application, 2025 - 2035
  • Figure 120: East Asia Market Share and BPS Analysis by Country - 2025 & 2035
  • Figure 121: East Asia Market Y-o-Y Growth Projections by Country, 2025 - 2035
  • Figure 122: East Asia Market Attractiveness by Country, 2025 - 2035
  • Figure 123: China Market Absolute $ Opportunity
  • Figure 124: Japan Market Absolute $ Opportunity
  • Figure 125: South Korea Market Absolute $ Opportunity
  • Figure 126: East Asia Market Share and BPS Analysis by End User - 2025 & 2035
  • Figure 127: East Asia Market Y-o-Y Growth Projections by End User, 2025 - 2035
  • Figure 128: East Asia Market Attractiveness by End User, 2025 - 2035
  • Figure 129: East Asia Market Share and BPS Analysis by Gear Type - 2025 & 2035
  • Figure 130: East Asia Market Y-o-Y Growth Projections by Gear Type, 2025 - 2035
  • Figure 131: East Asia Market Attractiveness by Gear Type, 2025 - 2035
  • Figure 132: East Asia Market Share and BPS Analysis by Application - 2025 & 2035
  • Figure 133: East Asia Market Y-o-Y Growth Projections by Application, 2025 - 2035
  • Figure 134: East Asia Market Attractiveness by Application, 2025 - 2035
  • Figure 135: East Asia Market Share and BPS Analysis by Gear Type - 2025 & 2035
  • Figure 136: East Asia Market Y-o-Y Growth Projections by Gear Type, 2025 - 2035
  • Figure 137: East Asia Market Attractiveness by Gear Type, 2025 - 2035
  • Figure 138: East Asia Market Share and BPS Analysis by Application - 2025 & 2035
  • Figure 139: East Asia Market Y-o-Y Growth Projections by Application, 2025 - 2035
  • Figure 140: East Asia Market Attractiveness by Application, 2025 - 2035
  • Figure 141: South Asia & Pacific Market Share and BPS Analysis by Country - 2025 & 2035
  • Figure 142: South Asia & Pacific Market Y-o-Y Growth Projections by Country, 2025 - 2035
  • Figure 143: South Asia & Pacific Market Attractiveness by Country, 2025 - 2035
  • Figure 144: India Market Absolute $ Opportunity
  • Figure 145: Thailand Countries Market Absolute $ Opportunity
  • Figure 146: Malaysia Market Absolute $ Opportunity
  • Figure 147: Indonesia Countries Market Absolute $ Opportunity
  • Figure 148: Oceania Market Absolute $ Opportunity
  • Figure 149: Rest of South Asia & Pacific Market Absolute $ Opportunity
  • Figure 150: South Asia Pacific Market Share and BPS Analysis by End User - 2025 & 2035
  • Figure 151: South Asia Pacific Market Y-o-Y Growth Projections by End User, 2025 - 2035
  • Figure 152: South Asia Pacific Market Attractiveness by End User, 2025 - 2035
  • Figure 153: South Asia Pacific Market Share and BPS Analysis by Gear Type - 2025 & 2035
  • Figure 154: South Asia Pacific Market Y-o-Y Growth Projections by Gear Type, 2025 - 2035
  • Figure 155: South Asia Pacific Market Attractiveness by Gear Type, 2025 - 2035
  • Figure 156: South Asia Pacific Market Share and BPS Analysis by Application - 2025 & 2035
  • Figure 157: South Asia Pacific Market Y-o-Y Growth Projections by Application, 2025 - 2035
  • Figure 158: South Asia Pacific Market Attractiveness by Application, 2025 - 2035
  • Figure 159: South Asia Pacific Market Share and BPS Analysis by Gear Type - 2025 & 2035
  • Figure 160: South Asia Pacific Market Y-o-Y Growth Projections by Gear Type, 2025 - 2035
  • Figure 161: South Asia Pacific Market Attractiveness by Gear Type, 2025 - 2035
  • Figure 162: South Asia Pacific Market Share and BPS Analysis by Application - 2025 & 2035
  • Figure 163: South Asia Pacific Market Y-o-Y Growth Projections by Application, 2025 - 2035
  • Figure 164: South Asia Pacific Market Attractiveness by Application, 2025 - 2035
  • Figure 165: Middle East & Africa Market Share and BPS Analysis by Country- 2025 & 2035
  • Figure 166: Middle East & Africa Market Y-o-Y Growth Projections by Country, 2025 - 2035
  • Figure 167: Middle East & Africa Market Attractiveness by Country, 2025 - 2035
  • Figure 168: GCC Countries Market Absolute $ Opportunity
  • Figure 169: Turkey Market Absolute $ Opportunity
  • Figure 170: Northern Africa Market Absolute $ Opportunity
  • Figure 171: Rest of MEA Market Absolute $ Opportunity
  • Figure 172: Global Market Absolute $ Opportunity by South Africa
  • Figure 173: MEA Market Share and BPS Analysis by End User - 2025 & 2035
  • Figure 174: MEA Market Y-o-Y Growth Projections by End User, 2025 - 2035
  • Figure 175: MEA Market Attractiveness by End User, 2025 - 2035
  • Figure 176: MEA Market Share and BPS Analysis by Gear Type - 2025 & 2035
  • Figure 177: MEA Market Y-o-Y Growth Projections by Gear Type, 2025 - 2035
  • Figure 178: MEA Market Attractiveness by Gear Type, 2025 - 2035
  • Figure 179: MEA Market Share and BPS Analysis by Application - 2025 & 2035
  • Figure 180: MEA Market Y-o-Y Growth Projections by Application, 2025 - 2035
  • Figure 181: MEA Market Attractiveness by Application, 2025 - 2035
  • Figure 182: MEA Market Share and BPS Analysis by Gear Type - 2025 & 2035
  • Figure 183: MEA Market Y-o-Y Growth Projections by Gear Type, 2025 - 2035
  • Figure 184: MEA Market Attractiveness by Gear Type, 2025 - 2035
  • Figure 185: MEA Market Share and BPS Analysis by Application - 2025 & 2035
  • Figure 186: MEA Market Y-o-Y Growth Projections by Application, 2025 - 2035
  • Figure 187: MEA Market Attractiveness by Application, 2025 - 2035

Frequently Asked Questions

What was the overall size of the power tool gears market in 2025?

The overall market size for power tool gears market was USD 6,536.06 million in 2025.

How big the power tool gears market is expected in 2035?

The power tool gears market expected to reach USD 10,545.60 million in 2035.

What will drive the demand for power tool gears market during the forecast period?

Rising DIY activities, growth in construction and manufacturing sectors, increasing demand for cordless tools, and technological gear innovations.

List the top 5 countries contributing power tool gears market?

The top 5 countries which drives the development of cargo bike tire market are USA, UK, Europe Union, Japan and South Korea.

Which segment in type is expected to power tool gears market?

Spur gears segment driving market growth to command significant share over the assessment period.

Explore Similar Insights

Future Market Insights

Power Tool Gears Market