Power Rental Market Snapshot (2023 to 2033)

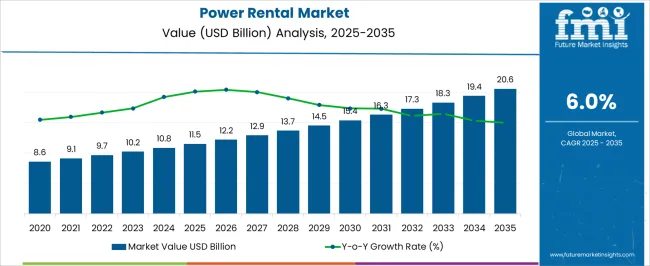
The global power rental market is expected to be valued at US$ 10.22 Billion in 2023. With the fast development of the industrial sector, coupled with the rising need for an uninterrupted and dependable power supply, the overall demand for Power Rental is projected to grow at a CAGR of 6.0% between 2023 and 2033, totaling around US$ 18.31 Billion by 2033.

Rising power consumption in various parts of the world is one of the major factors that is escalated to boost the growth of the power rental industry over the analysis period. In addition, the oil and gas sector is one of the most important industries where power generators are rented for use in infrastructure construction or during exploration and production. Moreover, growing awareness of the advantages of outsourcing power equipment is favorably benefiting the industry. Also, there is an increasing demand for scalable rental equipment that can deal with voltage sags and swells, as well as power outages.

Additionally, favorable government measures to extend metro and airport networks, as well as the deployment of hotels and retail malls are augmenting the demand for power renting in both established and developing countries. Other factors such as the increased deployment of renewables as an alternative power source to minimize carbon emissions are also projected to accelerate the market growth.

Data Points Key Statistics
Power Rental Market Value 2023 US$ 10.22 Billion
Power Rental Market Projected Value (2033) US$ 18.31 Billion
Power Rental Market CAGR (2023 to 2033) 6.0%

Don't pay for what you don't need

Customize your report by selecting specific countries or regions and save 30%!

Power Rental Demand Analysis (2018 to 2022) Vs Market Outlook (2023 to 2033)

The global demand for power rental services is projected to increase at a CAGR of 6.0% during the forecast period between 2023 and 2033, reaching a total of US$ 18.31 Billion in 2033, according to a report from Future Market Insights (FMI). From 2018 to 2022, sales witnessed significant growth, registering a CAGR of 3.2%. According to Future Market Insights, a market research and competitive intelligence provider, the Power Rental market was valued at US$ 9.65 Billion in 2022.

The growth of the power generator rental market will be driven by increased demand for temporary electrical power sources during festivals, events, and fairs in the forthcoming years. These power systems offer peak shaving, allowing various businesses to accurately allocate their power use between non-peak and peak hours.

Global industrialization and the increasing need for dependable electricity supply are some major key trends that are projected to fuel market growth in the near future. The utility and industrial sectors have increased the demand for energy rental generators, owing to the smaller power grids and restricted access to the main transmission network. Additionally, factors such as the implementation of favorable government programs to expand metro and airport networks, as well as an increase in hotel and retail mall buildings, is also accelerating the demand for power rental in both established and growing economies.

Which Drivers underpin Power Rental Industry Expansion?

Increasing Demand for Backup Power Solutions to Fuel the Market Growth

As nations are aggressively preventing themselves off of fossil fuels, the evolution towards renewable energy sources is assembling pace all over the globe, mainly from coal, to meet their energy needs. As a result, investments in renewable technologies have progressively developed in the last few years.

Renewables can sufficiently meet the demand for clean energy globally but an inherent disadvantage of renewables is that they are intermittent. Since energy storage technologies are still in promising stages of development. Thus, backup power solutions are essential for uninterrupted power supply to industries and households.

Power rental services and equipment can fill this gap because they are easy to access, require minimal maintenance, and are cost-effective. This is a major factor that is expected to fuel the growth of the Power Rental Market during the forecast period.

High Usage of Rental Power in the Mining Industry to Accelerate the Market Growth

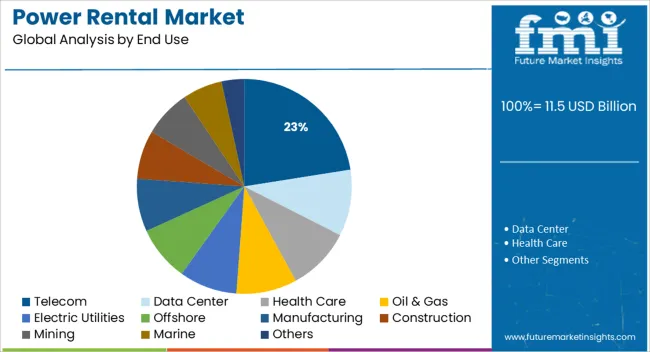
The mining industry is one of the major end users of rental power. The mining sites are not attached to the grid, they rely on generator sets that have been engaged temporarily. The rental generators are in modest demand in industrial businesses, when there is a requirement for extra power during peak load demand, when the existing power supply system, such as purchased generator sets, has to be sustained, or when there is a brief outage.

As a result, the mining industry with poor grid power supplies is severely reliant on the power rental market. Hence, the mining industry is anticipated to boost the growth of the market during the forecast period.

Sudip Saha
Sudip Saha

Principal Consultant

Talk to Analyst

Find your sweet spots for generating winning opportunities in this market.

Which Factors are limiting the Growth of Power Rental Market?

Increased Operational Expenditure of Diesel Generators to Restrain the Market Growth

Diesel generator sets are considered to be one of the most popular backup power solutions for many end-users such as oil & gas, and manufacturing, owing to their quick start-up time, low initial investments, less space requirement, and ease of installation and operation.

However, diesel generator sets entail high operating costs, which is mainly on account of the high cost of fuel. Fuel costs account for over 80% of the total life cycle cost of a diesel generator set. This has made diesel a less cost-efficient solution for backup, especially in view of the drop in solar power prices. This is one of the major factors that is expected to hamper the growth of the power rental market during the forecast period.

Stringent Government Regulations to Limit the Market Growth

Stringent governmental norms have been imposed for diesel fuel globally to reduce emissions and meet environmental regulations. With growing environmental concerns each country has come up with its own set of regulations and policies to reduce air pollution. This is the major factor that is anticipated to restrain the market growth over the analysis period.
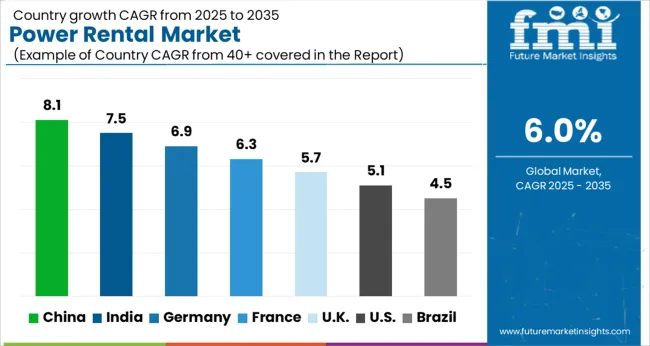
Region-wise Insights

Will North America Continue Dominance in the Global Power Rental Market?

Increased Investments in Mining in the Region to Fuel the Market Growth

The Power Rental Market in North America is expected to accumulate the highest market share of 35% in 2023. North America is the most lucrative region along with the highest market share. Factors such as the rising investments in mining, construction, oil and gas, and related exploratory operations are projected to escalate the demand for the power rental market in North America.

The growing uncertainty of power supply provided by small-scale power grids, along with limited access to the essential transmission network, has raised the demand for rental generators in the utility and industries. In addition, there is a growing need for readily available rental equipment that can help overcome the issues associated with swells, voltage sags, and power outages.

Furthermore, favorable government initiatives to extend metro and airport networks, as well as the construction of hotels and shopping complexes, would raise demand for power renting in both existing and upcoming markets. Other factors to consider include rising renewables deployment and the utilization of natural gas-powered generators. The region is expected to hold a CAGR of 5.9% over the forecast period.

How Will the Growth of the Power Rental Market unfold in Asia Pacific?

Increase in Construction Activities in the Region to Augment the Market Growth

The power rental Market in Asia Pacific is expected to accumulate a market share value of 33.2% in 2022. Currently, in Asia Pacific, China holds a significant market share by value in the global market. China is among the key countries for mining activities. China was also reported to hold more than a 20% share of the global mining industry in the year 2018. The manufacturing sector in China is also growing at an appreciable rate mainly driven by abundant raw material availability and economic labor costs.

Attributed to these factors, the demand for rental power is anticipated to remain high and the market in China is expected to hold a lion’s share of the global market. On the other hand, construction activities in the region are growing at steady rates in the region. All these factors are expected to boost regional market growth.

Get the data you need at a Fraction of the cost

Personalize your report by choosing insights you need
and save 40%!

Category-wise Insights

By Power Rating, which Power Rental Category will remain prominent?

501 to 2,500 KW Segment to beat Competition in Untiring Market

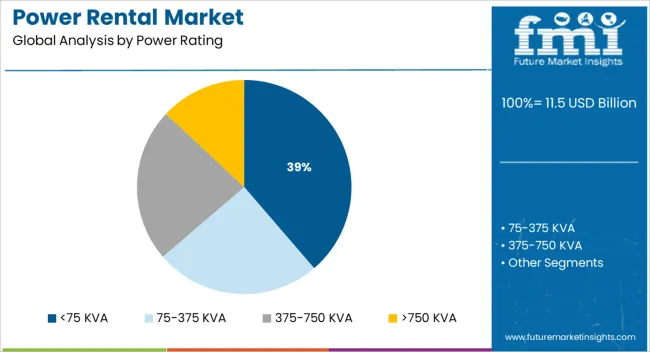
On the basis of power rating, the global Power Rental market is dominated by 501-2,500 KW, which accounts for a share of 32%. This growth is attributed to the critical need for emergency power in heavy-duty applications. The segment is expected to hold a CAGR of 5.9% over the analysis period.

The generators with the power of 501 to 2,500 KW can be used to provide standby power as well as continuous power supply during outages peak shaving. Furthermore, developing countries face power outages more frequently than developed nations. This is due to poor transmission and distribution infrastructure as well as older power plants. To ensure that electricity is easily and reliably accessible to all industries, utility-scale power generation plants have been set up in some parts on a rental basis, which is driving the market.

By Fuel, which Power Rental Category is expected to dominate?

Diesel Segment to Drive the Power Rental Market

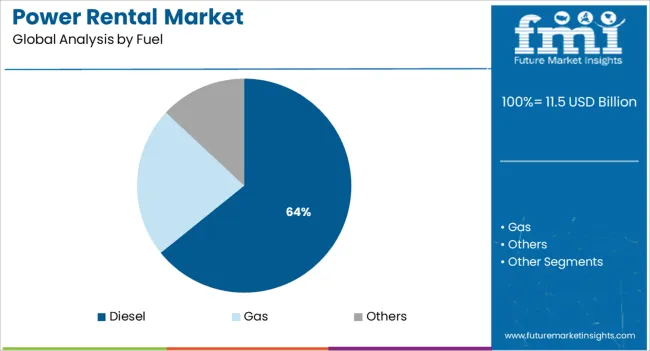
Based on the Fuel, the diesel segment is expected to witness a significant growth of 30% in 2022, and the trend is expected to continue during the forecast period. Diesel generators are widely preferred by key players involved in the mining, oil and gas, and manufacturing sectors. The surplus availability and economical pricing of diesel fuel are among the key factors for the high demand for diesel generator sets for meeting temporary power demand. Moreover, regions such as Latin America, Asia Pacific, the Middle East, and Africa have a weak infrastructure for gas and liquefied petroleum gas pipelines, which adds to the growth in the demand for diesel generators in these regions.

However, regions such as Europe and North America are focused on reducing carbon emissions and are thus strengthening regulations related to the use of diesel. This is expected to retard the global diesel generator rental market growth marginally over the forecast period. The segment is expected to hold a CAGR of 5.8% over the analysis period.

Who are the Leading Players in the Power Rental Market?

Prominent players in the Power Rental market are Herc Rentals Inc., Atlas Copco, APR Energy Ltd., Generac Holdings, United Rentals Inc., Caterpillar Inc., Aggreko Plc., Ashtead Group Plc., Cummins Inc., Wacker Neuson, Kohler Co., Soenergy International, Bredenoord, Allmand Brothers Inc., and Multiquip, Inc., among others.

Recent Developments:

  • In March 2022, United Rentals announced that it will offer its clients a zero-emission power option with the addition of POWRBANK battery systems to its rental fleet. United Rentals' relationship with manufacturer POWR2 Energy Solutions provides an investment in sustainable workplace solutions for North American clients. POWRBANK is a compact power storage system that works with diesel engines to lessen runtime, pollution, congestion, and fuel wastage. The system makes use of high-density lithium-ion batteries, inverters, and load-sensing electronics. The United Rentals POWRBANK type has a power output range of 40KW to 60KW and a storage capacity of 60KW to 120KW hours.
  • In January 2022, Herc Rentals acquired Temp-Power Inc., a provider of power generation rentals serving locations including Virginia, Maryland, and Washington, D.C.
  • In December 2021, with the construction of its largest natural gas unit to date, Generac Industrial Power's edge in gaseous-powered generators expanded. The new SG1000 1000 kW gaseous generator was built with Generac's in-house engine technology and long-lasting MOTORTECH components. This generator will have a significant impact on the market's natural gas business. The SG1000 is suited for a diverse range of products, including healthcare organizations, logistics management centers, educational institutions, and others. When compared to comparable gaseous products at this power node, SG1000 emits more than 75% less harmful NOx and significantly less CO.

Report Scope

Report Attributes Details
Growth Rate CAGR of 6.0% from 2023 to 2033
Market Value in 2023 US$ 10.22 Billion
Market Value in 2033 US$ 18.31 Billion
Base Year for Estimation 2022
Historical Data 2018 to 2022
Forecast Period 2023 to 2033
Quantitative Units Revenue in US$ Billion and CAGR from 2023 to 2033
Report Coverage Revenue Forecast, Company Ranking, Competitive Landscape, Growth Factors, Trends, and Pricing Analysis
Segments Covered
  • Power Rating
  • Fuel
  • End-Use
  • Application
  • Region
Regions Covered
  • North America
  • Latin America
  • Europe
  • East Asia
  • South Asia & Pacific
  • Middle East and Africa (MEA)
Key Countries Profiled
  • USA
  • Canada
  • Brazil
  • Mexico
  • Germany
  • United Kingdom
  • France
  • Spain
  • Italy
  • China
  • Japan
  • South Korea
  • Malaysia
  • Singapore
  • Australia
  • New Zealand
  • GCC Countries
  • South Africa
  • Israel
Key Companies Profiled
  • Caterpillar Inc.
  • Cummins Inc.
  • Aggreko
  • Atlas Copco
  • Kohler-SDMO
  • Shenton Group
  • NIDS GROUP
  • Jassim Transport & Stevedoring Co. K.S.C.C.
  • Pump Power Rental
  • United Rentals
  • Sudhir Power Ltd.
  • Modern Hiring Service
  • Newburn Power Rental Ltd.
  • Global Power Supply
  • FG Wilson
  • ProPower Rental
  • APR Energy
Customization & Pricing Available upon Request

Key Segments Covered in the Power Rental Industry Analysis

Power Rental Market by Power Rating:

  • <75 KVA
  • 75-375 KVA
  • 375-750 KVA
  • >750 KVA

Power Rental Market by Fuel:

  • Diesel
  • Gas
  • Others

Power Rental Market by End-Use:

  • Telecom
  • Data Center
  • Healthcare
  • Oil & Gas
  • Electric Utilities
  • Offshore
  • Manufacturing
  • Construction
  • Mining
  • Marine
  • Others

Power Rental Market by Application:

  • Standby
  • Peak Shaving
  • Prime/Continuous

Power Rental Market by Region:

  • North America
  • Latin America
  • Europe
  • East Asia
  • South Asia & Pacific
  • Middle East & Africa

Frequently Asked Questions

What was the market value for Power Rental in 2022?

As of 2022, the market for Power Rental was valued at US$ 9.65 Billion, as per FMI

At what value did the Power Rental Market close in 2023?

By 2023-end, sales of Power Rental closed at a value of US$ 10.22 Billion.

What was the last 4 years’ value CAGR for Power Rental?

From 2018 to 2022, Power Rental demand expanded at a CAGR of 3.2%

What is the projected forecast CAGR for the Power Rental Industry from 2023 to 2033?

From 2023 to 2033, Power Rental sales are expected to flourish at a CAGR of 6.0%

According to FMI, what is the anticipated market value for Power Rental in 2033?

By 2033, the market value of Power Rental is expected to reach US$ 18.31 Billion

By Power Rating, which category ranks first with regard to Power Rental?

By Power Rating, the 501-2,500 KW segment of the Power Rental constitutes the bulk of the market share of 32% in 2022

By Fuel, which category ranks first with regard to Power Rental?

By Fuel, the Diesel segment dominates the market with a share of 30% in 2022.

Table of Content
1. Executive Summary | Power Rental Market
    1.1. Global Market Outlook
    1.2. Demand-side Trends
    1.3. Supply-side Trends
    1.4. Technology Roadmap Analysis
    1.5. Analysis and Recommendations
2. Market Overview
    2.1. Market Coverage / Taxonomy
    2.2. Market Definition / Scope / Limitations
3. Market Background
    3.1. Market Dynamics
        3.1.1. Drivers
        3.1.2. Restraints
        3.1.3. Opportunity
        3.1.4. Trends
    3.2. Scenario Forecast
        3.2.1. Demand in Optimistic Scenario
        3.2.2. Demand in Likely Scenario
        3.2.3. Demand in Conservative Scenario
    3.3. Opportunity Map Analysis
    3.4. Investment Feasibility Matrix
    3.5. PESTLE and Porter’s Analysis
    3.6. Regulatory Landscape
        3.6.1. By Key Regions
        3.6.2. By Key Countries
    3.7. Regional Parent Market Outlook
4. Global Market Analysis 2018 to 2022 and Forecast, 2023 to 2033
    4.1. Historical Market Size Value (US$ Billion) Analysis, 2018 to 2022
    4.2. Current and Future Market Size Value (US$ Billion) Projections, 2023 to 2033
        4.2.1. Y-o-Y Growth Trend Analysis
        4.2.2. Absolute $ Opportunity Analysis
5. Global Market Analysis 2018 to 2022 and Forecast 2023 to 2033, By Power Rating
    5.1. Introduction / Key Findings
    5.2. Historical Market Size Value (US$ Billion) Analysis By Power Rating, 2018 to 2022
    5.3. Current and Future Market Size Value (US$ Billion) Analysis and Forecast By Power Rating, 2023 to 2033
        5.3.1. <75 KVA
        5.3.2. 75-375 KVA
        5.3.3. 375-750 KVA
        5.3.4. >750 KVA
    5.4. Y-o-Y Growth Trend Analysis By Power Rating, 2018 to 2022
    5.5. Absolute $ Opportunity Analysis By Power Rating, 2023 to 2033
6. Global Market Analysis 2018 to 2022 and Forecast 2023 to 2033, By Fuel
    6.1. Introduction / Key Findings
    6.2. Historical Market Size Value (US$ Billion) Analysis By Fuel, 2018 to 2022
    6.3. Current and Future Market Size Value (US$ Billion) Analysis and Forecast By Fuel, 2023 to 2033
        6.3.1. Diesel
        6.3.2. Gas
        6.3.3. Others
    6.4. Y-o-Y Growth Trend Analysis By Fuel, 2018 to 2022
    6.5. Absolute $ Opportunity Analysis By Fuel, 2023 to 2033
7. Global Market Analysis 2018 to 2022 and Forecast 2023 to 2033, By End Use
    7.1. Introduction / Key Findings
    7.2. Historical Market Size Value (US$ Billion) Analysis By End Use, 2018 to 2022
    7.3. Current and Future Market Size Value (US$ Billion) Analysis and Forecast By End Use, 2023 to 2033
        7.3.1. Telecom
        7.3.2. Data Center
        7.3.3. Health Care
        7.3.4. Oil & Gas
        7.3.5. Electric Utilities
        7.3.6. Offshore
        7.3.7. Manufacturing
        7.3.8. Construction
        7.3.9. Mining
        7.3.10. Marine
        7.3.11. Others
    7.4. Y-o-Y Growth Trend Analysis By End Use, 2018 to 2022
    7.5. Absolute $ Opportunity Analysis By End Use, 2023 to 2033
8. Global Market Analysis 2018 to 2022 and Forecast 2023 to 2033, By Application
    8.1. Introduction / Key Findings
    8.2. Historical Market Size Value (US$ Billion) Analysis By Application, 2018 to 2022
    8.3. Current and Future Market Size Value (US$ Billion) Analysis and Forecast By Application, 2023 to 2033
        8.3.1. Standby
        8.3.2. Peak Shaving
        8.3.3. Prime/Continuous
    8.4. Y-o-Y Growth Trend Analysis By Application, 2018 to 2022
    8.5. Absolute $ Opportunity Analysis By Application, 2023 to 2033
9. Global Market Analysis 2018 to 2022 and Forecast 2023 to 2033, By Region
    9.1. Introduction
    9.2. Historical Market Size Value (US$ Billion) Analysis By Region, 2018 to 2022
    9.3. Current Market Size Value (US$ Billion) Analysis and Forecast By Region, 2023 to 2033
        9.3.1. North America
        9.3.2. Latin America
        9.3.3. Europe
        9.3.4. South Asia & Pacific
        9.3.5. East Asia
        9.3.6. Middle East and Africa(MEA)
    9.4. Market Attractiveness Analysis By Region
10. North America Market Analysis 2018 to 2022 and Forecast 2023 to 2033, By Country
    10.1. Historical Market Size Value (US$ Billion) Trend Analysis By Market Taxonomy, 2018 to 2022
    10.2. Market Size Value (US$ Billion) Forecast By Market Taxonomy, 2023 to 2033
        10.2.1. By Country
            10.2.1.1. USA
            10.2.1.2. Canada
        10.2.2. By Power Rating
        10.2.3. By Fuel
        10.2.4. By End Use
        10.2.5. By Application
    10.3. Market Attractiveness Analysis
        10.3.1. By Country
        10.3.2. By Power Rating
        10.3.3. By Fuel
        10.3.4. By End Use
        10.3.5. By Application
    10.4. Key Takeaways
11. Latin America Market Analysis 2018 to 2022 and Forecast 2023 to 2033, By Country
    11.1. Historical Market Size Value (US$ Billion) Trend Analysis By Market Taxonomy, 2018 to 2022
    11.2. Market Size Value (US$ Billion) Forecast By Market Taxonomy, 2023 to 2033
        11.2.1. By Country
            11.2.1.1. Brazil
            11.2.1.2. Mexico
            11.2.1.3. Rest of Latin America
        11.2.2. By Power Rating
        11.2.3. By Fuel
        11.2.4. By End Use
        11.2.5. By Application
    11.3. Market Attractiveness Analysis
        11.3.1. By Country
        11.3.2. By Power Rating
        11.3.3. By Fuel
        11.3.4. By End Use
        11.3.5. By Application
    11.4. Key Takeaways
12. Europe Market Analysis 2018 to 2022 and Forecast 2023 to 2033, By Country
    12.1. Historical Market Size Value (US$ Billion) Trend Analysis By Market Taxonomy, 2018 to 2022
    12.2. Market Size Value (US$ Billion) Forecast By Market Taxonomy, 2023 to 2033
        12.2.1. By Country
            12.2.1.1. Germany
            12.2.1.2. United Kingdom
            12.2.1.3. France
            12.2.1.4. Spain
            12.2.1.5. Italy
            12.2.1.6. Rest of Europe
        12.2.2. By Power Rating
        12.2.3. By Fuel
        12.2.4. By End Use
        12.2.5. By Application
    12.3. Market Attractiveness Analysis
        12.3.1. By Country
        12.3.2. By Power Rating
        12.3.3. By Fuel
        12.3.4. By End Use
        12.3.5. By Application
    12.4. Key Takeaways
13. South Asia & Pacific Market Analysis 2018 to 2022 and Forecast 2023 to 2033, By Country
    13.1. Historical Market Size Value (US$ Billion) Trend Analysis By Market Taxonomy, 2018 to 2022
    13.2. Market Size Value (US$ Billion) Forecast By Market Taxonomy, 2023 to 2033
        13.2.1. By Country
            13.2.1.1. India
            13.2.1.2. Malaysia
            13.2.1.3. Singapore
            13.2.1.4. Thailand
            13.2.1.5. Australia
            13.2.1.6. New Zealand
            13.2.1.7. Rest of South Asia & Pacific
        13.2.2. By Power Rating
        13.2.3. By Fuel
        13.2.4. By End Use
        13.2.5. By Application
    13.3. Market Attractiveness Analysis
        13.3.1. By Country
        13.3.2. By Power Rating
        13.3.3. By Fuel
        13.3.4. By End Use
        13.3.5. By Application
    13.4. Key Takeaways
14. East Asia Market Analysis 2018 to 2022 and Forecast 2023 to 2033, By Country
    14.1. Historical Market Size Value (US$ Billion) Trend Analysis By Market Taxonomy, 2018 to 2022
    14.2. Market Size Value (US$ Billion) Forecast By Market Taxonomy, 2023 to 2033
        14.2.1. By Country
            14.2.1.1. China
            14.2.1.2. Japan
            14.2.1.3. South Korea
        14.2.2. By Power Rating
        14.2.3. By Fuel
        14.2.4. By End Use
        14.2.5. By Application
    14.3. Market Attractiveness Analysis
        14.3.1. By Country
        14.3.2. By Power Rating
        14.3.3. By Fuel
        14.3.4. By End Use
        14.3.5. By Application
    14.4. Key Takeaways
15. MEA Market Analysis 2018 to 2022 and Forecast 2023 to 2033, By Country
    15.1. Historical Market Size Value (US$ Billion) Trend Analysis By Market Taxonomy, 2018 to 2022
    15.2. Market Size Value (US$ Billion) Forecast By Market Taxonomy, 2023 to 2033
        15.2.1. By Country
            15.2.1.1. GCC Countries
            15.2.1.2. South Africa
            15.2.1.3. Israel
            15.2.1.4. Rest of Middle East and Africa(MEA)
        15.2.2. By Power Rating
        15.2.3. By Fuel
        15.2.4. By End Use
        15.2.5. By Application
    15.3. Market Attractiveness Analysis
        15.3.1. By Country
        15.3.2. By Power Rating
        15.3.3. By Fuel
        15.3.4. By End Use
        15.3.5. By Application
    15.4. Key Takeaways
16. Key Countries Market Analysis
    16.1. USA
        16.1.1. Pricing Analysis
        16.1.2. Market Share Analysis, 2021
            16.1.2.1. By Power Rating
            16.1.2.2. By Fuel
            16.1.2.3. By End Use
            16.1.2.4. By Application
    16.2. Canada
        16.2.1. Pricing Analysis
        16.2.2. Market Share Analysis, 2021
            16.2.2.1. By Power Rating
            16.2.2.2. By Fuel
            16.2.2.3. By End Use
            16.2.2.4. By Application
    16.3. Brazil
        16.3.1. Pricing Analysis
        16.3.2. Market Share Analysis, 2021
            16.3.2.1. By Power Rating
            16.3.2.2. By Fuel
            16.3.2.3. By End Use
            16.3.2.4. By Application
    16.4. Mexico
        16.4.1. Pricing Analysis
        16.4.2. Market Share Analysis, 2021
            16.4.2.1. By Power Rating
            16.4.2.2. By Fuel
            16.4.2.3. By End Use
            16.4.2.4. By Application
    16.5. Germany
        16.5.1. Pricing Analysis
        16.5.2. Market Share Analysis, 2021
            16.5.2.1. By Power Rating
            16.5.2.2. By Fuel
            16.5.2.3. By End Use
            16.5.2.4. By Application
    16.6. United Kingdom
        16.6.1. Pricing Analysis
        16.6.2. Market Share Analysis, 2021
            16.6.2.1. By Power Rating
            16.6.2.2. By Fuel
            16.6.2.3. By End Use
            16.6.2.4. By Application
    16.7. France
        16.7.1. Pricing Analysis
        16.7.2. Market Share Analysis, 2021
            16.7.2.1. By Power Rating
            16.7.2.2. By Fuel
            16.7.2.3. By End Use
            16.7.2.4. By Application
    16.8. Spain
        16.8.1. Pricing Analysis
        16.8.2. Market Share Analysis, 2021
            16.8.2.1. By Power Rating
            16.8.2.2. By Fuel
            16.8.2.3. By End Use
            16.8.2.4. By Application
    16.9. Italy
        16.9.1. Pricing Analysis
        16.9.2. Market Share Analysis, 2021
            16.9.2.1. By Power Rating
            16.9.2.2. By Fuel
            16.9.2.3. By End Use
            16.9.2.4. By Application
    16.10. India
        16.10.1. Pricing Analysis
        16.10.2. Market Share Analysis, 2021
            16.10.2.1. By Power Rating
            16.10.2.2. By Fuel
            16.10.2.3. By End Use
            16.10.2.4. By Application
    16.11. Malaysia
        16.11.1. Pricing Analysis
        16.11.2. Market Share Analysis, 2021
            16.11.2.1. By Power Rating
            16.11.2.2. By Fuel
            16.11.2.3. By End Use
            16.11.2.4. By Application
    16.12. Singapore
        16.12.1. Pricing Analysis
        16.12.2. Market Share Analysis, 2021
            16.12.2.1. By Power Rating
            16.12.2.2. By Fuel
            16.12.2.3. By End Use
            16.12.2.4. By Application
    16.13. Thailand
        16.13.1. Pricing Analysis
        16.13.2. Market Share Analysis, 2021
            16.13.2.1. By Power Rating
            16.13.2.2. By Fuel
            16.13.2.3. By End Use
            16.13.2.4. By Application
    16.14. China
        16.14.1. Pricing Analysis
        16.14.2. Market Share Analysis, 2021
            16.14.2.1. By Power Rating
            16.14.2.2. By Fuel
            16.14.2.3. By End Use
            16.14.2.4. By Application
    16.15. Japan
        16.15.1. Pricing Analysis
        16.15.2. Market Share Analysis, 2021
            16.15.2.1. By Power Rating
            16.15.2.2. By Fuel
            16.15.2.3. By End Use
            16.15.2.4. By Application
    16.16. South Korea
        16.16.1. Pricing Analysis
        16.16.2. Market Share Analysis, 2021
            16.16.2.1. By Power Rating
            16.16.2.2. By Fuel
            16.16.2.3. By End Use
            16.16.2.4. By Application
    16.17. Australia
        16.17.1. Pricing Analysis
        16.17.2. Market Share Analysis, 2021
            16.17.2.1. By Power Rating
            16.17.2.2. By Fuel
            16.17.2.3. By End Use
            16.17.2.4. By Application
    16.18. New Zealand
        16.18.1. Pricing Analysis
        16.18.2. Market Share Analysis, 2021
            16.18.2.1. By Power Rating
            16.18.2.2. By Fuel
            16.18.2.3. By End Use
            16.18.2.4. By Application
    16.19. GCC Countries
        16.19.1. Pricing Analysis
        16.19.2. Market Share Analysis, 2021
            16.19.2.1. By Power Rating
            16.19.2.2. By Fuel
            16.19.2.3. By End Use
            16.19.2.4. By Application
    16.20. South Africa
        16.20.1. Pricing Analysis
        16.20.2. Market Share Analysis, 2021
            16.20.2.1. By Power Rating
            16.20.2.2. By Fuel
            16.20.2.3. By End Use
            16.20.2.4. By Application
    16.21. Israel
        16.21.1. Pricing Analysis
        16.21.2. Market Share Analysis, 2021
            16.21.2.1. By Power Rating
            16.21.2.2. By Fuel
            16.21.2.3. By End Use
            16.21.2.4. By Application
17. Market Structure Analysis
    17.1. Competition Dashboard
    17.2. Competition Benchmarking
    17.3. Market Share Analysis of Top Players
        17.3.1. By Regional
        17.3.2. By Power Rating
        17.3.3. By Fuel
        17.3.4. By End Use
        17.3.5. By Application
18. Competition Analysis
    18.1. Competition Deep Dive
        18.1.1. Atlas Copco AB
            18.1.1.1. Overview
            18.1.1.2. Product Portfolio
            18.1.1.3. Profitability by Market Segments
            18.1.1.4. Sales Footprint
            18.1.1.5. Strategy Overview
                18.1.1.5.1. Marketing Strategy
        18.1.2. Caterpillar
            18.1.2.1. Overview
            18.1.2.2. Product Portfolio
            18.1.2.3. Profitability by Market Segments
            18.1.2.4. Sales Footprint
            18.1.2.5. Strategy Overview
                18.1.2.5.1. Marketing Strategy
        18.1.3. Value (US$ Billion)ed Rentals, Inc.
            18.1.3.1. Overview
            18.1.3.2. Product Portfolio
            18.1.3.3. Profitability by Market Segments
            18.1.3.4. Sales Footprint
            18.1.3.5. Strategy Overview
                18.1.3.5.1. Marketing Strategy
        18.1.4. Cummins Inc.
            18.1.4.1. Overview
            18.1.4.2. Product Portfolio
            18.1.4.3. Profitability by Market Segments
            18.1.4.4. Sales Footprint
            18.1.4.5. Strategy Overview
                18.1.4.5.1. Marketing Strategy
        18.1.5. Aggreko
            18.1.5.1. Overview
            18.1.5.2. Product Portfolio
            18.1.5.3. Profitability by Market Segments
            18.1.5.4. Sales Footprint
            18.1.5.5. Strategy Overview
                18.1.5.5.1. Marketing Strategy
        18.1.6. Generac Power Systems, Inc.
            18.1.6.1. Overview
            18.1.6.2. Product Portfolio
            18.1.6.3. Profitability by Market Segments
            18.1.6.4. Sales Footprint
            18.1.6.5. Strategy Overview
                18.1.6.5.1. Marketing Strategy
        18.1.7. Kohler-SDMO
            18.1.7.1. Overview
            18.1.7.2. Product Portfolio
            18.1.7.3. Profitability by Market Segments
            18.1.7.4. Sales Footprint
            18.1.7.5. Strategy Overview
                18.1.7.5.1. Marketing Strategy
        18.1.8. Ashtead Group
            18.1.8.1. Overview
            18.1.8.2. Product Portfolio
            18.1.8.3. Profitability by Market Segments
            18.1.8.4. Sales Footprint
            18.1.8.5. Strategy Overview
                18.1.8.5.1. Marketing Strategy
        18.1.9. Herc Rentals Inc.
            18.1.9.1. Overview
            18.1.9.2. Product Portfolio
            18.1.9.3. Profitability by Market Segments
            18.1.9.4. Sales Footprint
            18.1.9.5. Strategy Overview
                18.1.9.5.1. Marketing Strategy
        18.1.10. Shenton Group
            18.1.10.1. Overview
            18.1.10.2. Product Portfolio
            18.1.10.3. Profitability by Market Segments
            18.1.10.4. Sales Footprint
            18.1.10.5. Strategy Overview
                18.1.10.5.1. Marketing Strategy
        18.1.11. Bredenoord
            18.1.11.1. Overview
            18.1.11.2. Product Portfolio
            18.1.11.3. Profitability by Market Segments
            18.1.11.4. Sales Footprint
            18.1.11.5. Strategy Overview
                18.1.11.5.1. Marketing Strategy
        18.1.12. Al Faris Group
            18.1.12.1. Overview
            18.1.12.2. Product Portfolio
            18.1.12.3. Profitability by Market Segments
            18.1.12.4. Sales Footprint
            18.1.12.5. Strategy Overview
                18.1.12.5.1. Marketing Strategy
        18.1.13. Modern Hiring Service
            18.1.13.1. Overview
            18.1.13.2. Product Portfolio
            18.1.13.3. Profitability by Market Segments
            18.1.13.4. Sales Footprint
            18.1.13.5. Strategy Overview
                18.1.13.5.1. Marketing Strategy
        18.1.14. Perfect Hiring Services
            18.1.14.1. Overview
            18.1.14.2. Product Portfolio
            18.1.14.3. Profitability by Market Segments
            18.1.14.4. Sales Footprint
            18.1.14.5. Strategy Overview
                18.1.14.5.1. Marketing Strategy
        18.1.15. APR Energy
            18.1.15.1. Overview
            18.1.15.2. Product Portfolio
            18.1.15.3. Profitability by Market Segments
            18.1.15.4. Sales Footprint
            18.1.15.5. Strategy Overview
                18.1.15.5.1. Marketing Strategy
        18.1.16. HIMOINSA
            18.1.16.1. Overview
            18.1.16.2. Product Portfolio
            18.1.16.3. Profitability by Market Segments
            18.1.16.4. Sales Footprint
            18.1.16.5. Strategy Overview
                18.1.16.5.1. Marketing Strategy
        18.1.17. Wärtsilä
            18.1.17.1. Overview
            18.1.17.2. Product Portfolio
            18.1.17.3. Profitability by Market Segments
            18.1.17.4. Sales Footprint
            18.1.17.5. Strategy Overview
                18.1.17.5.1. Marketing Strategy
        18.1.18. Sudhir Power Ltd.
            18.1.18.1. Overview
            18.1.18.2. Product Portfolio
            18.1.18.3. Profitability by Market Segments
            18.1.18.4. Sales Footprint
            18.1.18.5. Strategy Overview
                18.1.18.5.1. Marketing Strategy
        18.1.19. Wagner Equipment Co.
            18.1.19.1. Overview
            18.1.19.2. Product Portfolio
            18.1.19.3. Profitability by Market Segments
            18.1.19.4. Sales Footprint
            18.1.19.5. Strategy Overview
                18.1.19.5.1. Marketing Strategy
        18.1.20. Perennial Technologies
            18.1.20.1. Overview
            18.1.20.2. Product Portfolio
            18.1.20.3. Profitability by Market Segments
            18.1.20.4. Sales Footprint
            18.1.20.5. Strategy Overview
                18.1.20.5.1. Marketing Strategy
19. Assumptions & Acronyms Used
20. Research Methodology
Recommendations

Industrial Automation

Compact Power Equipment Rental Market

July 2023

REP-GB-116

315 pages

Industrial Automation

Power Device Analyzer Market

May 2023

REP-GB-14273

324 pages

Technology

Power Distribution Unit (PDU) Market

May 2022

REP-GB-14665

275 pages

Explore Services and Utilities Insights

View Reports
Future Market Insights

Power Rental Market

Schedule a Call