Reports

- Global Locations -

Headquarters

Future Market Insights, Inc.

Christiana Corporate, 200
Continental Drive, Suite 401,
Newark, Delaware - 19713,
United States

T: +1-347-918-3531

Americas

Future Market Insights, Inc.

616 Corporate Way, Suite 2-9018,
Valley Cottage, NY 10989, United States

MEA

Future Market Insights

1602-6 Jumeirah Bay X2 Tower, Plot No: JLT-PH2-X2A,
Jumeirah Lakes Towers, Dubai,
United Arab Emirates

Europe

Future Market Insights

3rd Floor, 207 Regent Street,
W1B 3HH London
United Kingdom

T: + 44 (0) 20 8123 9659

Asia Pacific

Future Market Insights

IndiaLand Global Tech Park, Unit UG-1, Behind Grand HighStreet, Phase 1, Hinjawadi, MH, Pune – 411057, India

Powered Surgical Staplers Market Snapshot (2023 to 2033)

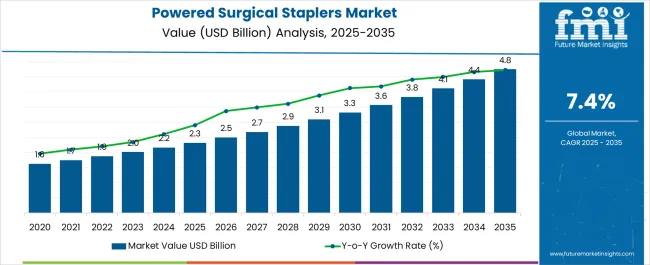
The global powered surgical staplers market is expected to grow at a CAGR of 7.8% over the forecast period. The market value is projected to increase from US$ 2.0 billion in 2023 to US$ 4.2 billion by 2033. The powered surgical staplers market was valued at US$ 1.9 billion at the end of 2022 and is anticipated to exhibit Y-o-Y growth of 7.1% in 2023.

Market Outlook

Key Market Attributes

Market Size, 2022 US$ 1.9 Billion
Market Size, 2023 US$ 2.0 Billion
Market Size, 2033 US$ 4.2 Billion
Value CAGR (2023 to 2033) 7.8%

Due to the developments in surgical technology and an increasing inclination for minimally invasive procedures, surgical staplers, both manual staplers and powered staplers, have played a pivotal role in transforming modern surgical practices. The powered surgical staplers segment, driven by these cutting-edge technologies, has grown dramatically in recent years.

These innovative powered staplers provide precision, speed, and safety, resulting in fewer complications and better patient outcomes as compared to sutures. Powered surgical staplers are becoming increasingly important in a variety of specialties, ranging from gastrointestinal to bariatric surgery, as the global healthcare landscape advances. The powered surgical staplers market is positioned for ongoing expansion, meeting the demands of modern surgical practices, generating improved surgical experiences, thanks to increased demand for efficient and effective surgical equipment, and developing healthcare infrastructure.

Don't pay for what you don't need

Customize your report by selecting specific countries or regions and save 30%!

Analysis of Historical and Future Outlook of Powered Surgical Staplers Market

The global powered surgical staplers market recorded a historic CAGR of 5.7% in the last 5 years from 2017 to 2022. The market value for the powered surgical staplers market was around 38.6% of the overall US$ 4.8 billion of the global surgical staplers market.

Semi Annual Market Update

Particular Value CAGR
H1 6.95% (2022 to 2032)
H2 8.60% (2022 to 2032)
H1 6.98% (2023 to 2033)
H2 8.63% (2023 to 2033)

Surgical method advancements have emerged as a prominent market growth factor for the powered surgical staplers business. These devices have evolved in concert with new surgical techniques, allowing surgeons to conduct complex surgeries with greater precision and speed.

As surgical procedures become less invasive, powered surgical staplers have gained popularity due to their ability to perform precise movements through tiny wounds. The incorporation of articulation elements in staplers improve access and movement inside small anatomical spaces, facilitating the use of minimally invasive procedures.

Also, the inclusion of real-time feedback systems and clever sensors in current stapler designs helps surgeons make informed decisions during key periods of surgery. This decreases the possibility of errors and difficulties, thus increasing demand for these modern gadgets.

The increased use of robotic-assisted surgeries and computer-assisted surgeries has increased the demand for appropriate powered staplers that can interact seamlessly with these platforms. Surgeons benefit from improved ergonomics and precision control, while patients benefit from less tissue trauma and faster recovery times.

As surgical disciplines continue to perfect their procedures and embrace technology developments, powered surgical staplers are becoming indispensable instruments that not only keep up with these advancements but also help to push the frontiers of what is possible in modern surgery. As a result, the synergy between evolving surgical techniques and powered stapler technology is projected to continue market expansion by serving the changing needs of surgeons and patients alike.

Brief Outlook of Key Opportunities Propelling the Global Market

The growing number of surgical procedures like abdominal surgery and thoracic surgery worldwide is a key driver for the powered surgical staplers market. As medical interventions become more prevalent due to an increased incidence of chronic diseases like appendicitis, hernia and to treat varicose veins and evolving surgical techniques, the demand for advanced tools like powered staplers rises.

These devices offer efficiency, accuracy, and reduced operating times, making them essential in various surgical specialities. The trend toward minimally invasive procedures also fuels adoption, as powered staplers enable precise tissue closure, contributing to better patient outcomes and shorter recovery periods. This surge in surgical cases propels the market's growth trajectory, emphasizing the crucial role of powered surgical staplers in modern healthcare practices.

Sabyasachi Ghosh
Sabyasachi Ghosh

Principal Consultant

Talk to Analyst

Find your sweet spots for generating winning opportunities in this market.

Analysis of Key Factors Presenting a Restrictive Outlook for Global Market

The occurrence of early staple-line failure while dealing with tumours in close proximity is a significant growth limitation in the powered surgical staplers industry. Securing staple lines in complex procedures involving tumours near important tissues can be difficult.

Inadequate tissue perfusion, impaired integrity, and possible leakage can all lead to postoperative problems that necessitate costly repairs. To mitigate this issue, surgeons must carefully examine tissue thickness and stapler choices, frequently choosing manual suturing in crucial cases.

This constraint emphasizes the importance of continuing innovation in stapler design and surgical techniques for efficiently addressing close proximity tumour scenarios, assuring optimal outcomes while minimizing the detrimental impact on patient recovery and healthcare expenses.

Country-wise insights

Market Growth Outlook by Key Countries

Countries Value CAGR
United States 6.5%
Germany 8.4%
United Kingdom 6.7%
Japan 7.3%
China 7.5%
India 7.1%

United States - a Booming Market for Powered Surgical Staplers

The United States dominates the global market with 30.9% market share in 2022 and is projected to continue experiencing high growth throughout the forecast period. The increased number of bariatric procedures in the United States is a significant market growth factor for powered surgical staplers. As obesity rates rise, so does the need for weight loss operations.

  • According to the article published in the Journal Annals of Surgery on February 2021, about 30 million persons in the United States meet NIH (National Institute of Health) requirements for bariatric surgery.

Powered staplers are essential in these procedures for ensuring secure tissue closure, decreasing postoperative problems, and promoting speedier recovery. Their precision and efficiency are in line with the unique requirements of bariatric surgeries, which is boosting acceptance. With a rising emphasis on living a better lifestyle, the bariatric surgery trend is projected to continue, boosting demand for advanced-powered surgical staplers designed specifically for this medical field.

Analysis of Key Factors Making China a Highly Lucrative Market

China held 7.6% of the global market share in 2022. In China, the increasing number of surgical procedures is a significant market growth factor for powered surgical staplers. The country's expanding healthcare infrastructure and rising prevalence of chronic diseases all contribute to an increased need for surgical procedures.

  • According to the article published in Journal Surgery in Practice and Science on December 2021, the number of tension-free hernia repair surgeries in China is projected to have reached 1 million in 2015, with an annual increase of 20% to 30%.

Powered staplers improve surgical efficiency, decrease operative time, and improve patient outcomes. As China's medical landscape advances, the adoption of innovative surgical equipment such as powered staplers becomes critical, fueling market growth and providing optimal healthcare delivery.

Brief Assessment of Germany as an Emerging Market for Powered Surgical Staplers

Germany holds about 7.0% share of the global market in 2022 and is projected to increase during the forecast period. Germany's emphasis on preventing contamination in surgical operations drives the growth of the powered surgical staplers market. These devices provide sterile, single-use options, lowering the danger of infection, which is a major concern in modern healthcare settings.

Powered staplers provide for precise and rapid tissue closure, reducing exposure time and potential contamination sources. As infection control remains a primary priority, powered surgical staplers meet Germany's demanding healthcare requirements, propelling their use in a variety of surgical specialties.

The desire for improved patient safety and results underpins this market development factor, underscoring the significance of sophisticated stapling technology.

Get the data you need at a Fraction of the cost

Personalize your report by choosing insights you need
and save 40%!

Category-wise Insights

Insight into Leading Product in the Powered Surgical Staplers Market

Market Growth Outlook by Key Product

Product Value CAGR
Powered Linear Stapler 8.1%
Circular Stapling System 7.3%

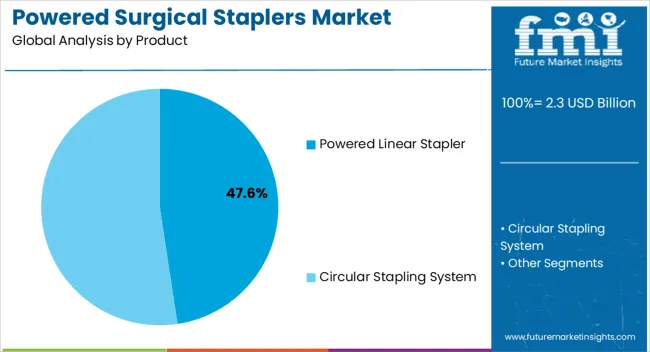
Powered linear staplers within the product segment hold a revenue share of 65.4% in 2022, and the same trend is being followed over the forecasted period. Due to their versatility and precision, powered linear staplers dominate the global market. They provide constant staple development along the whole length of the incision, which is essential for a variety of surgical operations. Since this technology provides rapid tissue closure, fewer complications, and speedier surgeries, powered linear staplers are a favorite choice for surgeons looking for dependable and effective stapling solutions.

Brief Overview of Application Occupying a Dominant Share Globally

Market Growth Outlook by Key Applications

Application Value CAGR
Abdominal Surgery 7.3%
Gynecology and Obstetrics Surgeries 7.7%
Pediatric Surgery 8.0%
Thoracic Surgery. 8.4%
Others 8.8%

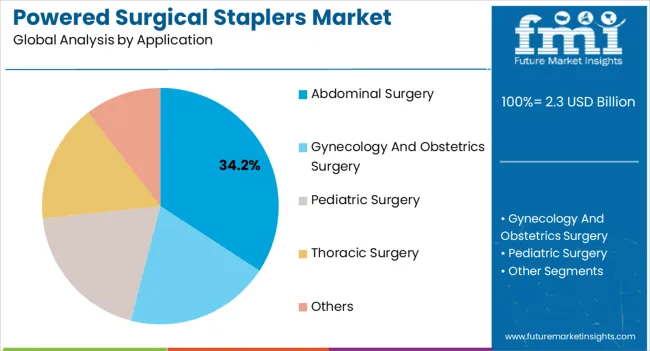
Abdominal Surgery held a market share of 36.7% in 2022. Due to their incidence and complexity, abdominal procedures dominate the global market. These operations include a wide range of procedures, such as gastrointestinal and bariatric surgeries, where tight tissue closure is critical. Powered staplers improve efficiency, precision, and operative time, all of which contribute to better patient outcomes. Their versatility in a variety of abdominal procedures establishes them as a cornerstone in modern surgical treatments, fueling their supremacy.

Analysis of Key Usage Segment Accounting for High Sales

Market Growth Outlook by Key Usage

Usage Value CAGR
Single-use 8.4%
Reusable 7.6%

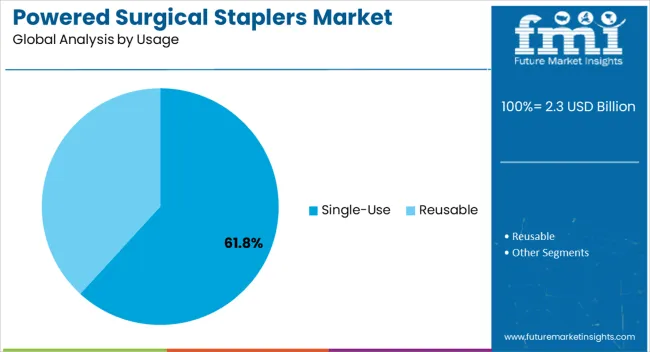
Reusable segment holds a market share of 73.3% in 2022. The reusable segment's dominance in the use of powered surgical staplers is attributed to cost-effectiveness and sustainability. While single-use staplers reduce infection hazards, reusable devices provide long-term cost savings. Hospitals put cost-efficiency over patient safety, resulting in a widespread preference for reused staplers. This tendency emphasizes the importance of striking a balance between high-quality patient care and sensible resource management.

Overview of Key End User driving Most Sales in the Market

Market Growth Outlook by Key End User

End User Value CAGR
Hospitals 6.9%
Specialty Clinics 7.8%
Ambulatory Surgery Centers 8.6%
Others 9.4%

Hospitals held a market share of 43.2% in 2022. Given their role as key locations for surgical procedures, hospitals dominate the end-user segment of the global market. The regulated environment, the availability of experienced medical professionals, and the necessity for sophisticated surgical equipment drive the need for powered staplers. The fact that hospitals have a large caseload and a focus on patient outcomes solidifies their position as the major users of these novel surgical instruments.
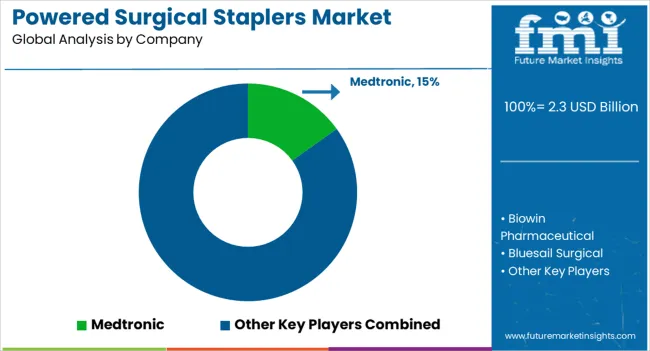
Competitive Landscape

Leading powered surgical stapler firms prioritize strategic collaborations as they attempt to develop new product lines and increase their global consumer base.

  • In March 2022, the SiderluxTM Powered endoscopic stapler, invented and built independently by a Bluesail Surgical subsidiary, recently received clearance for marketing.

Similarly, recent developments related to companies in the powered surgical staplers market have been tracked by the team at Future Market Insights, which are available in the full report.

Related Market Growth Outlook Scenario

Particulars Value CAGR
Surgical Stapling Devices Market 8.3%
Surgical Sutures Market 5.3%
Surgical Needles Market 5.4%

Report Scope as per Powered Surgical Staplers Industry Analysis

Attribute Details
Forecast Period 2023 to 2033
Historical Data Available for 2017 to 2022
Market Analysis US$ Million for Value, Units for Volume
Key Regions Covered North America, Latin America, Europe, South Asia, East Asia, Oceania, and Middle East and Africa
Key Countries Covered United States, Canada, Brazil, Mexico, Argentina, United Kingdom, Germany, Italy, Russia, Spain, France, BENELUX, India, Thailand, Indonesia, Malaysia, Japan, China, South Korea, Australia, New Zealand, Türkiye, GCC Countries, South Africa, and Northern Africa
Key Market Segments Covered Product, Application, Usage, End User and Region

Key Companies Profiled

  • Medtronic Plc
  • Biowin Pharmaceutical
  • Bluesail Surgical
  • Changzhou Ankang Medical Instruments
  • Golden Stapler Surgical
  • Jiangsu Channel Medical Device
  • Miconvey
  • Ningbo David Medical Device
  • Panther Healthcare
  • Sinolinks Medical Innovation
  • Waston medical
  • Ethicon
  • Surgnova
  • Lepu Medical Technology(Beijing)Co.,Ltd
  • Victor Medical Instruments Co., Ltd.
  • CJ Medical
Report Coverage Market Forecast, Competition Intelligence, DROT Analysis, Market Dynamics and Challenges, Strategic Growth Initiatives
Pricing Available upon Request

Key Market Segments Covered in Powered Surgical Staplers Industry Research

By Product:

  • Powered Linear Stapler
  • Circular Stapling System

By Application:

  • Abdominal Surgery
  • Gynecology and Obstetrics Surgery
  • Pediatric Surgery
  • Thoracic Surgery.
  • Others

By Usage:

  • Single-use
  • Reusable

By End User:

  • Hospitals
  • Specialty Clinics
  • Ambulatory Surgery Centers
  • Others

By Region:

  • North America
  • Latin America
  • Europe
  • South Asia
  • East Asia
  • Oceania
  • Middle East and Africa (MEA)

Frequently Asked Questions

How large is the global market in 2022?

The global market is currently valued at around USD 1.9 billion in 2022.

What is the global market projected value for 2023?

The global market is set to reach a valuation of around USD 2.0 billion by 2033.

What was the last 5 years’ CAGR for the global market?

Demand for the global market increased at a 6.5% CAGR from 2017 to 2022.

What is the sales forecast for the global market through 2033?

The global market is set to reach USD 4.2 billion in 2033.

Which product segment contributes more to the global market?

Powered linear stapler segment held 65.4% share of the global market in 2022.

What is the estimated CAGR during the forecast period?

The global market is set to grow at a CAGR of 7.8% between 2023 and 2033

What is the United States market outlook?

The United States accounts for around 30.9% share of the global market in 2022.

Which End User Occupies a Leading Share of the Market?

Hospitals are leading shareholders with 43.2% of the global market share.

What is the China market outlook?

The China market held a share of about 45.7% of the East Asia market in 2022.

Table of Content

1. Executive Summary

    1.1. Global Market Outlook

    1.2. Demand Side Trends

    1.3. Supply Side Trends

    1.4. Analysis and Recommendations

2. Market Overview

    2.1. Market Coverage / Taxonomy

    2.2. Market Definition / Scope / Limitations

    2.3. Inclusion and Exclusions

3. Key Market Trends

    3.1. Key Trends Impacting the Market

    3.2. Technology Innovation/Development Trends

4. Value Added Insights

    4.1. Adoption Rate for Powered Surgical Staplers

    4.2. Regulatory Landscape

    4.3. PESTLE Analysis

    4.4. Porter's Analysis

    4.5. Pipeline Assessment

    4.6. Unmet Needs

5. Market Background

    5.1. Macro-Economic Factors

        5.1.1. Global Healthcare Expenditure Outlook

        5.1.2. Global Parent Market Analysis (Global Surgical Staplers Market)

        5.1.3. Global Research and Development Funding by Region

    5.2. Forecast Factors - Relevance and Impact

        5.2.1. Increasing Prevalence of Chronic Disease

        5.2.2. Growing Investment in Healthcare Expenditure

        5.2.3. Novel Technology

        5.2.4. Technological Advancement

        5.2.5. Novel Techniques

        5.2.6. Top Companies’ Historical Growth

        5.2.7. Technology-Based Cost

        5.2.8. Strategic Collaboration and Partnership

    5.3. Market Dynamics

        5.3.1. Drivers

        5.3.2. Restraints

        5.3.3. Opportunity Analysis

6. Global Market Demand (in Volume Units) Analysis 2017 to 2022 and Forecast, 2023 to 2033

    6.1. Historical Market Volume (Units) Analysis, 2017 to 2022

    6.2. Current and Future Market Volume (Units) Projections, 2023 to 2033

        6.2.1. Y-o-Y Growth Trend Analysis

7. Global Market to Pricing Assessment

    7.1. Regional Pricing Analysis, By Products

    7.2. Pricing Break-up

        7.2.1. Manufacturer Level Pricing

        7.2.2. Distributor Level Pricing

    7.3. Global Average Pricing Analysis Benchmark, By Pricing

    7.4. Pricing Assumptions

8. Global Market Demand (in Value or Size in US$ Million) Analysis 2017 to 2022 and Forecast, 2023 to 2033

    8.1. Revenue Opportunity Scenario- Likely/Conservative/Optimistic

    8.2. Historical Market Value (US$ Million) Analysis, 2017 to 2022

    8.3. Current and Future Market Value (US$ Million) Projections, 2023 to 2033

        8.3.1. Y-o-Y Growth Trend Analysis

        8.3.2. Absolute $ Opportunity Analysis

9. Global Market Analysis 2017 to 2022 and Forecast 2023 to 2033, By Product

    9.1. Introduction / Key Findings

    9.2. Historical Market Size (US$ Million) Analysis By Product, 2017 to 2022

    9.3. Current and Future Market Size (US$ Million) Analysis and Forecast By Product, 2023 to 2033

        9.3.1. Powered Linear Stapler

        9.3.2. Circular Stapling System

    9.4. Market Attractiveness Analysis By Product

10. Global Market Analysis 2017 to 2022 and Forecast 2023 to 2033, By Application

    10.1. Introduction / Key Findings

    10.2. Historical Market Size (US$ Million) Analysis by Application, 2017 to 2022

    10.3. Current and Future Market Size (US$ Million) Analysis and Forecast by Application, 2023 to 2033

        10.3.1. Abdominal Surgery

        10.3.2. Gynecology and Obstetric Surgeries

        10.3.3. Pediatric Surgery

        10.3.4. Thoracic Surgery.

        10.3.5. Others

    10.4. Market Attractiveness Analysis by Application

11. Global Market Analysis 2017 to 2022 and Forecast 2023 to 2033, By Usage

    11.1. Introduction / Key Findings

    11.2. Historical Market Size (US$ Million) Analysis by Usage, 2017 to 2022

    11.3. Current and Future Market Size (US$ Million) Analysis and Forecast by Usage, 2023 to 2033

        11.3.1. Single-use

        11.3.2. Reusable

    11.4. Market Attractiveness Analysis by Usage

12. Global Market Analysis 2017 to 2022 and Forecast 2023 to 2033, By End User

    12.1. Introduction / Key Findings

    12.2. Historical Market Size (US$ Million) Analysis by End User, 2017 to 2022

    12.3. Current and Future Market Size (US$ Million) Analysis and Forecast by End User, 2023 to 2033

        12.3.1. Hospitals

        12.3.2. Specialty Clinics

        12.3.3. Ambulatory Surgery Centers

        12.3.4. Others

    12.4. Market Attractiveness Analysis by End User

13. Global Market Analysis 2017 to 2022 and Forecast 2023 to 2033, By Region

    13.1. Introduction

    13.2. Historical Market Size (US$ Million) Analysis by Region, 2017 to 2022

    13.3. Current and Future Market Size (US$ Million) Analysis and Forecast by Region, 2023 to 2033

        13.3.1. North America

        13.3.2. Latin America

        13.3.3. Europe

        13.3.4. East Asia

        13.3.5. South Asia

        13.3.6. Oceania

        13.3.7. Middle East and Africa

    13.4. Market Attractiveness Analysis by Region

14. North America Market Analysis 2017 to 2022 and Forecast 2023 to 2033

    14.1. Introduction

    14.2. Historical Market Size (US$ Million) Trend Analysis by Market Taxonomy, 2017 to 2022

    14.3. Current and Future Market Size (US$ Million) Analysis and Forecast by Market Taxonomy, 2023 to 2033

        14.3.1. By Country

            14.3.1.1. United States

            14.3.1.2. Canada

        14.3.2. By Product

        14.3.3. By Application

        14.3.4. By Usage

        14.3.5. By End User

    14.4. Market Attractiveness Analysis

        14.4.1. By Country

        14.4.2. By Product

        14.4.3. By Application

        14.4.4. By Usage

        14.4.5. By End User

    14.5. Market Trends

    14.6. Key Market Participants - Intensity Mapping

    14.7. Drivers and Restraints - Impact Analysis

    14.8. Country Level Analysis and Forecast

        14.8.1. United States Market

            14.8.1.1. Introduction

            14.8.1.2. Market Analysis and Forecast by Market Taxonomy

                14.8.1.2.1. By Product

                14.8.1.2.2. By Application

                14.8.1.2.3. By Usage

                14.8.1.2.4. By End User

        14.8.2. Canada Market

            14.8.2.1. Introduction

            14.8.2.2. Market Analysis and Forecast by Market Taxonomy

                14.8.2.2.1. By Product

                14.8.2.2.2. By Application

                14.8.2.2.3. By Usage

                14.8.2.2.4. By End User

15. Latin America Market Analysis 2017 to 2022 and Forecast 2023 to 2033

    15.1. Introduction

    15.2. Historical Market Size (US$ Million) Analysis by Market Taxonomy, 2017 to 2022

    15.3. Current and Future Market Size (US$ Million) Analysis and Forecast by Market Taxonomy, 2023 to 2033

        15.3.1. By Country

            15.3.1.1. Brazil

            15.3.1.2. Mexico

            15.3.1.3. Argentina

            15.3.1.4. Rest of Latin America

        15.3.2. By Product

        15.3.3. By Application

        15.3.4. By Usage

        15.3.5. By End User

    15.4. Market Attractiveness Analysis

        15.4.1. By Country

        15.4.2. By Product

        15.4.3. By Application

        15.4.4. By Usage

        15.4.5. By End User

    15.5. Market Trends

    15.6. Key Market Participants - Intensity Mapping

    15.7. Drivers and Restraints - Impact Analysis

    15.8. Country Level Analysis and Forecast

        15.8.1. Brazil Market Analysis

            15.8.1.1. Introduction

            15.8.1.2. Market Analysis and Forecast by Market Taxonomy

                15.8.1.2.1. By Product

                15.8.1.2.2. By Application

                15.8.1.2.3. By Usage

                15.8.1.2.4. By End User

        15.8.2. Mexico Market Analysis

            15.8.2.1. Introduction

            15.8.2.2. Market Analysis and Forecast by Market Taxonomy

                15.8.2.2.1. By Product

                15.8.2.2.2. By Application

                15.8.2.2.3. By Usage

                15.8.2.2.4. By End User

        15.8.3. Argentina Market Analysis

            15.8.3.1. Introduction

            15.8.3.2. Market Analysis and Forecast by Market Taxonomy

                15.8.3.2.1. By Product

                15.8.3.2.2. By Application

                15.8.3.2.3. By Usage

                15.8.3.2.4. By End User

16. Europe Market 2017 to 2022 and Forecast 2023 to 2033

    16.1. Introduction

    16.2. Historical Market Size (US$ Million) Analysis by Market Taxonomy, 2017 to 2022

    16.3. Current and Future Market Size (US$ Million) Analysis and Forecast by Market Taxonomy, 2023 to 2033

        16.3.1. By Country

            16.3.1.1. Germany

            16.3.1.2. France

            16.3.1.3. Spain

            16.3.1.4. Italy

            16.3.1.5. BENELUX

            16.3.1.6. United Kingdom

            16.3.1.7. Russia

            16.3.1.8. Rest of Europe

        16.3.2. By Product

        16.3.3. By Application

        16.3.4. By Usage

        16.3.5. By End User

    16.4. Market Attractiveness Analysis

        16.4.1. By Country

        16.4.2. By Product

        16.4.3. By Application

        16.4.4. By Usage

        16.4.5. By End User

    16.5. Market Trends

    16.6. Key Market Participants - Intensity Mapping

    16.7. Drivers and Restraints - Impact Analysis

    16.8. Country Level Analysis and Forecast

        16.8.1. Germany Market Analysis

            16.8.1.1. Introduction

            16.8.1.2. Market Analysis and Forecast by Market Taxonomy

                16.8.1.2.1. By Product

                16.8.1.2.2. By Application

                16.8.1.2.3. By Usage

                16.8.1.2.4. By End User

        16.8.2. France Market Analysis

            16.8.2.1. Introduction

            16.8.2.2. Market Analysis and Forecast by Market Taxonomy

                16.8.2.2.1. By Product

                16.8.2.2.2. By Application

                16.8.2.2.3. By Usage

                16.8.2.2.4. By End User

        16.8.3. Spain Market Analysis

            16.8.3.1. Introduction

            16.8.3.2. Market Analysis and Forecast by Market Taxonomy

                16.8.3.2.1. By Product

                16.8.3.2.2. By Application

                16.8.3.2.3. By Usage

                16.8.3.2.4. By End User

        16.8.4. Italy Market Analysis

            16.8.4.1. Introduction

            16.8.4.2. Market Analysis and Forecast by Market Taxonomy

                16.8.4.2.1. By Product

                16.8.4.2.2. By Application

                16.8.4.2.3. By Usage

                16.8.4.2.4. By End User

        16.8.5. BENELUX Market Analysis

            16.8.5.1. Introduction

            16.8.5.2. Market Analysis and Forecast by Market Taxonomy

                16.8.5.2.1. By Product

                16.8.5.2.2. By Application

                16.8.5.2.3. By Usage

                16.8.5.2.4. By End User

        16.8.6. United Kingdom Market Analysis

            16.8.6.1. Introduction

            16.8.6.2. Market Analysis and Forecast by Market Taxonomy

                16.8.6.2.1. By Product

                16.8.6.2.2. By Application

                16.8.6.2.3. By Usage

                16.8.6.2.4. By End User

        16.8.7. Russia Market Analysis

            16.8.7.1. Introduction

            16.8.7.2. Market Analysis and Forecast by Market Taxonomy

                16.8.7.2.1. By Product

                16.8.7.2.2. By Application

                16.8.7.2.3. By Usage

                16.8.7.2.4. By End User

17. East Asia Market Analysis 2017 to 2022 and Forecast 2023 to 2033

    17.1. Introduction

    17.2. Historical Market Size (US$ Million) Analysis by Market Taxonomy, 2017 to 2022

    17.3. Current and Future Market Size (US$ Million) Analysis and Forecast by Market Taxonomy, 2023 to 2033

        17.3.1. By Country

            17.3.1.1. China

            17.3.1.2. Japan

            17.3.1.3. South Korea

        17.3.2. By Product

        17.3.3. By Application

        17.3.4. By Usage

        17.3.5. By End User

    17.4. Market Attractiveness Analysis

        17.4.1. By Country

        17.4.2. By Product

        17.4.3. By Application

        17.4.4. By Usage

        17.4.5. By End User

    17.5. Market Trends

    17.6. Key Market Participants - Intensity Mapping

    17.7. Drivers and Restraints - Impact Analysis

    17.8. Country Level Analysis and Forecast

        17.8.1. China Market Analysis

            17.8.1.1. Introduction

            17.8.1.2. Market Analysis and Forecast by Market Taxonomy

                17.8.1.2.1. By Product

                17.8.1.2.2. By Application

                17.8.1.2.3. By Usage

                17.8.1.2.4. By End User

        17.8.2. Japan Market Analysis

            17.8.2.1. Introduction

            17.8.2.2. Market Analysis and Forecast by Market Taxonomy

                17.8.2.2.1. By Product

                17.8.2.2.2. By Application

                17.8.2.2.3. By Usage

                17.8.2.2.4. By End User

        17.8.3. South Korea Market Analysis

            17.8.3.1. Introduction

            17.8.3.2. Market Analysis and Forecast by Market Taxonomy

                17.8.3.2.1. By Product

                17.8.3.2.2. By Application

                17.8.3.2.3. By Usage

                17.8.3.2.4. By End User

18. South Asia Market Analysis 2017 to 2022 and Forecast 2023 to 2033

    18.1. Introduction

    18.2. Historical Market Size (US$ Million) Analysis by Market Taxonomy, 2017 to 2022

    18.3. Current and Future Market Size (US$ Million) Analysis and Forecast by Market Taxonomy, 2023 to 2033

        18.3.1. By Country

            18.3.1.1. India

            18.3.1.2. Indonesia

            18.3.1.3. Thailand

            18.3.1.4. Malaysia

            18.3.1.5. Rest of South Asia

        18.3.2. By Product

        18.3.3. By Application

        18.3.4. By Usage

        18.3.5. By End User

    18.4. Market Attractiveness Analysis

        18.4.1. By Country

        18.4.2. By Product

        18.4.3. By Application

        18.4.4. By Usage

        18.4.5. By End User

    18.5. Market Trends

    18.6. Key Market Participants - Intensity Mapping

    18.7. Drivers and Restraints - Impact Analysis

    18.8. Country Level Analysis and Forecast

        18.8.1. India Market Analysis

            18.8.1.1. Introduction

            18.8.1.2. Market Analysis and Forecast by Market Taxonomy

                18.8.1.2.1. By Product

                18.8.1.2.2. By Application

                18.8.1.2.3. By Usage

                18.8.1.2.4. By End User

        18.8.2. Indonesia Market Analysis

            18.8.2.1. Introduction

            18.8.2.2. Market Analysis and Forecast by Market Taxonomy

                18.8.2.2.1. By Product

                18.8.2.2.2. By Application

                18.8.2.2.3. By Usage

                18.8.2.2.4. By End User

        18.8.3. Thailand Market Analysis

            18.8.3.1. Introduction

            18.8.3.2. Market Analysis and Forecast by Market Taxonomy

                18.8.3.2.1. By Product

                18.8.3.2.2. By Application

                18.8.3.2.3. By Usage

                18.8.3.2.4. By End User

        18.8.4. Malaysia Market Analysis

            18.8.4.1. Introduction

            18.8.4.2. Market Analysis and Forecast by Market Taxonomy

                18.8.4.2.1. By Product

                18.8.4.2.2. By Application

                18.8.4.2.3. By Usage

                18.8.4.2.4. By End User

19. Oceania Market Analysis 2017 to 2022 and Forecast 2023 to 2033

    19.1. Introduction

    19.2. Historical Market Size (US$ Million) Analysis by Market Taxonomy, 2017 to 2022

    19.3. Current and Future Market Size (US$ Million) Analysis and Forecast by Market Taxonomy, 2023 to 2033

        19.3.1. By Country

            19.3.1.1. Australia

            19.3.1.2. New Zealand

        19.3.2. By Product

        19.3.3. By Application

        19.3.4. By Usage

        19.3.5. By End User

    19.4. Market Attractiveness Analysis

        19.4.1. By Country

        19.4.2. By Product

        19.4.3. By Application

        19.4.4. By Usage

        19.4.5. By End User

    19.5. Market Trends

    19.6. Key Market Participants - Intensity Mapping

    19.7. Drivers and Restraints - Impact Analysis

    19.8. Country Level Analysis and Forecast

        19.8.1. Australia Market Analysis

            19.8.1.1. Introduction

            19.8.1.2. Market Analysis and Forecast by Market Taxonomy

                19.8.1.2.1. By Product

                19.8.1.2.2. By Application

                19.8.1.2.3. By Usage

                19.8.1.2.4. By End User

        19.8.2. New Zealand Market Analysis

            19.8.2.1. Introduction

            19.8.2.2. Market Analysis and Forecast by Market Taxonomy

                19.8.2.2.1. By Product

                19.8.2.2.2. By Application

                19.8.2.2.3. By Usage

                19.8.2.2.4. By End User

20. Middle East and Africa Market Analysis 2017 to 2022 and Forecast 2023 to 2033

    20.1. Introduction

    20.2. Historical Market Size (US$ Million) Analysis by Market Taxonomy, 2017 to 2022

    20.3. Current and Future Market Size (US$ Million) Analysis and Forecast by Market Taxonomy, 2023 to 2033

        20.3.1. By Country

            20.3.1.1. GCC Countries

            20.3.1.2. Türkiye

            20.3.1.3. Northern Africa

            20.3.1.4. South Africa

            20.3.1.5. Rest Of Middle East and Africa

        20.3.2. By Product

        20.3.3. By Application

        20.3.4. By Usage

        20.3.5. By End User

    20.4. Market Attractiveness Analysis

        20.4.1. By Country

        20.4.2. By Product

        20.4.3. By Application

        20.4.4. By Usage

        20.4.5. By End User

    20.5. Market Trends

    20.6. Key Market Participants - Intensity Mapping

    20.7. Drivers and Restraints - Impact Analysis

    20.8. Country Level Analysis and Forecast

        20.8.1. GCC Countries Market Analysis

            20.8.1.1. Introduction

            20.8.1.2. Market Analysis and Forecast by Market Taxonomy

                20.8.1.2.1. By Product

                20.8.1.2.2. By Application

                20.8.1.2.3. By Usage

                20.8.1.2.4. By End User

        20.8.2. Türkiye Market Analysis

            20.8.2.1. Introduction

            20.8.2.2. Market Analysis and Forecast by Market Taxonomy

                20.8.2.2.1. By Product

                20.8.2.2.2. By Application

                20.8.2.2.3. By Usage

                20.8.2.2.4. By End User

        20.8.3. Northern Africa Market Analysis

            20.8.3.1. Introduction

            20.8.3.2. Market Analysis and Forecast by Market Taxonomy

                20.8.3.2.1. By Product

                20.8.3.2.2. By Application

                20.8.3.2.3. By Usage

                20.8.3.2.4. By End User

        20.8.4. South Africa Market Analysis

            20.8.4.1. Introduction

            20.8.4.2. Market Analysis and Forecast by Market Taxonomy

                20.8.4.2.1. By Product

                20.8.4.2.2. By Application

                20.8.4.2.3. By Usage

                20.8.4.2.4. By End User

21. Market Structure Analysis

    21.1. Market Analysis by Tier of Companies

    21.2. Market Share Analysis of Top Players

    21.3. Market Presence Analysis

        21.3.1. Regional footprint of Players

        21.3.2. Product footprint by Players

        21.3.3. Channel footprint by Players

22. Competition Analysis

    22.1. Competition Dashboard

    22.2. Competition Benchmarking

    22.3. Competition Deep Dive

        22.3.1. Medtronic

            22.3.1.1. Overview

            22.3.1.2. Technology Portfolio

            22.3.1.3. Key Financials

            22.3.1.4. Sales Footprint

            22.3.1.5. SWOT Analysis

            22.3.1.6. Key Developments

            22.3.1.7. Strategy Overview

                22.3.1.7.1. Channel Strategy

                22.3.1.7.2. Marketing Strategy

                22.3.1.7.3. Product Strategy

        22.3.2. Biowin Pharmaceutical

            22.3.2.1. Overview

            22.3.2.2. Technology Portfolio

            22.3.2.3. Key Financials

            22.3.2.4. Sales Footprint

            22.3.2.5. SWOT Analysis

            22.3.2.6. Key Developments

            22.3.2.7. Strategy Overview

                22.3.2.7.1. Channel Strategy

                22.3.2.7.2. Marketing Strategy

                22.3.2.7.3. Product Strategy

        22.3.3. Bluesail Surgical

            22.3.3.1. Overview

            22.3.3.2. Technology Portfolio

            22.3.3.3. Key Financials

            22.3.3.4. Sales Footprint

            22.3.3.5. SWOT Analysis

            22.3.3.6. Key Developments

            22.3.3.7. Strategy Overview

                22.3.3.7.1. Channel Strategy

                22.3.3.7.2. Marketing Strategy

                22.3.3.7.3. Product Strategy

        22.3.4. Changzhou Ankang Medical Instruments

            22.3.4.1. Overview

            22.3.4.2. Technology Portfolio

            22.3.4.3. Key Financials

            22.3.4.4. Sales Footprint

            22.3.4.5. SWOT Analysis

            22.3.4.6. Key Developments

            22.3.4.7. Strategy Overview

                22.3.4.7.1. Channel Strategy

                22.3.4.7.2. Marketing Strategy

                22.3.4.7.3. Product Strategy

        22.3.5. Golden Stapler Surgical

            22.3.5.1. Overview

            22.3.5.2. Technology Portfolio

            22.3.5.3. Key Financials

            22.3.5.4. Sales Footprint

            22.3.5.5. SWOT Analysis

            22.3.5.6. Key Developments

            22.3.5.7. Strategy Overview

                22.3.5.7.1. Channel Strategy

                22.3.5.7.2. Marketing Strategy

                22.3.5.7.3. Product Strategy

        22.3.6. Jiangsu Channel Medical Device

            22.3.6.1. Overview

            22.3.6.2. Technology Portfolio

            22.3.6.3. Key Financials

            22.3.6.4. Sales Footprint

            22.3.6.5. SWOT Analysis

            22.3.6.6. Key Developments

            22.3.6.7. Strategy Overview

                22.3.6.7.1. Channel Strategy

                22.3.6.7.2. Marketing Strategy

                22.3.6.7.3. Product Strategy

        22.3.7. Miconvey

            22.3.7.1. Overview

            22.3.7.2. Technology Portfolio

            22.3.7.3. Key Financials

            22.3.7.4. Sales Footprint

            22.3.7.5. SWOT Analysis

            22.3.7.6. Key Developments

            22.3.7.7. Strategy Overview

                22.3.7.7.1. Channel Strategy

                22.3.7.7.2. Marketing Strategy

                22.3.7.7.3. Product Strategy

        22.3.8. Ningbo David Medical Device

            22.3.8.1. Overview

            22.3.8.2. Technology Portfolio

            22.3.8.3. Key Financials

            22.3.8.4. Sales Footprint

            22.3.8.5. SWOT Analysis

            22.3.8.6. Key Developments

            22.3.8.7. Strategy Overview

                22.3.8.7.1. Channel Strategy

                22.3.8.7.2. Marketing Strategy

                22.3.8.7.3. Product Strategy

        22.3.9. Panther Healthcare

            22.3.9.1. Overview

            22.3.9.2. Technology Portfolio

            22.3.9.3. Key Financials

            22.3.9.4. Sales Footprint

            22.3.9.5. SWOT Analysis

            22.3.9.6. Key Developments

            22.3.9.7. Strategy Overview

                22.3.9.7.1. Channel Strategy

                22.3.9.7.2. Marketing Strategy

                22.3.9.7.3. Product Strategy

        22.3.10. Sinolinks Medical Innovation

            22.3.10.1. Overview

            22.3.10.2. Technology Portfolio

            22.3.10.3. Key Financials

            22.3.10.4. Sales Footprint

            22.3.10.5. SWOT Analysis

            22.3.10.6. Key Developments

            22.3.10.7. Strategy Overview

                22.3.10.7.1. Channel Strategy

                22.3.10.7.2. Marketing Strategy

                22.3.10.7.3. Product Strategy

        22.3.11. Waston medical

            22.3.11.1. Overview

            22.3.11.2. Technology Portfolio

            22.3.11.3. Key Financials

            22.3.11.4. Sales Footprint

            22.3.11.5. SWOT Analysis

            22.3.11.6. Key Developments

            22.3.11.7. Strategy Overview

                22.3.11.7.1. Channel Strategy

                22.3.11.7.2. Marketing Strategy

                22.3.11.7.3. Product Strategy

        22.3.12. Ethicon

            22.3.12.1. Overview

            22.3.12.2. Technology Portfolio

            22.3.12.3. Key Financials

            22.3.12.4. Sales Footprint

            22.3.12.5. SWOT Analysis

            22.3.12.6. Key Developments

            22.3.12.7. Strategy Overview

                22.3.12.7.1. Channel Strategy

                22.3.12.7.2. Marketing Strategy

                22.3.12.7.3. Product Strategy

        22.3.13. Surgnova

            22.3.13.1. Overview

            22.3.13.2. Technology Portfolio

            22.3.13.3. Key Financials

            22.3.13.4. Sales Footprint

            22.3.13.5. SWOT Analysis

            22.3.13.6. Key Developments

            22.3.13.7. Strategy Overview

                22.3.13.7.1. Channel Strategy

                22.3.13.7.2. Marketing Strategy

                22.3.13.7.3. Product Strategy

        22.3.14. Lepu Medical Technology(Beijing)Co.,Ltd

            22.3.14.1. Overview

            22.3.14.2. Technology Portfolio

            22.3.14.3. Key Financials

            22.3.14.4. Sales Footprint

            22.3.14.5. SWOT Analysis

            22.3.14.6. Key Developments

            22.3.14.7. Strategy Overview

                22.3.14.7.1. Channel Strategy

                22.3.14.7.2. Marketing Strategy

                22.3.14.7.3. Product Strategy

        22.3.15. Victor Medical Instruments Co., Ltd.

            22.3.15.1. Overview

            22.3.15.2. Technology Portfolio

            22.3.15.3. Key Financials

            22.3.15.4. Sales Footprint

            22.3.15.5. SWOT Analysis

            22.3.15.6. Key Developments

            22.3.15.7. Strategy Overview

                22.3.15.7.1. Channel Strategy

                22.3.15.7.2. Marketing Strategy

                22.3.15.7.3. Product Strategy

        22.3.16. CJ Medical

            22.3.16.1. Overview

            22.3.16.2. Technology Portfolio

            22.3.16.3. Key Financials

            22.3.16.4. Sales Footprint

            22.3.16.5. SWOT Analysis

            22.3.16.6. Key Developments

            22.3.16.7. Strategy Overview

                22.3.16.7.1. Channel Strategy

                22.3.16.7.2. Marketing Strategy

                22.3.16.7.3. Product Strategy

23. Assumptions and Acronyms Used

24. Research Methodology

List of Tables

Table 1: Global Market Value (US$ Million) Analysis and Forecast 2017 to 2033, By Product

Table 2: Global Market Volume (Units) Analysis and Forecast 2017 to 2033, By Product

Table 3: Global Market Value (US$ Million) Analysis and Forecast 2017 to 2033, by Application

Table 4: Global Market Value (US$ Million) Analysis and Forecast 2017 to 2033, by Usage

Table 5: Global Market Value (US$ Million) Analysis and Forecast 2017 to 2033, by End User

Table 6: Global Market Value (US$ Million) Analysis and Forecast 2017 to 2033, by Region

Table 7: North America Market Value (US$ Million) Analysis 2017 to 2022 and Forecast 2023 to 2033, by Country

Table 8: North America Market Value (US$ Million) Analysis and Forecast 2017 to 2033, By Product

Table 9: North America Market Volume (Units) Analysis and Forecast 2017 to 2033, By Product

Table 10: North America Market Value (US$ Million) Analysis and Forecast 2017 to 2033, by Application

Table 11: North America Market Value (US$ Million) Analysis and Forecast 2017 to 2033, by Usage

Table 12: North America Market Value (US$ Million) Analysis and Forecast 2017 to 2033, by End User

Table 13: Latin America Market Value (US$ Million) Analysis 2017 to 2022 and Forecast 2023 to 2033, by Country

Table 14: Latin America Market Value (US$ Million) Analysis and Forecast 2017 to 2033, By Product

Table 15: Latin America Market Volume (Units) Analysis and Forecast 2017 to 2033, By Product

Table 16: Latin America Market Value (US$ Million) Analysis and Forecast 2017 to 2033, by Application

Table 17: Latin America Market Value (US$ Million) Analysis and Forecast 2017 to 2033, by Usage

Table 18: Latin America Market Value (US$ Million) Analysis and Forecast 2017 to 2033, by End User

Table 19: Europe Market Value (US$ Million) Analysis 2017 to 2022 and Forecast 2023 to 2033, by Country

Table 20: Europe Market Value (US$ Million) Analysis and Forecast 2017 to 2033, By Product

Table 21: Europe Market Volume (Units) Analysis and Forecast 2017 to 2033, By Product

Table 22: Europe Market Value (US$ Million) Analysis and Forecast 2017 to 2033, by Application

Table 23: Europe Market Value (US$ Million) Analysis and Forecast 2017 to 2033, by Usage

Table 24: Europe Market Value (US$ Million) Analysis and Forecast 2017 to 2033, by End User

Table 25: South Asia Market Value (US$ Million) Analysis 2017 to 2022 and Forecast 2023 to 2033, by Country

Table 26: South Asia Market Value (US$ Million) Analysis and Forecast 2017 to 2033, By Product

Table 27: South Asia Market Volume (Units) Analysis and Forecast 2017 to 2033, By Product

Table 28: South Asia Market Value (US$ Million) Analysis and Forecast 2017 to 2033, by Application

Table 29: South Asia Market Value (US$ Million) Analysis and Forecast 2017 to 2033, by Usage

Table 30: South Asia Market Value (US$ Million) Analysis and Forecast 2017 to 2033, by End User

Table 31: East Asia Market Value (US$ Million) Analysis 2017 to 2022 and Forecast 2023 to 2033, by Country

Table 32: East Asia Market Value (US$ Million) Analysis and Forecast 2017 to 2033, By Product

Table 33: East Asia Market Volume (Units) Analysis and Forecast 2017 to 2033, By Product

Table 34: East Asia Market Value (US$ Million) Analysis and Forecast 2017 to 2033, by Application

Table 35: East Asia Market Value (US$ Million) Analysis and Forecast 2017 to 2033, by Usage

Table 36: East Asia Market Value (US$ Million) Analysis and Forecast 2017 to 2033, by End User

Table 37: Oceania Market Value (US$ Million) Analysis 2017 to 2022 and Forecast 2023 to 2033, by Country

Table 38: Oceania Market Value (US$ Million) Analysis and Forecast 2017 to 2033, By Product

Table 39: Oceania Market Volume (Units) Analysis and Forecast 2017 to 2033, By Product

Table 40: Oceania Market Value (US$ Million) Analysis and Forecast 2017 to 2033, by Application

Table 41: Oceania Market Value (US$ Million) Analysis and Forecast 2017 to 2033, by Usage

Table 42: Oceania Market Value (US$ Million) Analysis and Forecast 2017 to 2033, by End User

Table 43: Middle East and Africa Market Value (US$ Million) Analysis 2017 to 2022 and Forecast 2023 to 2033,

Table 44: Middle East and Africa Market Value (US$ Million) Analysis and Forecast 2017 to 2033, By Product

Table 45: Middle East and Africa Market Volume (Units) Analysis and Forecast 2017 to 2033, By Product

Table 46: Middle East and Africa Market Value (US$ Million) Analysis and Forecast 2017 to 2033, by Application

Table 47: Middle East and Africa Market Value (US$ Million) Analysis and Forecast 2017 to 2033, by Usage

Table 48: Middle East and Africa Market Value (US$ Million) Analysis and Forecast 2017 to 2033, by End User

List of Charts

Figure 1A: Global Market Volume (Units), 2017 to 2022

Figure 1B: Global Market Volume (Units) and Y-o-Y Growth (%) Analysis, 2023 to 2033

Figure 2A: Powered Surgical Staplers, Pricing Analysis per unit (US$), in 2022

Figure 2B: Powered Surgical Staplers, Pricing Forecast per unit (US$), in 2033

Figure 3A: Global Market Value (US$ Million) Analysis, 2017 to 2022

Figure 3B: Global Market Forecast and Y-o-Y Growth, 2023 to 2033

Figure 3C: Global Market Absolute $ Opportunity (US$ Million) Analysis, 2022 to 2033

Figure 4: Global Market Value Share (%) Analysis 2023 and 2033, By Product

Figure 5: Global Market Y-o-Y Growth (%) Analysis 2022 to 2033, By Product

Figure 6: Global Market Attractiveness Analysis 2023 to 2033, By Product

Figure 7: Global Market Value Share (%) Analysis 2023 and 2033, by Application

Figure 8: Global Market Y-o-Y Growth (%) Analysis 2022 to 2033, by Application

Figure 9: Global Market Attractiveness Analysis 2023 to 2033, by Application

Figure 10: Global Market Value Share (%) Analysis 2023 and 2033, by Usage

Figure 11: Global Market Y-o-Y Growth (%) Analysis 2022 to 2033, by Usage

Figure 12: Global Market Attractiveness Analysis 2023 to 2033, by Usage

Figure 13: Global Market Value Share (%) Analysis 2023 and 2033, by End User

Figure 14: Global Market Y-o-Y Growth (%) Analysis 2022 to 2033, by End User

Figure 15: Global Market Attractiveness Analysis 2023 to 2033, by End User

Figure 16: Global Market Value Share (%) Analysis 2023 and 2033, by Region

Figure 17: Global Market Y-o-Y Growth (%) Analysis 2022 to 2033, by Region

Figure 18: Global Market Attractiveness Analysis 2023 to 2033, by Region

Figure 19: North America Market Value (US$ Million) Analysis, 2017 to 2022

Figure 20: North America Market Value (US$ Million) Forecast, 2023 to 2033

Figure 21: North America Market Value Share, By Product (2023 E)

Figure 22: North America Market Value Share, by Application (2023 E)

Figure 23: North America Market Value Share, by Usage (2023 E)

Figure 24: North America Market Value Share, by End User (2023 E)

Figure 25: North America Market Value Share, by Country (2023 E)

Figure 26: North America Market Attractiveness Analysis By Product, 2023 to 2033

Figure 27: North America Market Attractiveness Analysis by Application, 2023 to 2033

Figure 28: North America Market Attractiveness Analysis by Usage, 2023 to 2033

Figure 29: North America Market Attractiveness Analysis by End User, 2023 to 2033

Figure 30: North America Market Attractiveness Analysis by Country, 2023 to 2033

Figure 31: United States Market Value Proportion Analysis, 2022

Figure 32: Global Vs. United States Growth Comparison, 2022 to 2033

Figure 33: United States Market Share Analysis (%) By Product, 2022 and 2033

Figure 34: United States Market Share Analysis (%) by Application, 2022 and 2033

Figure 35: United States Market Share Analysis (%) by Usage, 2022 and 2033

Figure 36: United States Market Share Analysis (%) by End User, 2022 and 2033

Figure 37: Canada Market Value Proportion Analysis, 2022

Figure 38: Global Vs. Canada. Growth Comparison, 2022 to 2033

Figure 39: Canada Market Share Analysis (%) By Product, 2022 and 2033

Figure 40: Canada Market Share Analysis (%) by Application, 2022 and 2033

Figure 41: Canada Market Share Analysis (%) by Usage, 2022 and 2033

Figure 42: Canada Market Share Analysis (%) by End User, 2022 and 2033

Figure 43: Latin America Market Value (US$ Million) Analysis, 2017 to 2022

Figure 44: Latin America Market Value (US$ Million) Forecast, 2023 to 2033

Figure 45: Latin America Market Value Share, By Product (2023 E)

Figure 46: Latin America Market Value Share, by Application (2023 E)

Figure 47: Latin America Market Value Share, by Usage (2023 E)

Figure 48: Latin America Market Value Share, by End User (2023 E)

Figure 49: Latin America Market Value Share, by Country (2023 E)

Figure 50: Latin America Market Attractiveness Analysis By Product, 2023 to 2033

Figure 51: Latin America Market Attractiveness Analysis by Application, 2023 to 2033

Figure 52: Latin America Market Attractiveness Analysis by Usage, 2023 to 2033

Figure 53: Latin America Market Attractiveness Analysis by End User, 2023 to 2033

Figure 54: Latin America Market Attractiveness Analysis by Country, 2023 to 2033

Figure 55: Mexico Market Value Proportion Analysis, 2022

Figure 56: Global Vs Mexico Growth Comparison, 2022 to 2033

Figure 57: Mexico Market Share Analysis (%) By Product, 2022 and 2033

Figure 58: Mexico Market Share Analysis (%) by Application, 2022 and 2033

Figure 59: Mexico Market Share Analysis (%) by Usage, 2022 and 2033

Figure 60: Mexico Market Share Analysis (%) by End User, 2022 and 2033

Figure 61: Brazil Market Value Proportion Analysis, 2022

Figure 62: Global Vs. Brazil. Growth Comparison, 2022 to 2033

Figure 63: Brazil Market Share Analysis (%) By Product, 2022 and 2033

Figure 64: Brazil Market Share Analysis (%) by Application, 2022 and 2033

Figure 65: Brazil Market Share Analysis (%) by Usage, 2022 and 2033

Figure 66: Brazil Market Share Analysis (%) by End User, 2022 and 2033

Figure 67: Argentina Market Value Proportion Analysis, 2022

Figure 68: Global Vs Argentina Growth Comparison, 2022 to 2033

Figure 69: Argentina Market Share Analysis (%) By Product, 2022 and 2033

Figure 70: Argentina Market Share Analysis (%) by Application, 2022 and 2033

Figure 71: Argentina Market Share Analysis (%) by Usage, 2022 and 2033

Figure 72: Argentina Market Share Analysis (%) by End User, 2022 and 2033

Figure 73: Europe Market Value (US$ Million) Analysis, 2017 to 2022

Figure 74: Europe Market Value (US$ Million) Forecast, 2023 to 2033

Figure 75: Europe Market Value Share, By Product (2023 E)

Figure 76: Europe Market Value Share, by Application (2023 E)

Figure 77: Europe Market Value Share, by Usage (2023 E)

Figure 78: Europe Market Value Share, by End User (2023 E)

Figure 79: Europe Market Value Share, by Country (2023 E)

Figure 80: Europe Market Attractiveness Analysis By Product, 2023 to 2033

Figure 81: Europe Market Attractiveness Analysis by Application, 2023 to 2033

Figure 82: Europe Market Attractiveness Analysis by Usage, 2023 to 2033

Figure 83: Europe Market Attractiveness Analysis by End User, 2023 to 2033

Figure 84: Europe Market Attractiveness Analysis by Country, 2023 to 2033

Figure 85: United Kingdom Market Value Proportion Analysis, 2022

Figure 86: Global Vs. United Kingdom Growth Comparison, 2022 to 2033

Figure 87: United Kingdom Market Share Analysis (%) By Product, 2022 and 2033

Figure 88: United Kingdom Market Share Analysis (%) by Application, 2022 and 2033

Figure 89: United Kingdom Market Share Analysis (%) by Usage, 2022 and 2033

Figure 90: United Kingdom Market Share Analysis (%) by End User, 2022 and 2033

Figure 91: Germany Market Value Proportion Analysis, 2022

Figure 92: Global Vs. Germany Growth Comparison, 2022 to 2033

Figure 93: Germany Market Share Analysis (%) By Product, 2022 and 2033

Figure 94: Germany Market Share Analysis (%) by Application, 2022 and 2033

Figure 95: Germany Market Share Analysis (%) by Usage, 2022 and 2033

Figure 96: Germany Market Share Analysis (%) by End User, 2022 and 2033

Figure 97: Italy Market Value Proportion Analysis, 2022

Figure 98: Global Vs. Italy Growth Comparison, 2022 to 2033

Figure 99: Italy Market Share Analysis (%) By Product, 2022 and 2033

Figure 100: Italy Market Share Analysis (%) by Application, 2022 and 2033

Figure 101: Italy Market Share Analysis (%) by Usage, 2022 and 2033

Figure 102: Italy Market Share Analysis (%) by End User, 2022 and 2033

Figure 103: France Market Value Proportion Analysis, 2022

Figure 104: Global Vs France Growth Comparison, 2022 to 2033

Figure 105: France Market Share Analysis (%) By Product, 2022 and 2033

Figure 106: France Market Share Analysis (%) by Application, 2022 and 2033

Figure 107: France Market Share Analysis (%) by Usage, 2022 and 2033

Figure 108: France Market Share Analysis (%) by End User, 2022 and 2033

Figure 109: Spain Market Value Proportion Analysis, 2022

Figure 110: Global Vs Spain Growth Comparison, 2022 to 2033

Figure 111: Spain Market Share Analysis (%) By Product, 2022 and 2033

Figure 112: Spain Market Share Analysis (%) by Application, 2022 and 2033

Figure 113: Spain Market Share Analysis (%) by Usage, 2022 and 2033

Figure 114: Spain Market Share Analysis (%) by End User, 2022 and 2033

Figure 115: Russia Market Value Proportion Analysis, 2022

Figure 116: Global Vs Russia Growth Comparison, 2022 to 2033

Figure 117: Russia Market Share Analysis (%) By Product, 2022 and 2033

Figure 118: Russia Market Share Analysis (%) by Application, 2022 and 2033

Figure 119: Russia Market Share Analysis (%) by Usage, 2022 and 2033

Figure 120: Russia Market Share Analysis (%) by End User, 2022 and 2033

Figure 121: BENELUX Market Value Proportion Analysis, 2022

Figure 122: Global Vs BENELUX Growth Comparison, 2022 to 2033

Figure 123: BENELUX Market Share Analysis (%) By Product, 2022 and 2033

Figure 124: BENELUX Market Share Analysis (%) by Application, 2022 and 2033

Figure 125: BENELUX Market Share Analysis (%) by Usage, 2022 and 2033

Figure 126: BENELUX Market Share Analysis (%) by End User, 2022 and 2033

Figure 127: East Asia Market Value (US$ Million) Analysis, 2017 to 2022

Figure 128: East Asia Market Value (US$ Million) Forecast, 2023 to 2033

Figure 129: East Asia Market Value Share, By Product (2023 E)

Figure 130: East Asia Market Value Share, by Application (2023 E)

Figure 131: East Asia Market Value Share, by Usage (2023 E)

Figure 132: East Asia Market Value Share, by End User (2023 E)

Figure 133: East Asia Market Value Share, by Country (2023 E)

Figure 134: East Asia Market Attractiveness Analysis By Product, 2023 to 2033

Figure 135: East Asia Market Attractiveness Analysis by Application, 2023 to 2033

Figure 136: East Asia Market Attractiveness Analysis by Usage, 2023 to 2033

Figure 137: East Asia Market Attractiveness Analysis by End User, 2023 to 2033

Figure 138: East Asia Market Attractiveness Analysis by Country, 2023 to 2033

Figure 139: China Market Value Proportion Analysis, 2022

Figure 140: Global Vs. China Growth Comparison, 2022 to 2033

Figure 141: China Market Share Analysis (%) By Product, 2022 and 2033

Figure 142: China Market Share Analysis (%) by Application, 2022 and 2033

Figure 143: China Market Share Analysis (%) by Usage, 2022 and 2033

Figure 144: China Market Share Analysis (%) by End User, 2022 and 2033

Figure 145: Japan Market Value Proportion Analysis, 2022

Figure 146: Global Vs. Japan Growth Comparison, 2022 to 2033

Figure 147: Japan Market Share Analysis (%) By Product, 2022 and 2033

Figure 148: Japan Market Share Analysis (%) by Application, 2022 and 2033

Figure 149: Japan Market Share Analysis (%) by Usage, 2022 and 2033

Figure 150: Japan Market Share Analysis (%) by End User, 2022 and 2033

Figure 151: South Korea Market Value Proportion Analysis, 2022

Figure 152: Global Vs South Korea Growth Comparison, 2022 to 2033

Figure 153: South Korea Market Share Analysis (%) By Product, 2022 and 2033

Figure 154: South Korea Market Share Analysis (%) by Application, 2022 and 2033

Figure 155: South Korea Market Share Analysis (%) by Usage, 2022 and 2033

Figure 156: South Korea Market Share Analysis (%) by End User, 2022 and 2033

Figure 157: South Asia Market Value (US$ Million) Analysis, 2017 to 2022

Figure 158: South Asia Market Value (US$ Million) Forecast, 2023 to 2033

Figure 159: South Asia Market Value Share, By Product (2023 E)

Figure 160: South Asia Market Value Share, by Application (2023 E)

Figure 161: South Asia Market Value Share, by Usage (2023 E)

Figure 162: South Asia Market Value Share, by End User (2023 E)

Figure 163: South Asia Market Value Share, by Country (2023 E)

Figure 164: South Asia Market Attractiveness Analysis By Product, 2023 to 2033

Figure 165: South Asia Market Attractiveness Analysis by Application, 2023 to 2033

Figure 166: South Asia Market Attractiveness Analysis by Usage, 2023 to 2033

Figure 167: South Asia Market Attractiveness Analysis by End User, 2023 to 2033

Figure 168: South Asia Market Attractiveness Analysis by Country, 2023 to 2033

Figure 169: India Market Value Proportion Analysis, 2022

Figure 170: Global Vs. India Growth Comparison, 2022 to 2033

Figure 171: India Market Share Analysis (%) By Product, 2022 and 2033

Figure 172: India Market Share Analysis (%) by Application, 2022 and 2033

Figure 173: India Market Share Analysis (%) by Usage, 2022 and 2033

Figure 174: India Market Share Analysis (%) by End User, 2022 and 2033

Figure 175: Indonesia Market Value Proportion Analysis, 2022

Figure 176: Global Vs. Indonesia Growth Comparison, 2022 to 2033

Figure 177: Indonesia Market Share Analysis (%) By Product, 2022 and 2033

Figure 178: Indonesia Market Share Analysis (%) by Application, 2022 and 2033

Figure 179: Indonesia Market Share Analysis (%) by Usage, 2022 and 2033

Figure 180: Indonesia Market Share Analysis (%) by End User, 2022 and 2033

Figure 181: Malaysia Market Value Proportion Analysis, 2022

Figure 182: Global Vs. Malaysia Growth Comparison, 2022 to 2033

Figure 183: Malaysia Market Share Analysis (%) By Product, 2022 and 2033

Figure 184: Malaysia Market Share Analysis (%) by Application, 2022 and 2033

Figure 185: Malaysia Market Share Analysis (%) by Usage, 2022 and 2033

Figure 186: Malaysia Market Share Analysis (%) by End User, 2022 and 2033

Figure 187: Thailand Market Value Proportion Analysis, 2022

Figure 188: Global Vs. Thailand Growth Comparison, 2022 to 2033

Figure 189: Thailand Market Share Analysis (%) By Product, 2022 and 2033

Figure 190: Thailand Market Share Analysis (%) by Application, 2022 and 2033

Figure 191: Thailand Market Share Analysis (%) by Usage, 2022 and 2033

Figure 192: Thailand Market Share Analysis (%) by End User, 2022 and 2033

Figure 193: Oceania Market Value (US$ Million) Analysis, 2017 to 2022

Figure 194: Oceania Market Value (US$ Million) Forecast, 2023 to 2033

Figure 195: Oceania Market Value Share, By Product (2023 E)

Figure 196: Oceania Market Value Share, by Application (2023 E)

Figure 197: Oceania Market Value Share, by Usage (2023 E)

Figure 198: Oceania Market Value Share, by End User (2023 E)

Figure 199: Oceania Market Value Share, by Country (2023 E)

Figure 200: Oceania Market Attractiveness Analysis By Product, 2023 to 2033

Figure 201: Oceania Market Attractiveness Analysis by Application, 2023 to 2033

Figure 202: Oceania Market Attractiveness Analysis by Usage, 2023 to 2033

Figure 203: Oceania Market Attractiveness Analysis by End User, 2023 to 2033

Figure 204: Oceania Market Attractiveness Analysis by Country, 2023 to 2033

Figure 205: Australia Market Value Proportion Analysis, 2022

Figure 206: Global Vs. Australia Growth Comparison, 2022 to 2033

Figure 207: Australia Market Share Analysis (%) By Product, 2022 and 2033

Figure 208: Australia Market Share Analysis (%) by Application, 2022 and 2033

Figure 209: Australia Market Share Analysis (%) by Usage, 2022 and 2033

Figure 210: Australia Market Share Analysis (%) by End User, 2022 and 2033

Figure 211: New Zealand Market Value Proportion Analysis, 2022

Figure 212: Global Vs New Zealand Growth Comparison, 2022 to 2033

Figure 213: New Zealand Market Share Analysis (%) By Product, 2022 and 2033

Figure 214: New Zealand Market Share Analysis (%) by Application, 2022 and 2033

Figure 215: New Zealand Market Share Analysis (%) by Usage, 2022 and 2033

Figure 216: New Zealand Market Share Analysis (%) by End User, 2022 and 2033

Figure 217: Middle East and Africa Market Value (US$ Million) Analysis, 2017 to 2022

Figure 218: Middle East and Africa Market Value (US$ Million) Forecast, 2023 to 2033

Figure 219: Middle East and Africa Market Value Share, By Product (2023 E)

Figure 220: Middle East and Africa Market Value Share, by Application (2023 E)

Figure 221: Middle East and Africa Market Value Share, by Usage (2023 E)

Figure 222: Middle East and Africa Market Value Share, by End User (2023 E)

Figure 223: Middle East and Africa Market Value Share, by Country (2023 E)

Figure 224: Middle East and Africa Market Attractiveness Analysis By Product, 2023 to 2033

Figure 225: Middle East and Africa Market Attractiveness Analysis by Application, 2023 to 2033

Figure 226: Middle East and Africa Market Attractiveness Analysis by Usage, 2023 to 2033

Figure 227: Middle East and Africa Market Attractiveness Analysis by End User, 2023 to 2033

Figure 228: Middle East and Africa Market Attractiveness Analysis by Country, 2023 to 2033

Figure 229: GCC Countries Market Value Proportion Analysis, 2022

Figure 230: Global Vs GCC Countries Growth Comparison, 2022 to 2033

Figure 231: GCC Countries Market Share Analysis (%) By Product, 2022 and 2033

Figure 232: GCC Countries Market Share Analysis (%) by Application, 2022 and 2033

Figure 233: GCC Countries Market Share Analysis (%) by Usage, 2022 and 2033

Figure 234: GCC Countries Market Share Analysis (%) by End User, 2022 and 2033

Figure 235: Türkiye Market Value Proportion Analysis, 2022

Figure 236: Global Vs. Türkiye Growth Comparison, 2022 to 2033

Figure 237: Türkiye Market Share Analysis (%) By Product, 2022 and 2033

Figure 238: Türkiye Market Share Analysis (%) by Application, 2022 and 2033

Figure 239: Türkiye Market Share Analysis (%) by Usage, 2022 and 2033

Figure 240: Türkiye Market Share Analysis (%) by End User, 2022 and 2033

Figure 241: South Africa Market Value Proportion Analysis, 2022

Figure 242: Global Vs. South Africa Growth Comparison, 2022 to 2033

Figure 243: South Africa Market Share Analysis (%) By Product, 2022 and 2033

Figure 244: South Africa Market Share Analysis (%) by Application, 2022 and 2033

Figure 245: South Africa Market Share Analysis (%) by Usage, 2022 and 2033

Figure 246: South Africa Market Share Analysis (%) by End User, 2022 and 2033

Figure 247: Northern Africa Market Value Proportion Analysis, 2022

Figure 248: Global Vs Northern Africa Growth Comparison, 2022 to 2033

Figure 249: Northern Africa Market Share Analysis (%) By Product, 2022 and 2033

Figure 250: Northern Africa Market Share Analysis (%) by Application, 2022 and 2033

Figure 251: Northern Africa Market Share Analysis (%) by Usage, 2022 and 2033

Figure 252: Northern Africa Market Share Analysis (%) by End User, 2022 and 2033

Recommendations

Healthcare

Surgical Suture Market

Published : April 2024

Healthcare

Surgical Stapling Device Market

Published : October 2023

Healthcare

Suture Needles Market

Published : May 2022

Explore Healthcare Insights

View Reports

Powered Surgical Staplers Market