The Surgical Scissors Market is estimated to be valued at USD 400.2 million in 2025 and is projected to reach USD 532.6 million by 2035, registering a compound annual growth rate (CAGR) of 2.9% over the forecast period.
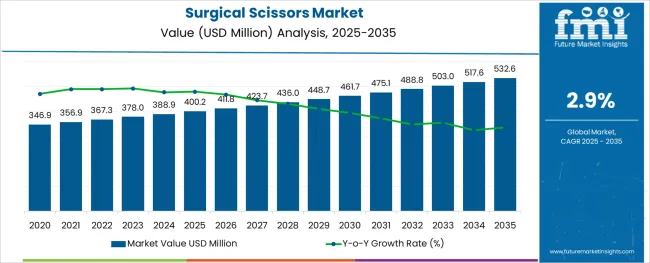
The surgical scissors market is experiencing consistent growth as global healthcare systems scale up procedural volumes and focus on precision surgical instruments. Growing emphasis on procedural safety, repeatability, and ergonomics is driving demand for instruments that ensure cutting accuracy with minimal tissue trauma. Surgical centers and hospitals are investing in high-performance scissors designed to withstand repeated sterilization while maintaining blade sharpness and mechanical integrity.
Technological advancements in metallurgy, coating materials, and joint engineering have allowed for extended instrument life cycles, aligning with cost containment goals and regulatory standards. With increasing surgical throughput across elective, trauma, and minimally invasive procedures, hospitals and specialty centers are optimizing procurement by prioritizing reusability, performance, and surgeon preference.
Emerging markets are also contributing to the sector’s growth as healthcare infrastructure expands and the adoption of standardized surgical kits becomes more prevalent. These trends are reinforcing the market's upward trajectory, especially in institutional and operating room environments where tool reliability is non-negotiable.
The market is segmented by Material Type, Product Type, and End User and region. By Material Type, the market is divided into Steel, Ceramic, Tungsten, Titanium, and Others. In terms of Product Type, the market is classified into Reusable surgical scissors and Disposable surgical scissors. Based on End User, the market is segmented into Hospitals, Ambulatory surgical centres, Clinics, Home care settings, and Others.
Regionally, the market is classified into North America, Latin America, Western Europe, Eastern Europe, Balkan & Baltic Countries, Russia & Belarus, Central Asia, East Asia, South Asia & Pacific, and the Middle East & Africa.
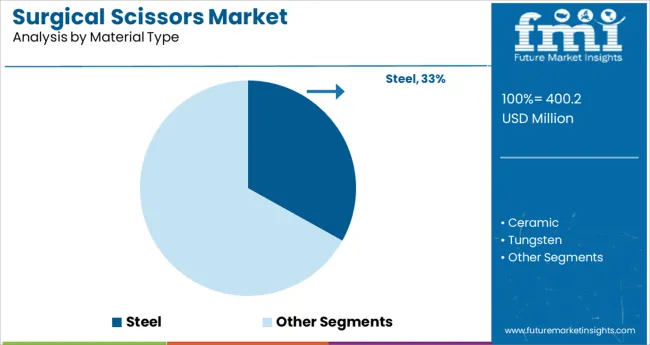
Steel is projected to account for 33.1% of total market revenue by 2025 under the material type category, positioning it as the most widely adopted material. This dominance is due to steel’s proven durability, resistance to corrosion, and suitability for repeated sterilization in high-pressure autoclave settings.
Surgical scissors made from stainless or high-carbon steel offer superior edge retention and tensile strength, making them reliable for a wide range of procedures. The material’s compatibility with both manual and automated sharpening processes supports instrument longevity, which is a critical purchasing factor for hospitals.
Furthermore, steel’s high strength-to-weight ratio ensures cutting precision while maintaining surgeon comfort during prolonged use. Cost-effectiveness and global availability have also supported its continued leadership in surgical instrument manufacturing, especially within public and private hospital procurement frameworks.
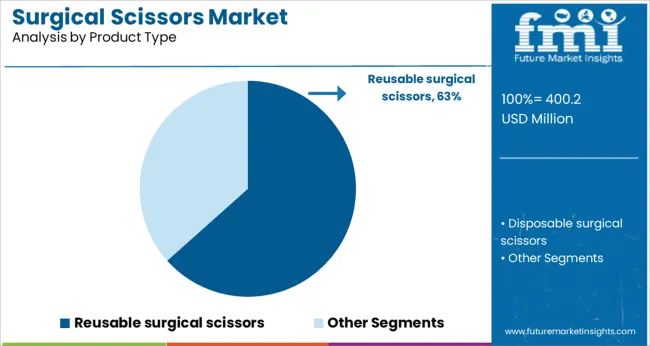
Reusable surgical scissors are expected to represent 63.4% of market revenue by 2025 in the product type category, making them the leading product type. Their market share is being driven by cost efficiency, sustainability, and institutional procurement practices that favor reusability over disposability.
These scissors are engineered for long-term performance, with features such as precision-aligned blades, ergonomic handles, and joint systems that can endure repeated sterilization cycles without degradation. Healthcare facilities prefer reusable models as they align with central sterile services department (CSSD) protocols and reduce recurring procurement costs.
Additionally, advances in maintenance tools and sharpening techniques have enabled extended life cycles for reusable instruments, further improving their return on investment. As healthcare systems focus on reducing medical waste and complying with green operating room standards, the demand for reusable surgical scissors is expected to remain strong.
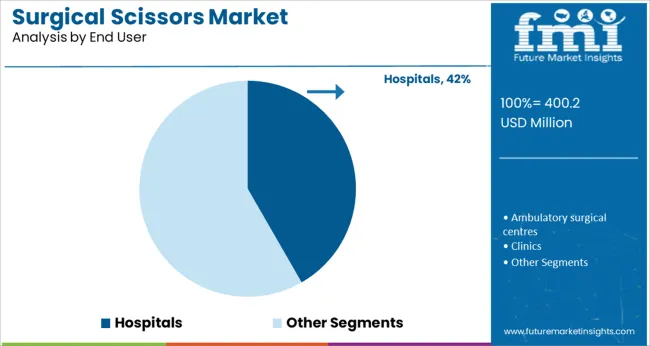
Hospitals are forecast to hold 41.7% of market revenue by 2025 in the end user category, securing their position as the largest consumer of surgical scissors. This dominance is attributed to the high volume of surgical interventions performed in hospital settings across specialties such as general surgery, orthopedics, cardiovascular, and obstetrics.
Hospitals operate under structured procurement systems that prioritize instrument reliability, sterilization compatibility, and standardization across departments. Bulk purchasing agreements and centralized instrument reprocessing capabilities further support the preference for high-quality, reusable surgical scissors.
Moreover, the rising number of inpatient and outpatient surgical procedures globally has led to increased demand for consistently performing surgical tools. The hospital segment continues to drive innovation and volume-based growth in the surgical scissors market as healthcare delivery models evolve to handle complex and high-throughput surgical care.
The key trends driving the global surgical scissors market:
Rise in Surgical Procedures
Several of the main factors influencing the market is the increased number of people having surgical operations. The incidence of chronic conditions including obesity, cancer, arthritis, and cardiovascular diseases (CVDs) is also on the rise. In addition, a sharp increase in the number of deadly road accidents and hospitalizations is fuelling the global demand for surgical scissors.
Rise in demand for minimally invasive surgical procedures
The usage of durable and efficient surgical scissors is expanding across the world as minimally invasive surgical (MIS) techniques and sophisticated surgical methods both gain popularity.
Development of Advanced surgical devices
Current market participants are creating surgical scissors with strong, adaptable materials to improve their usefulness. These players are also concentrating on creating new scissors with eye rings utilising computer-aided modelling. These product advancements are expected to encourage market expansion.
Wide availability of cost effective surgical tools
Moreover, the demand for cost effective and robust surgical instruments, increase in geriatric population undergoing various surgical procedures are some other factors expected to flourish the global demand for surgical scissors as well.
Fear of contamination
However, chances of developing infection due to use of contaminated reusable scissor is expected to hamper the market growth to certain degrees.
Reusable surgical scissors are the most widely used surgical scissors across the globe, owing to the associated benefits of being sterilized and reused. Reusable scissors are less expensive compared to disposable scissors, and it also reduces the chances of infection during surgical procedures.
Due to the convenience of surgical facilities and the growing number of hospitals throughout the world, the hospital sector accounts for the largest proportion of the demand for surgical scissors, according to end-user verticals.
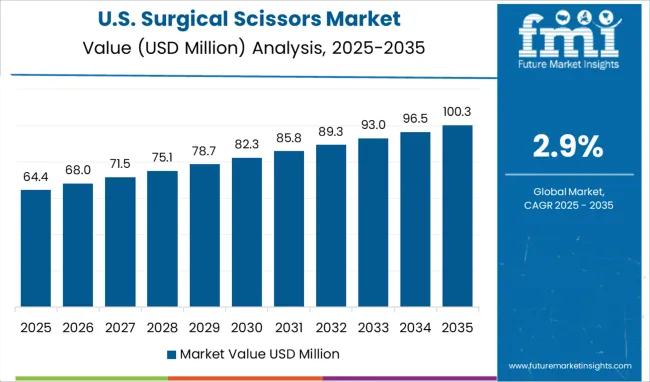
As per the surgical scissors market analysis report published by FMI, the North America region holds the highest share of nearly 33.6% of the global market.
North America is expected to continue to lead the global market due to the high density of medical centres or healthcare infrastructure. Similarly, Western Europe is expected to be the second largest market for surgical scissors.
Due to rising product demand at healthcare infrastructure facilities in states like California, Florida, and others, the USA is anticipated to remain an important revenue-generating potential for well-known market participants in the upcoming years.
According to the new research report, the Asia Pacific region holds 29.7% of the overall market, making it very promising for the future times.
A large patient pool in the Asia Pacific is expected to boost the sales of surgical scissors in hospitals over the forecast period. The rising number of surgical operations and favourable government regulations in nations like the China and India are anticipated to make this region the fastest growing market for sales of surgical scissors.
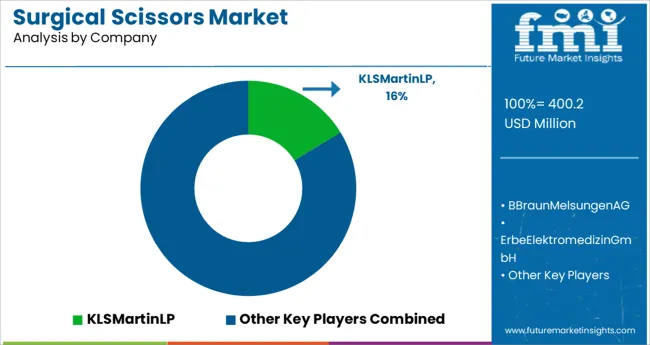
There are several well-known competitors in the highly competitive market for surgical scissors. As they have consistently produced outcomes throughout time, several of these players have developed competitiveness and are anticipated to have a significant share in the future as well.
For newly established market companies looking to expand their income streams and acquire a competitive advantage over rivals, new product releases may be a crucial component of their growth plan. To boost their market share and presence, new surgical scissors manufacturers may get into cooperative arrangements with local players during the forecast period.
| Attributes | Details |
|---|---|
| Growth Rate | CAGR of 2.9% from 2025 to 2035. |
| Base year for Estimation | 2025 |
| Historical Data Available for | 2020 to 2024 |
| Forecast Period | 2025 to 2035 |
| Quantitative Units | Revenue in million and CAGR from 2025 to 2035 |
| Report Coverage | Revenue Forecast, Volume Forecast, Company Ranking, Competitive Landscape, Growth Factors, Trends and Pricing Analysis. |
| Segments Covered | Material Type, Product Type, End Users, Regions |
| Regions Covered | North America; Latin America; Asia Pacific; Japan; Western Europe; Eastern Europe; Middle East & Africa |
| Key Countries Profiled | The USA, Canada, Brazil, Argentina, Germany, The UK, France, Spain, Italy, Nordics, BENELUX, Australia & New Zealand, China, India, GCC, South Africa |
| Key Companies Profiled | KLS Martin LP; B. Braun Melsungen AG; Erbe Elektromedizin GmbH; Scanlan International; Lamidey Noury Medical; DTR Medical Ltd; Purple Surgical International Ltd; Sklar Surgical Instruments; Accurate Surgical & Scientific Instruments Corp.; Others |
| Customization | Available upon Request |
The global surgical scissors market is estimated to be valued at USD 400.2 million in 2025.
It is projected to reach USD 532.6 million by 2035.
The market is expected to grow at a 2.9% CAGR between 2025 and 2035.
The key product types are steel, ceramic, tungsten, titanium and others.
reusable surgical scissors segment is expected to dominate with a 63.4% industry share in 2025.


Full Research Suite comprises of:
Market outlook & trends analysis
Interviews & case studies
Strategic recommendations
Vendor profiles & capabilities analysis
5-year forecasts
8 regions and 60+ country-level data splits
Market segment data splits
12 months of continuous data updates
DELIVERED AS:
PDF EXCEL ONLINE
Surgical Tourniquet Market Size and Share Forecast Outlook 2025 to 2035
Surgical Operating Microscope Market Forecast and Outlook 2025 to 2035
Surgical Heart Valves Market Size and Share Forecast Outlook 2025 to 2035
Surgical Aspirators Market Size and Share Forecast Outlook 2025 to 2035
Surgical Robot Procedures Market Size and Share Forecast Outlook 2025 to 2035
Surgical Wound Care Market Size and Share Forecast Outlook 2025 to 2035
Surgical Retractors Market Size and Share Forecast Outlook 2025 to 2035
Surgical Drainage Devices Market Size and Share Forecast Outlook 2025 to 2035
Surgical Booms Market Insights - Size, Share & Industry Growth 2025 to 2035
Surgical Instruments Tracking System Market Growth - Trends & Forecast 2025 to 2035
Surgical Instruments Packaging Market Size, Share & Forecast 2025 to 2035
Surgical Monitors Market Analysis - Industry Insights & Forecast 2025 to 2035
Surgical Scalpels Market Trends – Growth & Forecast 2025-2035
Surgical Generators Market – Trends & Forecast 2025 to 2035
Surgical Gloves Market Trends - Size, Demand & Forecast 2025 to 2035
Surgical Clips Market Analysis - Size, Share & Forecast 2025 to 2035
Surgical Mask Market Insights - Growth & Forecast 2025 to 2035
Surgical Drapes Market Overview - Growth, Demand & Forecast 2025 to 2035
Surgical Stapling Device Market is segmented by product, Usage Type, Stapling Type, Indication and End User from 2025 to 2035
Key Companies & Market Share in the Surgical Scrub Sector

Thank you!
You will receive an email from our Business Development Manager. Please be sure to check your SPAM/JUNK folder too.
Chat With
MaRIA