Reports

- Global Locations -

Headquarters

Future Market Insights, Inc.

Christiana Corporate, 200
Continental Drive, Suite 401,
Newark, Delaware - 19713,
United States

T: +1-845-579-5705

Americas

Future Market Insights, Inc.

616 Corporate Way, Suite 2-9018,
Valley Cottage, NY 10989, United States

T: +1-347-918-3531

MEA

Future Market Insights

1602-6 Jumeirah Bay X2 Tower, Plot No: JLT-PH2-X2A,
Jumeirah Lakes Towers, Dubai,
United Arab Emirates

Europe

Future Market Insights

3rd Floor, 207 Regent Street,
W1B 3HH London
United Kingdom

T: + 44 (0) 20 8123 9659
D: +44 (0) 20 3287 4268

Asia Pacific

Future Market Insights

IndiaLand Global Tech Park, Unit UG-1, Behind Grand HighStreet, Phase 1, Hinjawadi, MH, Pune – 411057, India

Cancer Diagnostics Market Snapshot (2023 to 2033)

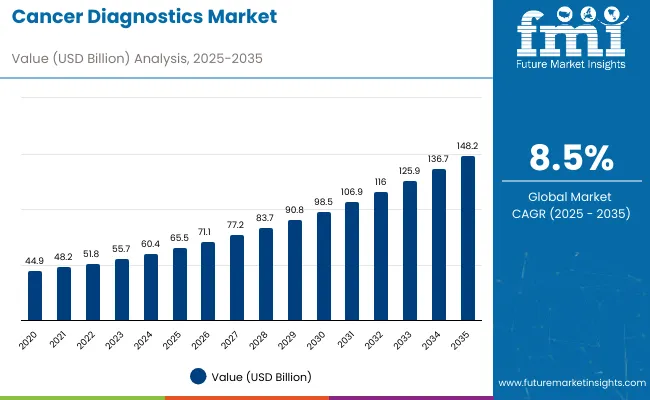
The global cancer diagnostics market is projected to expand steadily at a CAGR of 8.5% value, from 2023 to 2033. In the year 2023, the market size is projected to expand and gain a global market valuation of US$ 55.71 billion. Considering this increasing growth and demand in the global market, the market is expected to reach US$ 126 billion by 2033.

Cancer is among the top causes of mortality worldwide, and its incidence is increasing alarmingly. As a result, healthcare experts are concentrating on developing efficient treatment and diagnosis solutions to reduce the incidence level. Early detection improves treatment regimen success rates. Consequently, healthcare institutions and industrial companies are pushing routine exams through different awareness efforts.

Increases in the prevalence and incidence of different forms of cancer, such as lung and breast cancer, may boost the market over the projected period. Furthermore, a spike in technical improvements supporting the improved imaging of dangerous cells, innovations in equipment to detect the kind of cancer, and an increase in the accuracy of the result may assist the market in gaining momentum throughout the projection period. Increased government activities and other private groups to raise awareness about early cancer identification and prevention are expected to drive market expansion in the future.

Furthermore, increased diagnostics laboratory infrastructure in developed nations is projected to drive the market in the coming years. During the predicted period, there may be a significant increase in emphasis on health and safety laws and a boom in the popularity of yoga and other health-related practices. However, the high cost of diagnostic imaging systems and the development of diverse diagnostic techniques for distinct cancer mutations may stymie market expansion.

Attribute Details
Global Cancer Diagnostics Market Valuation in 2022 US$ 51.47 billion
Estimated Global Market Share in 2023 US$ 55.71 billion
Forecasted Global Market Size by 2033 US$ 126 billion
Projected Global Market Growth Rate from 2023 to 2033 8.5% CAGR
Historical Market Growth Rate from 2018 to 2022 7.5% CAGR

Don't pay for what you don't need

Customize your report by selecting specific countries or regions and save 30%!

2018 to 2022 Cancer Diagnostics Market Demand Analysis vs. Forecast 2023 to 2033

According to market research and competitive intelligence provider Future Market Insights, the market for cancer diagnostics reflected a value of 7.5% from 2018 to 2022. National lockdown, government controls, and a spike in infection rates across countries all had a financial impact on neurological clinics and hospitals. Several clinics and hospitals have seen a decrease in patient visits as a result of COVID-19, thereby minimizing client engagement.

Furthermore, many cancer diagnoses have been pushed back as a result of the COVID-19 dilemma. There was a global shortage of medical treatment for disorders other than COVID-19, which has had a detrimental influence on the cancer diagnostics business. Also, the restricted availability of healthcare personnel worldwide is another aspect that negatively impacts the cancer diagnostics industry.

However, post the pandemic, the complications in various people have increased. People suffering from even stage 1 cancer faced complications as the effects of the virus affected the immune system gravely. This paced up the demand for various drugs and also made the companies expand their product portfolio to provide enhanced immunity to the patients. As a result, the demand is expected to go over 8.5% CAGR during the forecast period.

Prominent Growth Drivers Influencing Cancer Diagnostics Market

Increasing the use of AI to boost the demand for Cancer Diagnostics

The usage of AI in cancer detection is also predicted to boost the market growth. Scientists have created AI technologies to help screen tests for several types of cancer, particularly breast cancer. For more than 20 years, AI-based computer algorithms have assisted clinicians in interpreting mammograms, but research in this field is rapidly expanding.

For example, Freenome, a United States-based AI genomics start-up, focuses on creating blood tests that utilize Artificial intelligence to detect the body's early warning of cancer. In October 2018, the business revealed preliminary findings from research and development for applying machine learning to identify colorectal cancer in its early stages.

The NCI's Center for Cancer Research, for example, built an AI model that might help radiologists identify possibly aggressive prostate cancer on a relatively new type of prostate MRI scan called multiparametric MRI. As a result, such achievements are projected to move the company forward in the worldwide market.

Establishment of Private Diagnostic Centers to aid Cancer Diagnostics Market Growth

Private diagnostic centers are expanding worldwide as the demand for diagnostic imaging operations rises, and the load on public hospitals grows due to the restricted imaging techniques available. In January 2021, FUJIFILM Corporation established NURA, a cancer screening medical screening center in Bangalore, India. FUJIFILM DKH LLP (FUJIFILM DKH) and Dr. Kutty's Healthcare run this medical screening center (DKH). FUJIFILM DKH LLP (FUJIFILM DKH) is a FUJIFILM and Dr. Kutty's Healthcare (DKH) joint venture that operates hospitals and screening facilities throughout India and the Middle East.

Various centers are also working on liquid biopsy and animal cancer therapies simultaneously. The advancement of biopsy platforms for companion animal malignancies is likely to provide profitable growth prospects for global cancer diagnostics market participants.

For example, Zomedica Pharmaceuticals Corp., a veterinary diagnostic and pharmaceutical business, stated in January 2020 that it has completed developing and manufacturing its reference lab cancer liquid biopsy platform for canine malignancies. These advanced developments in this field are expected to accelerate the global market during the forecast period.

Sabyasachi Ghosh
Sabyasachi Ghosh

Principal Consultant

Talk to Analyst

Find your sweet spots for generating winning opportunities in this market.

What Could Possibly Hinder Cancer Diagnostics Market Demand?

Poor Reimbursement Policies and Higher Costs may restrict Market Growth.

Inadequate reimbursement regulations are predicted to hamper market expansion. In recent years, there have been several developments in radiology regarding imaging equipment. However, most medical insurance companies do not cover computer-aided detection procedures (CAD). Consequently, individuals choose traditional diagnostic methods such as biopsies and pathology tests or conventional imaging methods such as mammography and MRI treatments.

Furthermore, the high cost of cancer detection software is projected to stifle market expansion. Computer-aided Detection (CAD) software comes with a one-year license, which hospitals must renew each year. Furthermore, some insurance companies are opting out of CAD procedure reimbursement since it is judged excessive and not recommended by senior radiologists. Such hindrances may affect the global market during the forecast period.

Category-wise Insights

Which Test Type is forecast to gain the Maximum Market Share?

The Imaging Segment may dominate the segment during the Forecast Period

With a 34.2% market share in 2022, the biopsy category led the market and is likely to retain its dominance throughout the forecast period. Modalities used in imaging like computed Tomography (CT) scans and Magnetic Resonance Imaging (MRI) are rapid, non-invasive, and painless diagnostic methods.

Imaging aids in cancer staging, as do prognostic and therapy system monitoring of metabolic and functional information. Due to these advantages, the use of imaging modalities in cancer screening programs has significantly grown. Globally, the use of sophisticated imaging tests, including such as multi-photon microscopy and magnetic resonance imaging, is increasing.

The various imaging modalities, in conjunction with other genetic and laboratory testing, are employed as supporting tests in detecting a range of cancer forms, aiding in the selection of a suitable treatment strategy. These factors are expected to propel the imaging segment at an 8.0% CAGR throughout the forecast period.

Category By Test Type
Top Segment Biopsy
Market Share in Percentage 34.2%
Category By End User
Top Segment Hospital Associated Lab
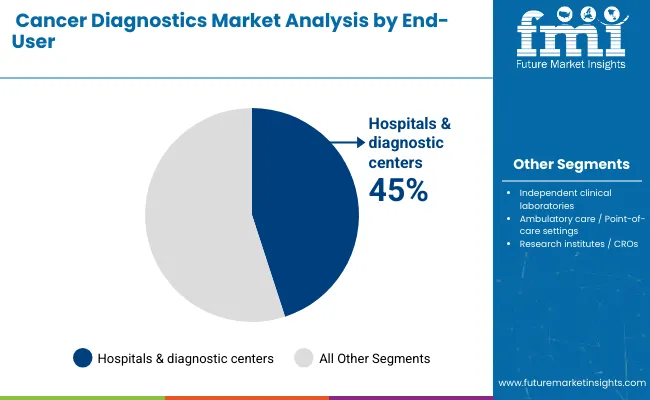
Market Share in Percentage 44.2%

Which Indication Segment may gain the larger share during The Forecast Period?

Breast Cancer Indication to gain significance during the forecast period

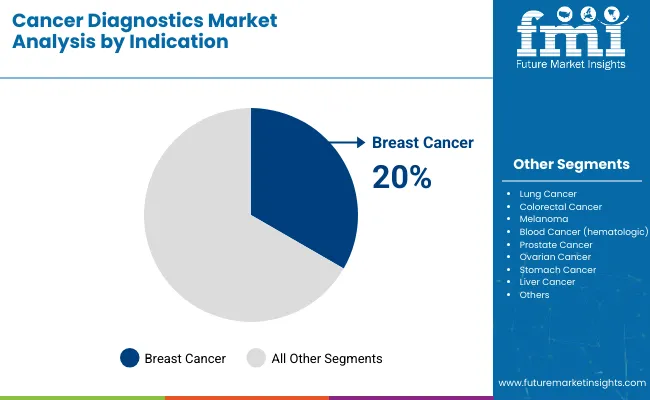
In 2021, the breast cancer sector held the key portion of the cancer diagnostics market, accounting for Mammography, which has become the most frequent and widely used screening technique at 34.0% for breast tumors.

Women between the ages of 50 and 74 are at a greater risk of getting breast cancer, according to the United States Preventive Services Task Force (USPSTF). As a result, the USPSTF advises that women over 40 have mammography done every two years.

Furthermore, several organizations, such as the National Breast Cancer Foundation, Inc., are launching campaigns to raise awareness about breast cancer, the benefits of early detection, and available treatment choices. Increased public awareness, along with campaigns supporting routine mammography, is driving the rising demand for scanning solutions in breast cancer detection.

Get the data you need at a Fraction of the cost

Personalize your report by choosing insights you need
and save 40%!

Region-wise Analysis

What is the outlook of the North American Cancer Diagnostics Market?

Various medical firms may boost the market demand for cancer diagnostics.

In terms of market share and revenue, the North American market is predicted to be the most lucrative market for cancer diagnostics during the forecast period, 2023 and 2033. In 2022, the regional cancer diagnostics market boomed with a revenue share of 38.9%

One of the primary factors propelling the diagnostics industry in the region is the presence of various biotechnology and medical device firms. North America is likely to maintain its lead during the projection period due to increased spending for Research and Development initiatives and widespread use of new technology.

Furthermore, the region's high concentration of important players, growing FDA approvals, strategic partnerships, and substantial expenditure in research & development activities are projected to enhance the market. Merck & Co. Inc., for example, entered into a formal agreement in November 2020 to purchase Velosbio Inc., a privately owned clinical-stage biopharmaceutical firm dedicated to developing first-in-class cancer medicines targeting the receptor tyrosine kinase-like orphan receptor 1. (ROR1). Such advancements may strengthen the demand in this region during the forecast period.

Regional Market Comparison Global Market Share in Percentage
North America 38.9%
Europe 30.1%

How is the growth of the cancer diagnostics market emerging in the Asia Pacific?

Increasing cancer incidences and low treatment rates may boost the demand in this region.

During the projection period, Asia Pacific is expected to record a CAGR of 6.9%. In the coming years, the Asia Pacific area is expected to be one of the emerging economies for cancer diagnostics.

Due to a big patient pool, the availability of experienced technicians at a reduced cost, and a clear regulatory environment encouraging quicker product approvals, Asia Pacific is likely to display the strongest growth in the near future. Furthermore, the burgeoning medical tourism business in countries like China, India, and Malaysia is likely to increase demand for cancer diagnosis and treatment screening.

East Asia's growth rate is predicted to accelerate. According to the World Health Organization, around 4.7 million new cancer cases may be diagnosed in China by 2025. Obesity and hormone exposure-related malignancies, such as breast cancer in women, and ‘lifestyle change-related diseases,’ such as prostate cancer in men, are on the rise in China, resulting in increased use of cancer diagnostics. These incidents may boost the regional growth of cancer diagnostics.

Regional Market Comparison Global Market Share in Percentage
United States 32.6%
Germany 4.5%
Japan 5.2%

What may be the outlook of the European cancer diagnostics market during the forecast period?

Desirable policies and growing diagnostic centers may accelerate the demand.

The European market is predicted to increase significantly throughout the forecast period, with a CAGR of 5.2% from 2023 to 2033.

Desirable healthcare policies and high average per capita healthcare costs have produced a favorable climate in the United Kingdom for the adoption of modern cancer diagnostic technology such as imaging. In addition, the existence of key players promotes expansion in the United Kingdom. These firms' strategies include new releases and growth initiatives, which may continue to help overall development in Europe.

Regional Markets CAGR (2023 to 2033)
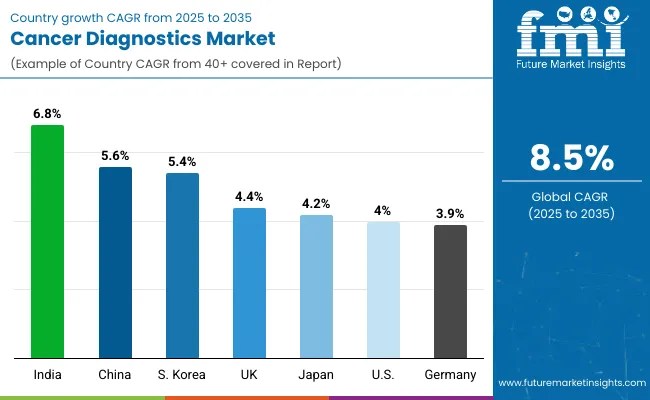
United Kingdom 6.4%
China 9.8%
India 8.33%
Australia 13.4%

Start-up Scenario

  • Race Oncology is an ASX-listed precise oncology firm developing Zantrene, a Phase 2/3 cancer medication. Zantrene is a powerful fatso/fat mass and obesity-linked (FTO) protein inhibitor. Overexpression of FTO has been identified as a genetic driver of a variety of malignancies. Race is investigating the potential of Zantrene as a novel treatment for melanoma and clear cell renal cell carcinoma, two malignancies that frequently over-express FTO. In groundbreaking preclinical research, Race revealed that Zantrene® protects against anthracycline-induced heart damage while also functioning in combination with anthracyclines to boost their capacity to target breast cancer. Race is assessing this discovery.
  • Carer, founded in 2018, aims to improve the quality of life of every cancer patient in the convenience of their own home. It attempts to give patients the best degree of support and therapy during and after treatment to help recovery. Their therapy has a significant benefit in that it can be tailored to each patient's diagnosis, prior health difficulties, and chosen lifestyle, making it more feasible in the long run. This is accomplished through their three-pronged approach, which includes a dietary protocol, a movement and meditation protocol, and a mental well-being protocol that educates and motivates patients and caregivers to make life-changing adjustments for more successful healing.

Competitive Landscape

The adoption of novel goods and their significant Research and Development efforts have helped key companies operating in the sector maintain a strong position in the worldwide market. The market's competition is projected to heat up soon as numerous businesses focus their efforts on research and the introduction of novel diagnostic procedures through product line expansions, acquisitions, and mergers.

  • Gland Pharma has launched the cancer treatment medicine Bortezomib for Injection in the United States in 2022. The drug business stated that it has released the medicine in the United States market through a partner who has acquired permission from the United States Food and Drug Administration (USFDA). The business claims its medicine is medically similar to Velcade for Injection from Takeda Pharmaceuticals. Bortezomib Intravenous is used to treat cancers such as myeloma and mantle cell lymphoma.
  • Bristol-Myers Squibb K.K. announced in 2022 that the Japanese Ministry of Health, Labour, and Welfare had approved Abecma (idecabtagene vicleucel), a B-cell maturation antigen (BCMA)-directed chimeric antigen receptor (CAR) T cell immunotherapy, for the treatment of adult patients with refractory or relapsed (R/R) multiple myeloma who had received a minimum of three prior therapies. In Japan, Abecma was the first CAR T cell therapy licensed for treating R/R multiple myeloma in 2021. In Japan, Abecma is the first CAR T cell therapy approved for treating R/R multiple myeloma in 2021. Bristol Myers Squibb is the only firm in Japan with two authorized CAR T cell therapies: the CD19-directed Breyanzi, approved in March 2021, and the BCMA-directed Abecma.

Report Scope

Attribute Details
Growth Rate CAGR of 8.5% from 2023 to 2033
Market Value for 2023 US$ 55.71 billion
Market Value for 2033 US$ 126 billion
Base Year for Estimation 2022
Historical Data 2018 to 2022
Forecast Period 2023 to 2033
Quantitative Units US$ billion for Value
Report Coverage Revenue Forecast, Company Ranking, Competitive Landscape, Growth Factors, Trends, and Pricing Analysis
Segments Covered
  • Test Type
  • Indication
  • End User
  • Region
Regions Covered
  • North America
  • Latin America
  • Europe
  • East Asia
  • South Asia
  • Oceania
  • The Middle East & Africa (MEA)
Key Countries Profiled
  • United States
  • Canada
  • Brazil
  • Mexico
  • Germany
  • United Kingdom
  • France
  • Spain
  • Italy
  • China
  • Japan
  • South Korea
  • Malaysia
  • Singapore
  • Australia
  • New Zealand
  • Gulf Cooperation Council Countries
  • South Africa
  • Israel
Key Companies Profiled
  • Abbott Laboratories
  • Roche Holding AG
  • Thermo Fisher Scientific Inc.
  • Siemens AG
  • Bio Rad Laboratories Inc.
  • GE Healthcare
  • Illumina, Inc.
  • Bristol-Myers Squibb
  • Koninklijke Philips N.V.
  • Toshiba Medical Systems Corporation
  • Agilent Technologies Inc.
Report Customization & Pricing Available upon Request

Key Segments Covered in the Cancer Diagnostics Market Report

Cancer Diagnostics Market by Test Type:

  • Tumor Biomarkers Tests
    • PSA Tests
    • CTC Tests
    • AFP Tests
    • CA Tests
    • HER2 Tests
    • BRCA Tests
    • ALK Tests
    • CEA Tests
    • EGFR Mutation Tests
    • KRAS Mutation Tests
    • Others
    • Ultrasound
    • Mammography
    • MRI Scan
    • PET Scan
    • CT Scan
    • SPECT & Others
  • Biopsy
    • Needle Biopsy
    • Endoscopic Biopsy
    • Bone Marrow Biopsy
    • Others
  • Liquid Biopsy
  • Immunohistochemistry
  • In Situ Hybridization

Cancer Diagnostics Market by Indication:

  • Breast Cancer
  • Lung Cancer
  • Colorectal Cancer
  • Melanoma
  • Blood Cancer
  • Prostate Cancer
  • Ovarian Cancer
  • Stomach Cancer
  • Liver Cancer
  • Others

Cancer Diagnostics Market by End User:

  • Hospital Associated Labs
  • Independent Diagnostic Laboratories
  • Diagnostic Imaging Centers
  • Cancer Research Institutes
  • Others

Cancer Diagnostics Market by Region:

  • North America
  • Latin America
  • Europe
  • East Asia
  • South Asia
  • Oceania
  • The Middle East & Africa (MEA)

Frequently Asked Questions

How Big will the Cancer Diagnostics Market be by 2023?

The market size is expected to reach a value of US$ 55.71 billion by 2023-end.

What is the contribution of North America to the Cancer Diagnostics Market?

By 2022, the North America market accounted for a valuation of 38.9% globally.

Which test type is advancing at a faster rate?

The imaging segment is expected to advance at a faster rate by 2033.

Which Country is Set to Register Exponential Growth in the Market?

India is set to register an exponential growth of 8.33% through 2033.

Which regional market will witness higher growth?

The China market is to grow at 9.8% CAGR through 2033.

Table of Content

1. Executive Summary

    1.1. Global Market Outlook

    1.2. Demand-side Trends

    1.3. Supply-side Trends

    1.4. Technology Roadmap Analysis

    1.5. Analysis and Recommendations

2. Market Overview

    2.1. Market Coverage / Taxonomy

    2.2. Market Definition / Scope / Limitations

3. Market Background

    3.1. Market Dynamics

        3.1.1. Drivers

        3.1.2. Restraints

        3.1.3. Opportunity

        3.1.4. Trends

    3.2. Scenario Forecast

        3.2.1. Demand in Optimistic Scenario

        3.2.2. Demand in Likely Scenario

        3.2.3. Demand in Conservative Scenario

    3.3. Opportunity Map Analysis

    3.4. Investment Feasibility Matrix

    3.5. PESTLE and Porter’s Analysis

    3.6. Regulatory Landscape

        3.6.1. By Key Regions

        3.6.2. By Key Countries

    3.7. Regional Parent Market Outlook

4. Global Market Analysis 2018 to 2022 and Forecast, 2023 to 2033

    4.1. Historical Market Size Value (US$ Million) Analysis, 2018 to 2022

    4.2. Current and Future Market Size Value (US$ Million) Projections, 2023 to 2033

        4.2.1. Y-o-Y Growth Trend Analysis

        4.2.2. Absolute $ Opportunity Analysis

5. Global Market Analysis 2018 to 2022 and Forecast 2023 to 2033, By Test Type

    5.1. Introduction / Key Findings

    5.2. Historical Market Size Value (US$ Million) Analysis By Test Type, 2018 to 2022

    5.3. Current and Future Market Size Value (US$ Million) Analysis and Forecast By Test Type, 2023 to 2033

        5.3.1. Tumor Biomarkers Tests

            5.3.1.1. PSA Tests

            5.3.1.2. CTC Tests

            5.3.1.3. AFP Tests

            5.3.1.4. CA Tests

            5.3.1.5. HER2 Tests

            5.3.1.6. BRCA Tests

            5.3.1.7. ALK Tests

            5.3.1.8. CEA Tests

            5.3.1.9. EGFR Mutation Tests

            5.3.1.10. Others

        5.3.2. Imaging

            5.3.2.1. Ultrasound

            5.3.2.2. Mammography

            5.3.2.3. MRI Scan

            5.3.2.4. PET Scan

            5.3.2.5. CT Scan

            5.3.2.6. SPECT & Others

        5.3.3. Biopsy

            5.3.3.1. Needle Biopsy

            5.3.3.2. Endoscopic Biopsy

            5.3.3.3. Bone Marrow Biopsy

            5.3.3.4. Others

        5.3.4. Liquid Biopsy

        5.3.5. Immunohistochemistry

        5.3.6. In Situ Hybridization

    5.4. Y-o-Y Growth Trend Analysis By Test Type, 2018 to 2022

    5.5. Absolute $ Opportunity Analysis By Test Type, 2023 to 2033

6. Global Market Analysis 2018 to 2022 and Forecast 2023 to 2033, By Indication

    6.1. Introduction / Key Findings

    6.2. Historical Market Size Value (US$ Million) Analysis By Indication, 2018 to 2022

    6.3. Current and Future Market Size Value (US$ Million) Analysis and Forecast By Indication, 2023 to 2033

        6.3.1. Breast Cancer

        6.3.2. Lung Cancer

        6.3.3. Colorectal Cancer

        6.3.4. Melanoma

        6.3.5. Blood Cancer

        6.3.6. Prostate Cancer

        6.3.7. Ovarian Cancer

        6.3.8. Stomach Cancer

        6.3.9. Liver Cancer

        6.3.10. Others

    6.4. Y-o-Y Growth Trend Analysis By Indication, 2018 to 2022

    6.5. Absolute $ Opportunity Analysis By Indication, 2023 to 2033

7. Global Market Analysis 2018 to 2022 and Forecast 2023 to 2033, By End User

    7.1. Introduction / Key Findings

    7.2. Historical Market Size Value (US$ Million) Analysis by End User, 2018 to 2022

    7.3. Current and Future Market Size Value (US$ Million) Analysis and Forecast by End User, 2023 to 2033

        7.3.1. Hospital Associated Labs

        7.3.2. Independent Diagnostic Laboratories

        7.3.3. Diagnostic Imaging Centers

        7.3.4. Cancer Research Institutes

        7.3.5. Others

    7.4. Y-o-Y Growth Trend Analysis by End User, 2018 to 2022

    7.5. Absolute $ Opportunity Analysis by End User, 2023 to 2033

8. Global Market Analysis 2018 to 2022 and Forecast 2023 to 2033, By Region

    8.1. Introduction

    8.2. Historical Market Size Value (US$ Million) Analysis By Region, 2018 to 2022

    8.3. Current Market Size Value (US$ Million) Analysis and Forecast By Region, 2023 to 2033

        8.3.1. North America

        8.3.2. Latin America

        8.3.3. Western Europe

        8.3.4. Eastern Europe

        8.3.5. South Asia and Pacific

        8.3.6. East Asia

        8.3.7. Middle East and Africa

    8.4. Market Attractiveness Analysis By Region

9. North America Market Analysis 2018 to 2022 and Forecast 2023 to 2033, By Country

    9.1. Historical Market Size Value (US$ Million) Trend Analysis By Market Taxonomy, 2018 to 2022

    9.2. Market Size Value (US$ Million) Forecast By Market Taxonomy, 2023 to 2033

        9.2.1. By Country

            9.2.1.1. The USA

            9.2.1.2. Canada

        9.2.2. By Test Type

        9.2.3. By Indication

        9.2.4. By End User

    9.3. Market Attractiveness Analysis

        9.3.1. By Country

        9.3.2. By Test Type

        9.3.3. By Indication

        9.3.4. By End User

    9.4. Key Takeaways

10. Latin America Market Analysis 2018 to 2022 and Forecast 2023 to 2033, By Country

    10.1. Historical Market Size Value (US$ Million) Trend Analysis By Market Taxonomy, 2018 to 2022

    10.2. Market Size Value (US$ Million) Forecast By Market Taxonomy, 2023 to 2033

        10.2.1. By Country

            10.2.1.1. Brazil

            10.2.1.2. Mexico

            10.2.1.3. Rest of Latin America

        10.2.2. By Test Type

        10.2.3. By Indication

        10.2.4. By End User

    10.3. Market Attractiveness Analysis

        10.3.1. By Country

        10.3.2. By Test Type

        10.3.3. By Indication

        10.3.4. By End User

    10.4. Key Takeaways

11. Western Europe Market Analysis 2018 to 2022 and Forecast 2023 to 2033, By Country

    11.1. Historical Market Size Value (US$ Million) Trend Analysis By Market Taxonomy, 2018 to 2022

    11.2. Market Size Value (US$ Million) Forecast By Market Taxonomy, 2023 to 2033

        11.2.1. By Country

            11.2.1.1. Germany

            11.2.1.2. United Kingdom

            11.2.1.3. France

            11.2.1.4. Spain

            11.2.1.5. Italy

            11.2.1.6. Rest of Western Europe

        11.2.2. By Test Type

        11.2.3. By Indication

        11.2.4. By End User

    11.3. Market Attractiveness Analysis

        11.3.1. By Country

        11.3.2. By Test Type

        11.3.3. By Indication

        11.3.4. By End User

    11.4. Key Takeaways

12. Eastern Europe Market Analysis 2018 to 2022 and Forecast 2023 to 2033, By Country

    12.1. Historical Market Size Value (US$ Million) Trend Analysis By Market Taxonomy, 2018 to 2022

    12.2. Market Size Value (US$ Million) Forecast By Market Taxonomy, 2023 to 2033

        12.2.1. By Country

            12.2.1.1. Poland

            12.2.1.2. Russia

            12.2.1.3. Czech Republic

            12.2.1.4. Romania

            12.2.1.5. Rest of Eastern Europe

        12.2.2. By Test Type

        12.2.3. By Indication

        12.2.4. By End User

    12.3. Market Attractiveness Analysis

        12.3.1. By Country

        12.3.2. By Test Type

        12.3.3. By Indication

        12.3.4. By End User

    12.4. Key Takeaways

13. South Asia and Pacific Market Analysis 2018 to 2022 and Forecast 2023 to 2033, By Country

    13.1. Historical Market Size Value (US$ Million) Trend Analysis By Market Taxonomy, 2018 to 2022

    13.2. Market Size Value (US$ Million) Forecast By Market Taxonomy, 2023 to 2033

        13.2.1. By Country

            13.2.1.1. India

            13.2.1.2. Bangladesh

            13.2.1.3. Australia

            13.2.1.4. New Zealand

            13.2.1.5. Rest of South Asia and Pacific

        13.2.2. By Test Type

        13.2.3. By Indication

        13.2.4. By End User

    13.3. Market Attractiveness Analysis

        13.3.1. By Country

        13.3.2. By Test Type

        13.3.3. By Indication

        13.3.4. By End User

    13.4. Key Takeaways

14. East Asia Market Analysis 2018 to 2022 and Forecast 2023 to 2033, By Country

    14.1. Historical Market Size Value (US$ Million) Trend Analysis By Market Taxonomy, 2018 to 2022

    14.2. Market Size Value (US$ Million) Forecast By Market Taxonomy, 2023 to 2033

        14.2.1. By Country

            14.2.1.1. China

            14.2.1.2. Japan

            14.2.1.3. South Korea

        14.2.2. By Test Type

        14.2.3. By Indication

        14.2.4. By End User

    14.3. Market Attractiveness Analysis

        14.3.1. By Country

        14.3.2. By Test Type

        14.3.3. By Indication

        14.3.4. By End User

    14.4. Key Takeaways

15. Middle East and Africa Market Analysis 2018 to 2022 and Forecast 2023 to 2033, By Country

    15.1. Historical Market Size Value (US$ Million) Trend Analysis By Market Taxonomy, 2018 to 2022

    15.2. Market Size Value (US$ Million) Forecast By Market Taxonomy, 2023 to 2033

        15.2.1. By Country

            15.2.1.1. GCC Countries

            15.2.1.2. South Africa

            15.2.1.3. Israel

            15.2.1.4. Rest of MEA

        15.2.2. By Test Type

        15.2.3. By Indication

        15.2.4. By End User

    15.3. Market Attractiveness Analysis

        15.3.1. By Country

        15.3.2. By Test Type

        15.3.3. By Indication

        15.3.4. By End User

    15.4. Key Takeaways

16. Key Countries Market Analysis

    16.1. USA

        16.1.1. Pricing Analysis

        16.1.2. Market Share Analysis, 2022

            16.1.2.1. By Test Type

            16.1.2.2. By Indication

            16.1.2.3. By End User

    16.2. Canada

        16.2.1. Pricing Analysis

        16.2.2. Market Share Analysis, 2022

            16.2.2.1. By Test Type

            16.2.2.2. By Indication

            16.2.2.3. By End User

    16.3. Brazil

        16.3.1. Pricing Analysis

        16.3.2. Market Share Analysis, 2022

            16.3.2.1. By Test Type

            16.3.2.2. By Indication

            16.3.2.3. By End User

    16.4. Mexico

        16.4.1. Pricing Analysis

        16.4.2. Market Share Analysis, 2022

            16.4.2.1. By Test Type

            16.4.2.2. By Indication

            16.4.2.3. By End User

    16.5. Germany

        16.5.1. Pricing Analysis

        16.5.2. Market Share Analysis, 2022

            16.5.2.1. By Test Type

            16.5.2.2. By Indication

            16.5.2.3. By End User

    16.6. United Kingdom

        16.6.1. Pricing Analysis

        16.6.2. Market Share Analysis, 2022

            16.6.2.1. By Test Type

            16.6.2.2. By Indication

            16.6.2.3. By End User

    16.7. France

        16.7.1. Pricing Analysis

        16.7.2. Market Share Analysis, 2022

            16.7.2.1. By Test Type

            16.7.2.2. By Indication

            16.7.2.3. By End User

    16.8. Spain

        16.8.1. Pricing Analysis

        16.8.2. Market Share Analysis, 2022

            16.8.2.1. By Test Type

            16.8.2.2. By Indication

            16.8.2.3. By End User

    16.9. Italy

        16.9.1. Pricing Analysis

        16.9.2. Market Share Analysis, 2022

            16.9.2.1. By Test Type

            16.9.2.2. By Indication

            16.9.2.3. By End User

    16.10. Poland

        16.10.1. Pricing Analysis

        16.10.2. Market Share Analysis, 2022

            16.10.2.1. By Test Type

            16.10.2.2. By Indication

            16.10.2.3. By End User

    16.11. Russia

        16.11.1. Pricing Analysis

        16.11.2. Market Share Analysis, 2022

            16.11.2.1. By Test Type

            16.11.2.2. By Indication

            16.11.2.3. By End User

    16.12. Czech Republic

        16.12.1. Pricing Analysis

        16.12.2. Market Share Analysis, 2022

            16.12.2.1. By Test Type

            16.12.2.2. By Indication

            16.12.2.3. By End User

    16.13. Romania

        16.13.1. Pricing Analysis

        16.13.2. Market Share Analysis, 2022

            16.13.2.1. By Test Type

            16.13.2.2. By Indication

            16.13.2.3. By End User

    16.14. India

        16.14.1. Pricing Analysis

        16.14.2. Market Share Analysis, 2022

            16.14.2.1. By Test Type

            16.14.2.2. By Indication

            16.14.2.3. By End User

    16.15. Bangladesh

        16.15.1. Pricing Analysis

        16.15.2. Market Share Analysis, 2022

            16.15.2.1. By Test Type

            16.15.2.2. By Indication

            16.15.2.3. By End User

    16.16. Australia

        16.16.1. Pricing Analysis

        16.16.2. Market Share Analysis, 2022

            16.16.2.1. By Test Type

            16.16.2.2. By Indication

            16.16.2.3. By End User

    16.17. New Zealand

        16.17.1. Pricing Analysis

        16.17.2. Market Share Analysis, 2022

            16.17.2.1. By Test Type

            16.17.2.2. By Indication

            16.17.2.3. By End User

    16.18. China

        16.18.1. Pricing Analysis

        16.18.2. Market Share Analysis, 2022

            16.18.2.1. By Test Type

            16.18.2.2. By Indication

            16.18.2.3. By End User

    16.19. Japan

        16.19.1. Pricing Analysis

        16.19.2. Market Share Analysis, 2022

            16.19.2.1. By Test Type

            16.19.2.2. By Indication

            16.19.2.3. By End User

    16.20. South Korea

        16.20.1. Pricing Analysis

        16.20.2. Market Share Analysis, 2022

            16.20.2.1. By Test Type

            16.20.2.2. By Indication

            16.20.2.3. By End User

    16.21. GCC Countries

        16.21.1. Pricing Analysis

        16.21.2. Market Share Analysis, 2022

            16.21.2.1. By Test Type

            16.21.2.2. By Indication

            16.21.2.3. By End User

    16.22. South Africa

        16.22.1. Pricing Analysis

        16.22.2. Market Share Analysis, 2022

            16.22.2.1. By Test Type

            16.22.2.2. By Indication

            16.22.2.3. By End User

    16.23. Israel

        16.23.1. Pricing Analysis

        16.23.2. Market Share Analysis, 2022

            16.23.2.1. By Test Type

            16.23.2.2. By Indication

            16.23.2.3. By End User

17. Market Structure Analysis

    17.1. Competition Dashboard

    17.2. Competition Benchmarking

    17.3. Market Share Analysis of Top Players

        17.3.1. By Regional

        17.3.2. By Test Type

        17.3.3. By Indication

        17.3.4. By End User

18. Competition Analysis

    18.1. Competition Deep Dive

        18.1.1. Abbott Laboratories

            18.1.1.1. Overview

            18.1.1.2. Product Portfolio

            18.1.1.3. Profitability by Market Segments

            18.1.1.4. Sales Footprint

            18.1.1.5. Strategy Overview

                18.1.1.5.1. Marketing Strategy

        18.1.2. Roche Holding AG

            18.1.2.1. Overview

            18.1.2.2. Product Portfolio

            18.1.2.3. Profitability by Market Segments

            18.1.2.4. Sales Footprint

            18.1.2.5. Strategy Overview

                18.1.2.5.1. Marketing Strategy

        18.1.3. Thermo Fisher Scientific Inc.

            18.1.3.1. Overview

            18.1.3.2. Product Portfolio

            18.1.3.3. Profitability by Market Segments

            18.1.3.4. Sales Footprint

            18.1.3.5. Strategy Overview

                18.1.3.5.1. Marketing Strategy

        18.1.4. Siemens AG

            18.1.4.1. Overview

            18.1.4.2. Product Portfolio

            18.1.4.3. Profitability by Market Segments

            18.1.4.4. Sales Footprint

            18.1.4.5. Strategy Overview

                18.1.4.5.1. Marketing Strategy

        18.1.5. Bio Rad Laboratories Inc.

            18.1.5.1. Overview

            18.1.5.2. Product Portfolio

            18.1.5.3. Profitability by Market Segments

            18.1.5.4. Sales Footprint

            18.1.5.5. Strategy Overview

                18.1.5.5.1. Marketing Strategy

        18.1.6. GE Healthcare

            18.1.6.1. Overview

            18.1.6.2. Product Portfolio

            18.1.6.3. Profitability by Market Segments

            18.1.6.4. Sales Footprint

            18.1.6.5. Strategy Overview

                18.1.6.5.1. Marketing Strategy

        18.1.7. Illumina, Inc.

            18.1.7.1. Overview

            18.1.7.2. Product Portfolio

            18.1.7.3. Profitability by Market Segments

            18.1.7.4. Sales Footprint

            18.1.7.5. Strategy Overview

                18.1.7.5.1. Marketing Strategy

        18.1.8. Bristol-Myers Squibb

            18.1.8.1. Overview

            18.1.8.2. Product Portfolio

            18.1.8.3. Profitability by Market Segments

            18.1.8.4. Sales Footprint

            18.1.8.5. Strategy Overview

                18.1.8.5.1. Marketing Strategy

        18.1.9. Koninklijke Philips N.V.

            18.1.9.1. Overview

            18.1.9.2. Product Portfolio

            18.1.9.3. Profitability by Market Segments

            18.1.9.4. Sales Footprint

            18.1.9.5. Strategy Overview

                18.1.9.5.1. Marketing Strategy

        18.1.10. Toshiba Medical Systems Corporation

            18.1.10.1. Overview

            18.1.10.2. Product Portfolio

            18.1.10.3. Profitability by Market Segments

            18.1.10.4. Sales Footprint

            18.1.10.5. Strategy Overview

                18.1.10.5.1. Marketing Strategy

        18.1.11. Agilent Technologies Inc.

            18.1.11.1. Overview

            18.1.11.2. Product Portfolio

            18.1.11.3. Profitability by Market Segments

            18.1.11.4. Sales Footprint

            18.1.11.5. Strategy Overview

                18.1.11.5.1. Marketing Strategy

19. Assumptions & Acronyms Used

20. Research Methodology

Don't pay for what you don't need

Customize your report by selecting specific countries or regions and save 30%!

List of Tables

Table 1: Global Market Value (US$ Million) Forecast by Region, 2018 to 2033

Table 2: Global Market Value (US$ Million) Forecast by Test Type, 2018 to 2033

Table 3: Global Market Value (US$ Million) Forecast by Indication, 2018 to 2033

Table 4: Global Market Value (US$ Million) Forecast by End User, 2018 to 2033

Table 5: North America Market Value (US$ Million) Forecast by Country, 2018 to 2033

Table 6: North America Market Value (US$ Million) Forecast by Test Type, 2018 to 2033

Table 7: North America Market Value (US$ Million) Forecast by Indication, 2018 to 2033

Table 8: North America Market Value (US$ Million) Forecast by End User, 2018 to 2033

Table 9: Latin America Market Value (US$ Million) Forecast by Country, 2018 to 2033

Table 10: Latin America Market Value (US$ Million) Forecast by Test Type, 2018 to 2033

Table 11: Latin America Market Value (US$ Million) Forecast by Indication, 2018 to 2033

Table 12: Latin America Market Value (US$ Million) Forecast by End User, 2018 to 2033

Table 13: Western Europe Market Value (US$ Million) Forecast by Country, 2018 to 2033

Table 14: Western Europe Market Value (US$ Million) Forecast by Test Type, 2018 to 2033

Table 15: Western Europe Market Value (US$ Million) Forecast by Indication, 2018 to 2033

Table 16: Western Europe Market Value (US$ Million) Forecast by End User, 2018 to 2033

Table 17: Eastern Europe Market Value (US$ Million) Forecast by Country, 2018 to 2033

Table 18: Eastern Europe Market Value (US$ Million) Forecast by Test Type, 2018 to 2033

Table 19: Eastern Europe Market Value (US$ Million) Forecast by Indication, 2018 to 2033

Table 20: Eastern Europe Market Value (US$ Million) Forecast by End User, 2018 to 2033

Table 21: South Asia and Pacific Market Value (US$ Million) Forecast by Country, 2018 to 2033

Table 22: South Asia and Pacific Market Value (US$ Million) Forecast by Test Type, 2018 to 2033

Table 23: South Asia and Pacific Market Value (US$ Million) Forecast by Indication, 2018 to 2033

Table 24: South Asia and Pacific Market Value (US$ Million) Forecast by End User, 2018 to 2033

Table 25: East Asia Market Value (US$ Million) Forecast by Country, 2018 to 2033

Table 26: East Asia Market Value (US$ Million) Forecast by Test Type, 2018 to 2033

Table 27: East Asia Market Value (US$ Million) Forecast by Indication, 2018 to 2033

Table 28: East Asia Market Value (US$ Million) Forecast by End User, 2018 to 2033

Table 29: Middle East and Africa Market Value (US$ Million) Forecast by Country, 2018 to 2033

Table 30: Middle East and Africa Market Value (US$ Million) Forecast by Test Type, 2018 to 2033

Table 31: Middle East and Africa Market Value (US$ Million) Forecast by Indication, 2018 to 2033

Table 32: Middle East and Africa Market Value (US$ Million) Forecast by End User, 2018 to 2033
Sabyasachi Ghosh
Sabyasachi Ghosh

Principal Consultant

Talk to Analyst

Find your sweet spots for generating winning opportunities in this market.

List of Charts

Figure 1: Global Market Value (US$ Million) by Test Type, 2023 to 2033

Figure 2: Global Market Value (US$ Million) by Indication, 2023 to 2033

Figure 3: Global Market Value (US$ Million) by End User, 2023 to 2033

Figure 4: Global Market Value (US$ Million) by Region, 2023 to 2033

Figure 5: Global Market Value (US$ Million) Analysis by Region, 2018 to 2033

Figure 6: Global Market Value Share (%) and BPS Analysis by Region, 2023 to 2033

Figure 7: Global Market Y-o-Y Growth (%) Projections by Region, 2023 to 2033

Figure 8: Global Market Value (US$ Million) Analysis by Test Type, 2018 to 2033

Figure 9: Global Market Value Share (%) and BPS Analysis by Test Type, 2023 to 2033

Figure 10: Global Market Y-o-Y Growth (%) Projections by Test Type, 2023 to 2033

Figure 11: Global Market Value (US$ Million) Analysis by Indication, 2018 to 2033

Figure 12: Global Market Value Share (%) and BPS Analysis by Indication, 2023 to 2033

Figure 13: Global Market Y-o-Y Growth (%) Projections by Indication, 2023 to 2033

Figure 14: Global Market Value (US$ Million) Analysis by End User, 2018 to 2033

Figure 15: Global Market Value Share (%) and BPS Analysis by End User, 2023 to 2033

Figure 16: Global Market Y-o-Y Growth (%) Projections by End User, 2023 to 2033

Figure 17: Global Market Attractiveness by Test Type, 2023 to 2033

Figure 18: Global Market Attractiveness by Indication, 2023 to 2033

Figure 19: Global Market Attractiveness by End User, 2023 to 2033

Figure 20: Global Market Attractiveness by Region, 2023 to 2033

Figure 21: North America Market Value (US$ Million) by Test Type, 2023 to 2033

Figure 22: North America Market Value (US$ Million) by Indication, 2023 to 2033

Figure 23: North America Market Value (US$ Million) by End User, 2023 to 2033

Figure 24: North America Market Value (US$ Million) by Country, 2023 to 2033

Figure 25: North America Market Value (US$ Million) Analysis by Country, 2018 to 2033

Figure 26: North America Market Value Share (%) and BPS Analysis by Country, 2023 to 2033

Figure 27: North America Market Y-o-Y Growth (%) Projections by Country, 2023 to 2033

Figure 28: North America Market Value (US$ Million) Analysis by Test Type, 2018 to 2033

Figure 29: North America Market Value Share (%) and BPS Analysis by Test Type, 2023 to 2033

Figure 30: North America Market Y-o-Y Growth (%) Projections by Test Type, 2023 to 2033

Figure 31: North America Market Value (US$ Million) Analysis by Indication, 2018 to 2033

Figure 32: North America Market Value Share (%) and BPS Analysis by Indication, 2023 to 2033

Figure 33: North America Market Y-o-Y Growth (%) Projections by Indication, 2023 to 2033

Figure 34: North America Market Value (US$ Million) Analysis by End User, 2018 to 2033

Figure 35: North America Market Value Share (%) and BPS Analysis by End User, 2023 to 2033

Figure 36: North America Market Y-o-Y Growth (%) Projections by End User, 2023 to 2033

Figure 37: North America Market Attractiveness by Test Type, 2023 to 2033

Figure 38: North America Market Attractiveness by Indication, 2023 to 2033

Figure 39: North America Market Attractiveness by End User, 2023 to 2033

Figure 40: North America Market Attractiveness by Country, 2023 to 2033

Figure 41: Latin America Market Value (US$ Million) by Test Type, 2023 to 2033

Figure 42: Latin America Market Value (US$ Million) by Indication, 2023 to 2033

Figure 43: Latin America Market Value (US$ Million) by End User, 2023 to 2033

Figure 44: Latin America Market Value (US$ Million) by Country, 2023 to 2033

Figure 45: Latin America Market Value (US$ Million) Analysis by Country, 2018 to 2033

Figure 46: Latin America Market Value Share (%) and BPS Analysis by Country, 2023 to 2033

Figure 47: Latin America Market Y-o-Y Growth (%) Projections by Country, 2023 to 2033

Figure 48: Latin America Market Value (US$ Million) Analysis by Test Type, 2018 to 2033

Figure 49: Latin America Market Value Share (%) and BPS Analysis by Test Type, 2023 to 2033

Figure 50: Latin America Market Y-o-Y Growth (%) Projections by Test Type, 2023 to 2033

Figure 51: Latin America Market Value (US$ Million) Analysis by Indication, 2018 to 2033

Figure 52: Latin America Market Value Share (%) and BPS Analysis by Indication, 2023 to 2033

Figure 53: Latin America Market Y-o-Y Growth (%) Projections by Indication, 2023 to 2033

Figure 54: Latin America Market Value (US$ Million) Analysis by End User, 2018 to 2033

Figure 55: Latin America Market Value Share (%) and BPS Analysis by End User, 2023 to 2033

Figure 56: Latin America Market Y-o-Y Growth (%) Projections by End User, 2023 to 2033

Figure 57: Latin America Market Attractiveness by Test Type, 2023 to 2033

Figure 58: Latin America Market Attractiveness by Indication, 2023 to 2033

Figure 59: Latin America Market Attractiveness by End User, 2023 to 2033

Figure 60: Latin America Market Attractiveness by Country, 2023 to 2033

Figure 61: Western Europe Market Value (US$ Million) by Test Type, 2023 to 2033

Figure 62: Western Europe Market Value (US$ Million) by Indication, 2023 to 2033

Figure 63: Western Europe Market Value (US$ Million) by End User, 2023 to 2033

Figure 64: Western Europe Market Value (US$ Million) by Country, 2023 to 2033

Figure 65: Western Europe Market Value (US$ Million) Analysis by Country, 2018 to 2033

Figure 66: Western Europe Market Value Share (%) and BPS Analysis by Country, 2023 to 2033

Figure 67: Western Europe Market Y-o-Y Growth (%) Projections by Country, 2023 to 2033

Figure 68: Western Europe Market Value (US$ Million) Analysis by Test Type, 2018 to 2033

Figure 69: Western Europe Market Value Share (%) and BPS Analysis by Test Type, 2023 to 2033

Figure 70: Western Europe Market Y-o-Y Growth (%) Projections by Test Type, 2023 to 2033

Figure 71: Western Europe Market Value (US$ Million) Analysis by Indication, 2018 to 2033

Figure 72: Western Europe Market Value Share (%) and BPS Analysis by Indication, 2023 to 2033

Figure 73: Western Europe Market Y-o-Y Growth (%) Projections by Indication, 2023 to 2033

Figure 74: Western Europe Market Value (US$ Million) Analysis by End User, 2018 to 2033

Figure 75: Western Europe Market Value Share (%) and BPS Analysis by End User, 2023 to 2033

Figure 76: Western Europe Market Y-o-Y Growth (%) Projections by End User, 2023 to 2033

Figure 77: Western Europe Market Attractiveness by Test Type, 2023 to 2033

Figure 78: Western Europe Market Attractiveness by Indication, 2023 to 2033

Figure 79: Western Europe Market Attractiveness by End User, 2023 to 2033

Figure 80: Western Europe Market Attractiveness by Country, 2023 to 2033

Figure 81: Eastern Europe Market Value (US$ Million) by Test Type, 2023 to 2033

Figure 82: Eastern Europe Market Value (US$ Million) by Indication, 2023 to 2033

Figure 83: Eastern Europe Market Value (US$ Million) by End User, 2023 to 2033

Figure 84: Eastern Europe Market Value (US$ Million) by Country, 2023 to 2033

Figure 85: Eastern Europe Market Value (US$ Million) Analysis by Country, 2018 to 2033

Figure 86: Eastern Europe Market Value Share (%) and BPS Analysis by Country, 2023 to 2033

Figure 87: Eastern Europe Market Y-o-Y Growth (%) Projections by Country, 2023 to 2033

Figure 88: Eastern Europe Market Value (US$ Million) Analysis by Test Type, 2018 to 2033

Figure 89: Eastern Europe Market Value Share (%) and BPS Analysis by Test Type, 2023 to 2033

Figure 90: Eastern Europe Market Y-o-Y Growth (%) Projections by Test Type, 2023 to 2033

Figure 91: Eastern Europe Market Value (US$ Million) Analysis by Indication, 2018 to 2033

Figure 92: Eastern Europe Market Value Share (%) and BPS Analysis by Indication, 2023 to 2033

Figure 93: Eastern Europe Market Y-o-Y Growth (%) Projections by Indication, 2023 to 2033

Figure 94: Eastern Europe Market Value (US$ Million) Analysis by End User, 2018 to 2033

Figure 95: Eastern Europe Market Value Share (%) and BPS Analysis by End User, 2023 to 2033

Figure 96: Eastern Europe Market Y-o-Y Growth (%) Projections by End User, 2023 to 2033

Figure 97: Eastern Europe Market Attractiveness by Test Type, 2023 to 2033

Figure 98: Eastern Europe Market Attractiveness by Indication, 2023 to 2033

Figure 99: Eastern Europe Market Attractiveness by End User, 2023 to 2033

Figure 100: Eastern Europe Market Attractiveness by Country, 2023 to 2033

Figure 101: South Asia and Pacific Market Value (US$ Million) by Test Type, 2023 to 2033

Figure 102: South Asia and Pacific Market Value (US$ Million) by Indication, 2023 to 2033

Figure 103: South Asia and Pacific Market Value (US$ Million) by End User, 2023 to 2033

Figure 104: South Asia and Pacific Market Value (US$ Million) by Country, 2023 to 2033

Figure 105: South Asia and Pacific Market Value (US$ Million) Analysis by Country, 2018 to 2033

Figure 106: South Asia and Pacific Market Value Share (%) and BPS Analysis by Country, 2023 to 2033

Figure 107: South Asia and Pacific Market Y-o-Y Growth (%) Projections by Country, 2023 to 2033

Figure 108: South Asia and Pacific Market Value (US$ Million) Analysis by Test Type, 2018 to 2033

Figure 109: South Asia and Pacific Market Value Share (%) and BPS Analysis by Test Type, 2023 to 2033

Figure 110: South Asia and Pacific Market Y-o-Y Growth (%) Projections by Test Type, 2023 to 2033

Figure 111: South Asia and Pacific Market Value (US$ Million) Analysis by Indication, 2018 to 2033

Figure 112: South Asia and Pacific Market Value Share (%) and BPS Analysis by Indication, 2023 to 2033

Figure 113: South Asia and Pacific Market Y-o-Y Growth (%) Projections by Indication, 2023 to 2033

Figure 114: South Asia and Pacific Market Value (US$ Million) Analysis by End User, 2018 to 2033

Figure 115: South Asia and Pacific Market Value Share (%) and BPS Analysis by End User, 2023 to 2033

Figure 116: South Asia and Pacific Market Y-o-Y Growth (%) Projections by End User, 2023 to 2033

Figure 117: South Asia and Pacific Market Attractiveness by Test Type, 2023 to 2033

Figure 118: South Asia and Pacific Market Attractiveness by Indication, 2023 to 2033

Figure 119: South Asia and Pacific Market Attractiveness by End User, 2023 to 2033

Figure 120: South Asia and Pacific Market Attractiveness by Country, 2023 to 2033

Figure 121: East Asia Market Value (US$ Million) by Test Type, 2023 to 2033

Figure 122: East Asia Market Value (US$ Million) by Indication, 2023 to 2033

Figure 123: East Asia Market Value (US$ Million) by End User, 2023 to 2033

Figure 124: East Asia Market Value (US$ Million) by Country, 2023 to 2033

Figure 125: East Asia Market Value (US$ Million) Analysis by Country, 2018 to 2033

Figure 126: East Asia Market Value Share (%) and BPS Analysis by Country, 2023 to 2033

Figure 127: East Asia Market Y-o-Y Growth (%) Projections by Country, 2023 to 2033

Figure 128: East Asia Market Value (US$ Million) Analysis by Test Type, 2018 to 2033

Figure 129: East Asia Market Value Share (%) and BPS Analysis by Test Type, 2023 to 2033

Figure 130: East Asia Market Y-o-Y Growth (%) Projections by Test Type, 2023 to 2033

Figure 131: East Asia Market Value (US$ Million) Analysis by Indication, 2018 to 2033

Figure 132: East Asia Market Value Share (%) and BPS Analysis by Indication, 2023 to 2033

Figure 133: East Asia Market Y-o-Y Growth (%) Projections by Indication, 2023 to 2033

Figure 134: East Asia Market Value (US$ Million) Analysis by End User, 2018 to 2033

Figure 135: East Asia Market Value Share (%) and BPS Analysis by End User, 2023 to 2033

Figure 136: East Asia Market Y-o-Y Growth (%) Projections by End User, 2023 to 2033

Figure 137: East Asia Market Attractiveness by Test Type, 2023 to 2033

Figure 138: East Asia Market Attractiveness by Indication, 2023 to 2033

Figure 139: East Asia Market Attractiveness by End User, 2023 to 2033

Figure 140: East Asia Market Attractiveness by Country, 2023 to 2033

Figure 141: Middle East and Africa Market Value (US$ Million) by Test Type, 2023 to 2033

Figure 142: Middle East and Africa Market Value (US$ Million) by Indication, 2023 to 2033

Figure 143: Middle East and Africa Market Value (US$ Million) by End User, 2023 to 2033

Figure 144: Middle East and Africa Market Value (US$ Million) by Country, 2023 to 2033

Figure 145: Middle East and Africa Market Value (US$ Million) Analysis by Country, 2018 to 2033

Figure 146: Middle East and Africa Market Value Share (%) and BPS Analysis by Country, 2023 to 2033

Figure 147: Middle East and Africa Market Y-o-Y Growth (%) Projections by Country, 2023 to 2033

Figure 148: Middle East and Africa Market Value (US$ Million) Analysis by Test Type, 2018 to 2033

Figure 149: Middle East and Africa Market Value Share (%) and BPS Analysis by Test Type, 2023 to 2033

Figure 150: Middle East and Africa Market Y-o-Y Growth (%) Projections by Test Type, 2023 to 2033

Figure 151: Middle East and Africa Market Value (US$ Million) Analysis by Indication, 2018 to 2033

Figure 152: Middle East and Africa Market Value Share (%) and BPS Analysis by Indication, 2023 to 2033

Figure 153: Middle East and Africa Market Y-o-Y Growth (%) Projections by Indication, 2023 to 2033

Figure 154: Middle East and Africa Market Value (US$ Million) Analysis by End User, 2018 to 2033

Figure 155: Middle East and Africa Market Value Share (%) and BPS Analysis by End User, 2023 to 2033

Figure 156: Middle East and Africa Market Y-o-Y Growth (%) Projections by End User, 2023 to 2033

Figure 157: Middle East and Africa Market Attractiveness by Test Type, 2023 to 2033

Figure 158: Middle East and Africa Market Attractiveness by Indication, 2023 to 2033

Figure 159: Middle East and Africa Market Attractiveness by End User, 2023 to 2033

Figure 160: Middle East and Africa Market Attractiveness by Country, 2023 to 2033

Recommendations

Healthcare

Cancer Tissue Diagnostics Market

Published : August 2023

Explore Healthcare Insights

View Reports

Cancer Diagnostics Market