The global Lung Cancer Therapeutics Market is projected to witness significant expansion, with its market size expected to rise from USD 41.8 billion in 2025 to USD 126.5 billion by 2035, exhibiting a robust CAGR of 11.7% during the forecast period. This growth is being driven by the increasing global prevalence of lung cancer, coupled with continuous advancements in treatment technologies, including immunotherapies and targeted drug delivery systems.
Though Bryan Hanson, CEO of Zimmer Biomet Holdings, Inc., in the company’s 2024 official press release, emphasized innovation in orthopedic solutions, his remarks-"Our focus remains on advancing orthopedic solutions that improve patient mobility and recovery times.
Suture anchors represent a critical component in achieving these outcomes through secure tissue fixation and surgical reliability,"-reflects a broader industry commitment to technological innovation and improved patient outcomes that are equally relevant to the oncology sector, including lung cancer therapeutics.
The rising incidence of lung cancer globally, driven by factors such as smoking, prolonged exposure to environmental pollutants, and hereditary risk factors, has intensified the demand for advanced therapeutic solutions. Targeted therapies and immunotherapies are gradually replacing conventional chemotherapy due to their superior efficacy and reduced side-effect profiles.
Additionally, the adoption of personalized medicine, supported by progress in genomic profiling, has enabled treatment customization according to individual patient biomarkers, substantially improving survival rates and overall patient care.
Pharmaceutical giants are significantly increasing their R&D investments in the development of next-generation drugs, such as checkpoint inhibitors and combination regimens. Furthermore, supportive governmental policies and elevated funding for oncology research have improved accessibility to novel therapies across major healthcare markets worldwide.
From a regional standpoint, North America remains the leading market, owing to its sophisticated healthcare systems and early adoption of advanced lung cancer therapies. On the other hand, the Asia Pacific region is poised for the fastest growth, fueled by increasing lung cancer prevalence, expanding healthcare infrastructure, and heightened patient awareness in populous countries like China and India.
Government efforts to widen insurance coverage and foster cancer care delivery systems further reinforce this growth. Overall, technological progress, rising cancer incidence, and escalating global healthcare investments are set to ensure the sustained expansion of the lung cancer therapeutics market over the next decade.
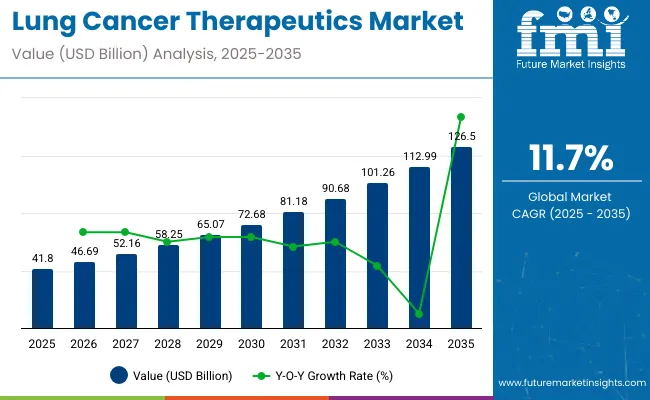
| Metric | Value (USD billion) |
|---|---|
| Market Size (2025E) | USD 41.8 billion |
| Market Value (2035F) | USD 126.5 billion |
| CAGR (2025 to 2035) | 11.7% |
Lung cancer remains one of the most prevalent and life-threatening forms of cancer globally, with its impact varying across regions. It ranks as the third most common cancer type, contributing to a significant share of new cancer diagnoses. Countries like the U.S., the UK, and India continue to witness high incidence and mortality rates, with gender-specific trends and lifestyle factors playing critical roles. The growing burden highlights the urgent need for enhanced early detection, treatment innovation, and public health awareness.
Leading pharmaceutical and biotech companies are integrating smart technologies such as artificial intelligence (AI), digital diagnostics, precision medicine, and real-world data analytics to advance lung cancer treatment and patient outcomes.
The lung cancer therapeutics market shows promising growth potential. From 2025 to 2035, the market is slated to grow variably. The first half of 2024 to 2034 expects a CAGR of 12.6%. The second half of this period projects a CAGR of 12.1%. This slight decrease indicates a steady fall in demand.
| Particular | Value CAGR |
|---|---|
| H1 | 12.6% (2024 to 2034) |
| H2 | 12.1% (2024 to 2034) |
| H1 | 11.7% (2025 to 2035) |
| H2 | 11.2% (2025 to 2035) |
In the next decade though, the first half maintains a steady CAGR of 11.7%. The second half of 2025 to 2035, however, sees a growth at a CAGR of 11.2%.
The lung cancer therapeutics market is being shaped by innovations in drug development and delivery methods. Targeted therapies remain dominant due to their precision and reduced side effects, while injectable continue to lead because of their rapid systemic action. Major pharmaceutical companies are focused on expanding their portfolios in these categories to meet the growing global demand for effective cancer treatments.
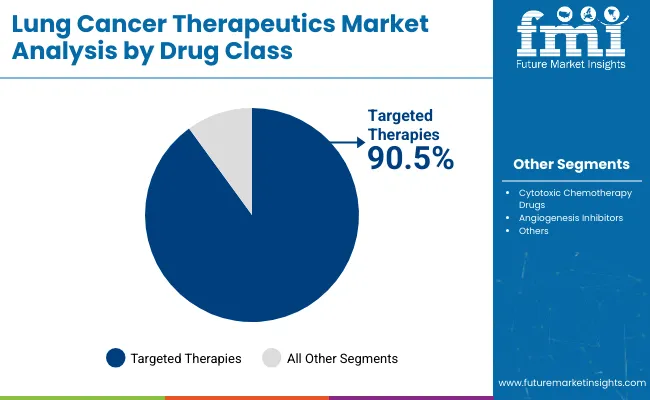
In the global lung cancer therapeutics market, targeted therapies are being prioritized for development and commercialization by leading pharmaceutical companies such as AstraZeneca, Roche, Pfizer, and Novartis. Approximately 90.5% of the market share in 2025 is expected to be held by this segment, owing to the increased reliance on precision medicine in oncology.
These therapies are being preferred because they focus on specific molecular targets responsible for cancer progression, thereby reducing damage to healthy tissues and minimizing side effects compared to conventional chemotherapies. This treatment approach is being widely adopted in cases of non-small cell lung cancer (NSCLC), where EGFR mutations and ALK rearrangements are common therapeutic targets.
Furthermore, regulatory approvals and expanded indications for drugs like Tagrisso and Alecensa are being granted, thus driving sales. The effectiveness of targeted therapies in extending survival rates and improving the quality of life has been recognized by healthcare providers globally. This has led to significant investment in R&D pipelines focused on biomarker-driven drug development. As such, targeted therapies are expected to remain the primary choice among oncologists and patients.
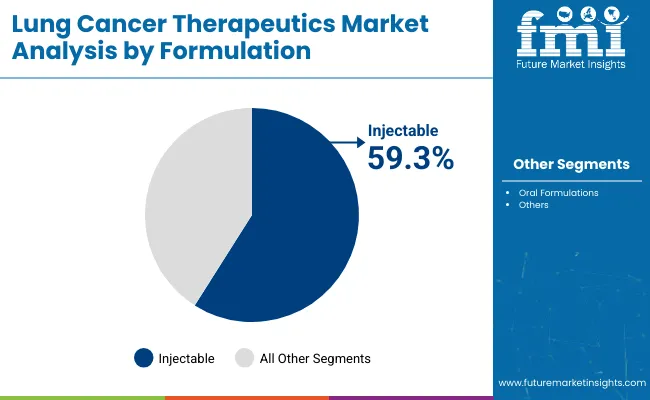
Injectable formulations are holding a major share of approximately 59.3% in the lung cancer therapeutics market by 2025, owing to their effectiveness in delivering therapeutic agents directly into the bloodstream, ensuring rapid and uniform distribution throughout the body.
The use of injectable is being favored in both hospital and outpatient settings for administering monoclonal antibodies, chemotherapies, and immune checkpoint inhibitors such as Keytruda (pembrolizumab) and Opdivo (nivolumab), which are commonly used for lung cancer treatment. Pharmaceutical giants like Merck & Co., Bristol Myers Squibb, and Genentech are developing and marketing injectable cancer therapies that have shown superior clinical outcomes.
These formulations are being designed to meet the specific needs of patients requiring systemic treatment for metastatic and advanced-stage cancers, where oral formulations may be less effective. The demand for injectables is further driven by the need for dose accuracy, controlled administration, and immediate therapeutic action. Additionally, advancements in formulation technology and the rise of biologics in cancer therapy are expected to reinforce the dominant position of injectable formats in the lung cancer therapeutics market globally.
New combination therapies in immuno-oncology are expanding treatment options for lung cancer. These therapies are especially beneficial for patients with advanced or metastatic disease. By combining immune checkpoint inhibitors with chemotherapy, radiotherapy, or targeted agents, more patients can access effective treatments. This approach may help those whose cancers did not respond to immunotherapies alone.
The rising smoking rates in low- and middle-income countries (LMICs) present significant opportunities for the lung cancer therapeutics market. In France, there are approximately 16.4 million tobacco users, ranking it third in the WHO European Region.
While smoking rates are declining in high-income countries like America, Japan, and France, LMICs continue to see an increase. As smoking prevalence rises, more lung cancer cases are expected, driving demand for both traditional chemotherapy and advanced immuno-oncology therapies.
Despite advancements in treatment options like targeted therapies and immunotherapy, early-stage diagnosis remains crucial. The lack of extensive screening programs hampers early detection efforts. Low-dose computed tomography (LDCT) has proven effective in identifying lung cancer at more treatable stages. However, without improved early detection strategies, the effectiveness of therapeutic agent remains constrained.
In 2020, the global market for lung cancer therapeutics was valued at USD 25.4 billion. The last decade witnessed a significant transformation in the lung cancer therapeutics market from conventional to more refined and directed methods. The earlier forms of therapy were mainly surgical and radiological interventions supplemented with chemotherapy.
Although most of these approaches were efficacious in certain situations, they were however very much limited in effectiveness, and severe adverse effects were experienced in patients, especially those with advanced stages of lung cancer.
Some of the adverse effects included fatigue, nausea, and respiratory complications. Additionally, treatments could lead to immune-related issues, including pneumonitis and severe allergic reactions, further complicating patient management.
Platinum-based chemotherapy marked a turning point in the treatment of lung cancer. Chemotherapy was the standard therapy a decade back; however, this therapy is generally not sufficient for reasons other than its high toxicity, given the only imitated survival benefit.
With technological advancements and focus on clinical research, healthcare providers have made therapy more effective and cost-efficient. Additionally, access to these therapies and positive outcomes has facilitated the scope of lung cancer therapeutics.
Furthermore, the most track-breaking advancement in lung cancer treatment in the last few years is immunotherapy, and immune checkpoint inhibitors- PD-1/PD-L1 inhibitors. Such treatments have proved their efficiency in several cases, particularly in cases where PD-L1 expression level is high. All these upgrades and launches in the healthcare domain prove the uptrend of these therapies in lung cancer treatment.
Tier 1 pharmaceutical companies like Roche, Bristol-Myers Squibb, and AstraZeneca are rapidly making strategic product launches and collaborations to gain a foothold in the market. For instance, Roche’s Atezolizumab and AstraZeneca’s Osimertinib have demonstrated incredible results in the management of advanced-stage lung malignancy.
Moreover, tier 1 players are also resorting to strategic partnerships and collaborative agreements to use their capabilities in new markets. One such merger has enabled Bristol-Myers Squibb to strengthen its oncology portfolio with the acquisition of Celgene.
Tier 2 companies including Hengrui Medicine, Cipla, and Zymeworks, are gaining ground in the lung cancer therapeutics market and working to increase their market shares. These healthcare providers are also targeting niche markets and providing cheaper substitutes for the therapies that already exist.
Camrelizumab, a novel immunotherapy, was introduced by Hengrui Medicine, highlighting its commitment to addressing unmet needs in lung cancer treatment. In addition, investment in the expansion of tier 2 companies has been through collaborations and partnerships; for instance, Cipla has formed strategic alliances for research focused on drug development.
The section summarizes the leading countries expanding in the global lung cancer therapeutics market. The table describes the CAGRs of specific countries and the data highlights key trends, projects, and company contributions to position the country in the global landscape. This data helps investors keenly observe and go through the recent trends and examine them in order.
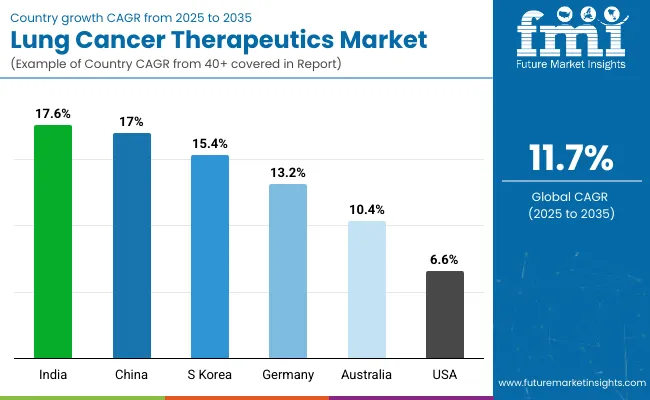
| Countries | CAGR 2025 to 2035 |
|---|---|
| India | 17.6% |
| China | 17.0% |
| South Korea | 15.4% |
| Germany | 13.2% |
| Australia | 10.4% |
| United States | 6.6% |
Leading players like Dr. Reddy’s Laboratories, Cipla, and Sun Pharmaceutical Industries are engaged in developing and marketing novel treatments and generics for lung cancer. For instance, Dr. Reddy has released its generic version of Erlotinib for non-small cell lung cancer.
At the same time, Cipla has widened its scope with the introduction of Nivolumab, which is also an immunotherapy drug. These players are capitalizing on cheap manufacturing costs in India to meet the treatment needs both in India and abroad.
Moreover, the rising demand for the lung cancer therapeutics market in India is the result of the development of clinical research and healthcare infrastructure. The number of clinical trials in the country has also increased with the help of institutions such as the Indian Council of Medical Research (ICMR) which supports research in the country.
This upsurge in the number of clinical trials is further assisted by technological aspects of the healthcare facilities enabling patients to seek out more advanced treatments.
The lung cancer therapeutics market in China is growing at an unprecedented pace, driven by a large pool of lung cancer patients and an equally strong pharmaceutical industry dedicated to developing innovative treatment options. Major players including Hengrui Medicine, Zhejiang Huahai Pharmaceutical, and Jiangsu Hengrui Medicine have made notable strides by launching targeted therapies and immunotherapies.
For instance, Hengrui launched Sunitinib, an advanced targeted agent for lung cancer, while Jiangsu Hengrui’s Camrelizumab serves as an additional immune therapy. Such launches are much awaited in any country with lung cancer epidemic given the prevalence of smoking and environmental ozone.
In addition, attention was drawn to the importance of conducting cancer research, which explains why there are a lot of studies conducted on new therapies and precision medicine. This growth is reinforced by the National Natural Science Foundation which supports the development of innovative cancer treatments.
The lung cancer therapeutics market in Germany is expanding rapidly due to the flourishing pharmaceutical market and emphasis on research and development.
Additionally, investments by Germany in technological upgrades in lung cancer treatment in precision medicine and biomarker research enable researchers and health providers to develop modern solutions. This subsequently led to the incorporation of deep learning and machine learning in the drug development processes, thereby increasing the scope of finding appropriate treatment options for the disease.
For instance, Boehringer Ingleheim registered Alectinib, a drug for ALK-positive non-small cell lung cancer. Likewise, Roche reported the properties of Atezolizumab, an anticancer drug, developed for lung cancer treatment.
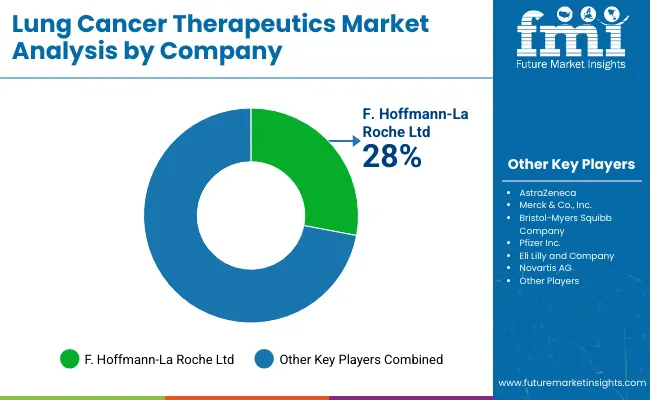
The lung cancer therapeutics is experiencing intense competition, driven by advancements in targeted therapies. Prominent healthcare providers are making efforts with innovative products and developing cost-efficient solutions. Additionally, companies must focus on strategic collaborations with research to enhance accessibility and maintain a competitive edge in this rapidly evolving landscape.
| Report Attributes | Details |
|---|---|
| Current Total Market Size (2025) | USD 41.8 billion |
| Projected Market Size (2035) | USD 126.5 billion |
| CAGR (2025 to 2035) | 11.7% |
| Base Year for Estimation | 2024 |
| Historical Period | 2020 to 2024 |
| Projections Period | 2025 to 2035 |
| Quantitative Units | USD billion for value and million units for volume (where applicable) |
| Drug Class Segments Analyzed (Segment 1) | Cytotoxic Chemotherapy Drugs (Platinum-Based Chemotherapy, Taxanes, Antimetabolites, Others), Targeted Therapies (EGFR Inhibitors, Tyrosine Kinase Inhibitors, PD-1/PD-L1 Inhibitors, BRAF Inhibitors, KRAS Inhibitors, Others), Angiogenesis Inhibitors (Bevacizumab, Ramucirumab) |
| Formulation Segments Analyzed (Segment 2) | Injectable (Premixed Infusion Solution for IV Infusion, Sterile Solution for IV Injection, Lyophilized Powder for Reconstitution for IV Infusion), Oral (Tablets, Capsules) |
| Molecule Type Segments (Segment 3) | Small Molecule, Large Molecule |
| Cancer Type Segments Analyzed (Segment 4) | Non-Small Cell Lung Cancer (NSCLC), Small Cell Lung Cancer (SCLC) |
| Distribution Channel Segments (Segment 5) | Institutional Sales (Hospitals and Specialty Centers, Cancer Research Centers, Government and Non-Government Organizations), Retail Sales (Retail Pharmacies, Specialty Pharmacies) |
| Regions Covered | North America; Latin America; Western Europe; Eastern Europe; South Asia and Pacific; East Asia; Middle East and Africa |
| Countries Covered | United States, Canada, Mexico, Brazil, Argentina, Germany, France, United Kingdom, Italy, Spain, Netherlands, China, India, Japan, South Korea, Australia & New Zealand (ANZ), GCC countries, South Africa |
| Key Players influencing the Lung Cancer Therapeutics Market | AstraZeneca, F. Hoffmann-La Roche Ltd, Merck & Co., Inc., Bristol-Myers Squibb Company, Pfizer Inc., Eli Lilly and Company, Novartis AG, Takeda Pharmaceutical Company Limited, Boehringer Ingelheim International GmbH, Amgen Inc., Regeneron Pharmaceuticals Inc., Dr. Reddy’s Laboratories Ltd., Fresenius Kabi AG, Viatris Inc., Johnson & Johnson Services, Inc. |
| Additional Attributes | Dollar sales by drug class and formulation, Trends in NSCLC and SCLC treatment uptake, Preference for immunotherapy and targeted therapies, Impact of biosimilars, Emerging approvals and combination therapies, Strategic collaborations and licensing deals |
The lung cancer therapeutics market includes cytotoxic chemotherapy drugs, targeted therapies, and angiogenesis inhibitors. Cytotoxic chemotherapy drugs are classified as platinum-based chemotherapy, taxanes, antimetabolites, and other chemotherapy agents. Targeted therapies include EGFR inhibitors. tyrosine kinases inhibitors, PD-1 or PD-L1 inhibitors, BRAF inhibitors, KRAS inhibitors, and other targeted therapies. Angiogenesis inhibitors are divided into bevacizumab and ramuciraumab.
The segment is classified into injectable and oral formulations. Injectables are trifurcated into premixed infusion solution for intravenous infusion, sterile solution for intravenous injection, and lyophilized powder for reconstitution for intravenous infusion. Oral formulation is categorized into tablets and capsules.
Small and large molecules are included in this category.
The market is divided into non-small cell lung cancer (NSCLC) and small cell lung cancer (SCLC).
Institutional and retail sales are two distribution channels of this segment. Institutional sales are classified into hospitals and specialty centers, cancer research centers, and government and non-government organizations. Retail sales are divided into retail and specialty pharmacies.
Information about the leading countries of North America, Latin America, Western Europe, South Asia and Pacific, East Asia, and the Middle East and Africa is given.
It is anticipated to reach USD 41.8 billion in 2025.
The market is set to rise at a 11.7% CAGR through 2035.
The landscape is forecasted to reach USD 126.5 billion by 2035.
Targeted therapies are the most popular product type with a share value of 89.8%.
AstraZeneca, F. Hoffmann-La Roche Ltd, Merck & Co., Inc., Bristol-Myers Squibb Company, Pfizer Inc. and Novartis AG are a few key companies.


Our Research Products

The "Full Research Suite" delivers actionable market intel, deep dives on markets or technologies, so clients act faster, cut risk, and unlock growth.

The Leaderboard benchmarks and ranks top vendors, classifying them as Established Leaders, Leading Challengers, or Disruptors & Challengers.

Locates where complements amplify value and substitutes erode it, forecasting net impact by horizon

We deliver granular, decision-grade intel: market sizing, 5-year forecasts, pricing, adoption, usage, revenue, and operational KPIs—plus competitor tracking, regulation, and value chains—across 60 countries broadly.

Spot the shifts before they hit your P&L. We track inflection points, adoption curves, pricing moves, and ecosystem plays to show where demand is heading, why it is changing, and what to do next across high-growth markets and disruptive tech

Real-time reads of user behavior. We track shifting priorities, perceptions of today’s and next-gen services, and provider experience, then pace how fast tech moves from trial to adoption, blending buyer, consumer, and channel inputs with social signals (#WhySwitch, #UX).

Partner with our analyst team to build a custom report designed around your business priorities. From analysing market trends to assessing competitors or crafting bespoke datasets, we tailor insights to your needs.
Supplier Intelligence
Discovery & Profiling
Capacity & Footprint
Performance & Risk
Compliance & Governance
Commercial Readiness
Who Supplies Whom
Scorecards & Shortlists
Playbooks & Docs
Category Intelligence
Definition & Scope
Demand & Use Cases
Cost Drivers
Market Structure
Supply Chain Map
Trade & Policy
Operating Norms
Deliverables
Buyer Intelligence
Account Basics
Spend & Scope
Procurement Model
Vendor Requirements
Terms & Policies
Entry Strategy
Pain Points & Triggers
Outputs
Pricing Analysis
Benchmarks
Trends
Should-Cost
Indexation
Landed Cost
Commercial Terms
Deliverables
Brand Analysis
Positioning & Value Prop
Share & Presence
Customer Evidence
Go-to-Market
Digital & Reputation
Compliance & Trust
KPIs & Gaps
Outputs
Full Research Suite comprises of:
Market outlook & trends analysis
Interviews & case studies
Strategic recommendations
Vendor profiles & capabilities analysis
5-year forecasts
8 regions and 60+ country-level data splits
Market segment data splits
12 months of continuous data updates
DELIVERED AS:
PDF EXCEL ONLINE
Lung Cancer Diagnostics Market Size and Share Forecast Outlook 2025 to 2035
Lung Cancer Surgery Market - Size, Share, and Forecast 2025 to 2035
Lung Cancer PCR Panel Market Trends, Growth, Demand & Forecast 2025 to 2035
The lung disease therapeutics market is segmented by disease type, treatment type and distribution channel from 2025 to 2035
Pet Cancer Therapeutics Market Insights - Growth & Forecast 2024 to 2034
Small Cell Lung Cancer (SCLC) Treatment Market Size and Share Forecast Outlook 2025 to 2035
Early-Stage Lung Cancer Diagnostics Therapy Market Size and Share Forecast Outlook 2025 to 2035
Non-Small Cell Lung Cancer Market Size and Share Forecast Outlook 2025 to 2035
Head and Neck Cancer (HNC) Therapeutics Market - Growth & Drug Developments 2025 to 2035
PD1 Non-Small Cell Lung Cancer Treatment Market - Growth & Outlook 2025 to 2035
Differentiated Thyroid Cancer Therapeutics Market
Cancer Registry Software Market Size and Share Forecast Outlook 2025 to 2035
Cancer Biological Therapy Market Size and Share Forecast Outlook 2025 to 2035
Cancer Diagnostics Market Analysis - Size, Share and Forecast 2025 to 2035
Lung Biopsy Systems Market Size and Share Forecast Outlook 2025 to 2035
Cancer Biopsy Market - Growth & Technological Innovations 2025 to 2035
Cancer Vaccines Market Analysis by Technology, Treatment Method, Application and Region from 2025 to 2035
Cancer Gene Therapy Market Overview – Trends & Future Outlook 2024-2034
Cancer-focused Genetic Testing Service Market Analysis – Growth & Industry Insights 2024-2034
Cancer Tissue Diagnostic Market Trends – Growth & Industry Forecast 2024-2034

Thank you!
You will receive an email from our Business Development Manager. Please be sure to check your SPAM/JUNK folder too.
Chat With
MaRIA