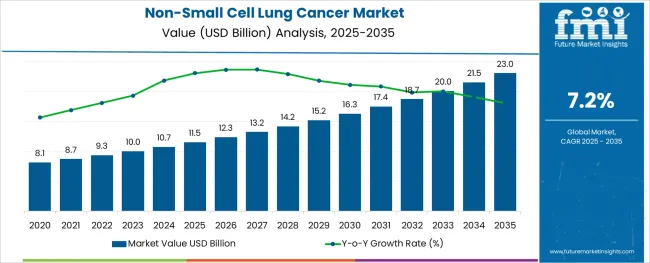
The Non-Small Cell Lung Cancer Market is estimated to be valued at USD 11.5 billion in 2025 and is projected to reach USD 23.0 billion by 2035, registering a compound annual growth rate (CAGR) of 7.2% over the forecast period.
The non-small cell lung cancer market is undergoing significant transformation, driven by advancements in diagnostics, evolving treatment protocols, and rising awareness about early detection. The increasing incidence of lung cancer, combined with improved healthcare infrastructure and access to innovative therapies, is contributing to expanded patient pools and enhanced survival outcomes.
Healthcare providers are prioritizing personalized medicine approaches, tailoring treatments based on genetic and molecular profiling, which is fostering the adoption of targeted therapies and immunotherapy alongside conventional regimens. Future growth is anticipated to benefit from continuous research and development investments, introduction of minimally invasive interventions, and greater integration of real-world evidence in clinical decision-making.
Strategic collaborations between pharmaceutical companies, research institutions, and healthcare providers are paving the way for novel therapeutics and better patient management, supporting long-term market expansion.
The market is segmented by Cancer Type and Treatment and region. By Cancer Type, the market is divided into Adenocarcinoma, Squamous Cell Carcinoma, and Large-cell Carcinoma. In terms of Treatment, the market is classified into Chemotherapy, Targeted Therapy, Immunotherapy, and Others - Surgery & Radiation Therapy. Regionally, the market is classified into North America, Latin America, Western Europe, Eastern Europe, Balkan & Baltic Countries, Russia & Belarus, Central Asia, East Asia, South Asia & Pacific, and the Middle East & Africa.
Insights into the Adenocarcinoma Cancer Type Segment
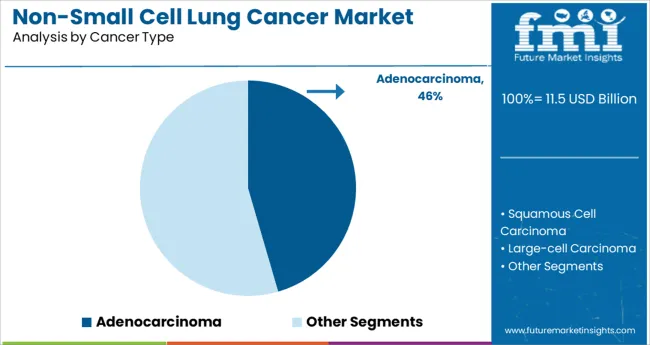
When segmented by cancer type, the adenocarcinoma subsegment is estimated to hold 45.5% of the total market revenue in 2025, maintaining its position as the leading cancer type. This leadership is being reinforced by the high prevalence of adenocarcinoma among diagnosed cases of non-small cell lung cancer, particularly in both smokers and non-smokers.
Clinical observations and treatment patterns indicate that its relatively slower progression and distinctive molecular characteristics have enabled wider application of targeted therapies and biomarker-driven treatments. Increased awareness and improved imaging techniques have facilitated earlier detection of adenocarcinoma, enabling more effective intervention and better outcomes.
Advances in precision medicine and the development of therapies addressing specific mutations commonly associated with adenocarcinoma have also strengthened its market share, positioning it as the predominant subtype demanding significant clinical and commercial focus.
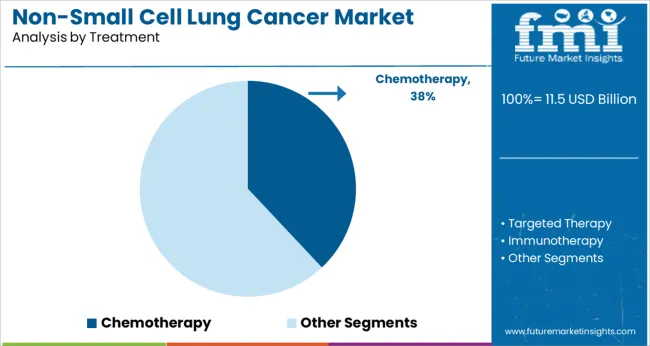
In terms of treatment, the chemotherapy subsegment is projected to account for 38.0% of the market revenue in 2025, sustaining its prominence despite the emergence of newer modalities. This dominance is being attributed to its established role as the cornerstone of first-line and palliative treatment in a broad range of patients.
The widespread availability, lower cost compared to novel targeted therapies, and proven efficacy in controlling disease progression have contributed to its continued use across diverse healthcare settings. Furthermore, chemotherapy remains an indispensable option for patients who are not candidates for targeted or immunotherapy due to the absence of actionable mutations or contraindications.
Its integration into combination regimens with other therapies has further enhanced its utility and sustained its position in clinical practice. As such, chemotherapy continues to occupy a central role in treatment algorithms, particularly in resource-constrained environments where access to innovative therapies remains limited.
The global demand for non-small cell lung cancer treatment is projected to increase at a CAGR of 7.2% during the forecast period between 2025 and 2035, reaching a total of USD 23 Billion in 2035, according to a report from Future Market Insights (FMI). From 2020 to 2024, sales witnessed significant growth, registering a CAGR of 6%.
During the projected period, the worldwide non-small cell lung cancer market is predicted to grow significantly. Increasing occurrences of lung cancer owing to smoking, air pollution (asbestos, cadmium, and radon), HIV infection, and population expansion are a few of the market's growth factors.
In the anticipated time, North America is expected to have the greatest market share, followed by Europe. Because of rising smoking rates in emerging nations, the Asia Pacific region is expected to be a substantial contributor to the NSCLC market.
Growing Environmental Pollution to Improve Market Maintenance and Performance
The rise in NSCLC incidence, which now accounts for about 85% of all lung cancer cases worldwide, is related to an increase in long-term cigarette use. Cigarette smoke, which contains at least 73 known carcinogens, is expected to cause an upsurge in cancer cases in the near future.
The growth in environmental pollution is a serious issue that requires stronger regulations to address. However, high levels of pollution have been related to an increase in cancer diagnoses in those who have been exposed to it for a longer period of time. Cancer detection has improved, making the delivery of lung cancer treatments such as chemotherapy and surgery simpler than ever before, improving the NSCLC treatment market share's advancement over the projection period.
Reimbursements and Expanding Medical Insurance to Accelerate Market Growth
Several insurance companies expansion and inclusion of cancer-related treatment and care are expected to boost the NSCLC treatments business throughout the forecast period. The growing pace of substantial research efforts aimed at examining various cancer kinds, with NSCLC being a key emphasis, may provide appealing options in the future.
Increased governmental and private sector support for funding for improved patient care, effective treatment, and the use of new diagnostic tools will provide significant possibilities for active players.
Strict High Standards for Any New Treatment to Hamper Market Growth
Treatment for NSCLC must be licensed by regulatory agencies with stringent criteria and testing techniques, which may limit market development. GSK states that both arms of its phase 2/3 non-small cell lung cancer (NSCLC) clinical study had passed the parameters for progressing to the next stage of the inquiry, a step toward potentially validatory results.
GSK's anti-TIM-3 antibody is going onto a pivotal trial following favorable findings in the mid-stage of the research, consolidating Big Pharma's position as the leader in a smaller field that also includes Novartis.
The dearth of Lung Transplant Organs to Stymie Market Growth
The lower life expectancy of patients undergoing NSCLC therapy, which is limited by the lack of lung organ transplants, is expected to diminish growth potential throughout the projected period.
Existence of Fewer Onerous Regulatory Clearance Processes and a Big Patient Pool Widening Profit Margins
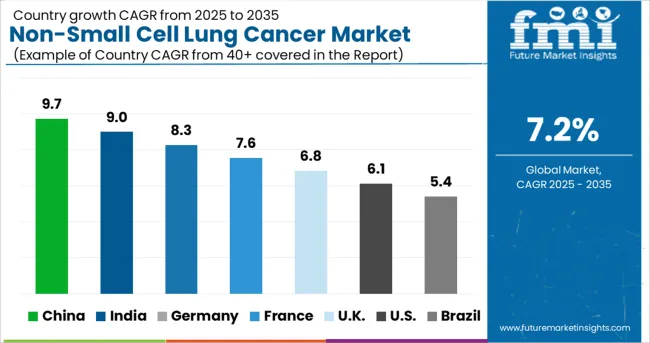
In 2025, Asia Pacific was the fastest-growing region for the NSCLC market. This was mostly owing to the existence of less onerous regulatory clearance processes and a big patient pool. Because of the availability of modern pharmaceuticals, a developed economy, and a huge patient pool, Japan and China contributed the most to the Asia Pacific region.
This development is expected to be led by national markets in China, South Korea, Japan, and Kazakhstan. As per Future Market Insights, the Asia Pacific is expected to grow at a CAGR of 6.7% during the assessment period 2025 to 2035.
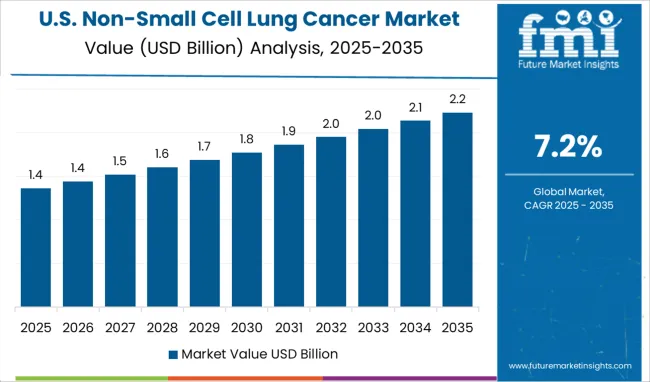
The arrival of Newer Medication and Strong Investment by Companies to Fuel Market Growth
North America is projected to retain its dominance and will be one of the most profitable areas for the NSCLC market over the forecast period. This is due to the arrival of newer medications, strong investment by companies, acceptance of expensive drugs, and increasing government financing for Research and Development operations.
NSCLC is the leading cause of death among the many forms of cancer. Even with advances in therapy, NSCLC is still frequently identified after it has progressed, despite advances in screening. North America is expected to grow at a CAGR of 7.1% during the assessment period 2025 to 2035.
The Chemotherapy Segment to be the Most Preferred Treatment Type
On the basis of treatment type, the market is segmented into Chemotherapy, Targeted Therapy, and Immunotherapy. During the projection period, the chemotherapy segment is expected to dominate the bulk of the treatment-based segment.
Key start-up players in the Non-Small Cell Lung Cancer are offering new and innovative product lines to consolidate their market presence, these aforementioned start-ups have left no stone unturned. Some specific instances of key Non-Small Cell Lung Cancer start-ups are as follows:
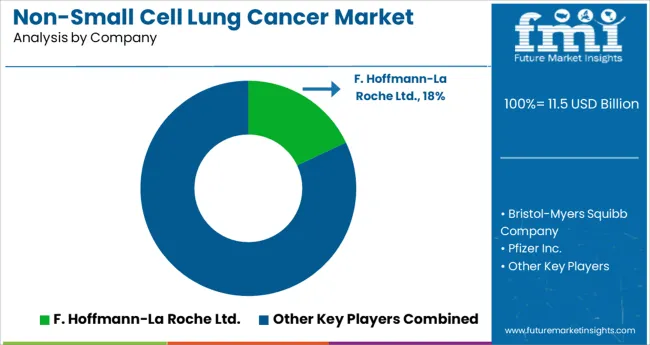
The primary strategies followed by the players include collaborations and acquisitions of well-established firms, the creation of novel medications, and broadening the indications for current treatments. Key players in the Non-Small Cell Lung Cancer market are Novartis Pharmaceuticals, Merck KGaA, Eli Lilly and Company, Hoffmann-La Roche, Xcovery, BeyondSpring Pharmaceuticals, OSE Immunotherapeutics, Sanofi, Takeda, AbbVie.
Recent Developments:
| Report Attribute | Details |
|---|---|
| Market Value in 2025 | USD 11.5 billion |
| Market Value in 2035 | USD 23.0 billion |
| Growth Rate | CAGR of 7.2% from 2025 to 2035 |
| Base Year for Estimation | 2025 |
| Historical Data | 2020 to 2025 |
| Forecast Period | 2025 to 2035 |
| Quantitative Units | Revenue in billion and CAGR from 2025 to 2035 |
| Report Coverage | Revenue Forecast, Company Ranking, Competitive Landscape, Growth Factors, Trends, and Pricing Analysis |
| Segments Covered | Cancer Type, Treatment, Region |
| Regions Covered | North America; Latin America; Europe; Asia Pacific; Middle East & Africa |
| Key Countries Profiled | USA, Canada, Brazil, Mexico, Germany, UK, France, Spain, Italy, China, Japan, South Korea, Singapore, Thailand, Indonesia, Australia, New Zealand, GCC Countries, South Africa, Israel |
| Key Companies Profiled | F. Hoffmann-La Roche Ltd.; Bristol-Myers Squibb Company; Pfizer Inc.; AstraZeneca; Novartis AG; Eli Lilly and Company; Merck & Co., Inc.; Boehringer Ingelheim International GmbH; Sanofi; Astellas Pharma Inc. |
| Customization | Available Upon Request |
The global non-small cell lung cancer market is estimated to be valued at USD 11.5 billion in 2025.
It is projected to reach USD 23.0 billion by 2035.
The market is expected to grow at a 7.2% CAGR between 2025 and 2035.
The key product types are adenocarcinoma, squamous cell carcinoma and large-cell carcinoma.
chemotherapy segment is expected to dominate with a 38.0% industry share in 2025.


Our Research Products

The "Full Research Suite" delivers actionable market intel, deep dives on markets or technologies, so clients act faster, cut risk, and unlock growth.

The Leaderboard benchmarks and ranks top vendors, classifying them as Established Leaders, Leading Challengers, or Disruptors & Challengers.

Locates where complements amplify value and substitutes erode it, forecasting net impact by horizon

We deliver granular, decision-grade intel: market sizing, 5-year forecasts, pricing, adoption, usage, revenue, and operational KPIs—plus competitor tracking, regulation, and value chains—across 60 countries broadly.

Spot the shifts before they hit your P&L. We track inflection points, adoption curves, pricing moves, and ecosystem plays to show where demand is heading, why it is changing, and what to do next across high-growth markets and disruptive tech

Real-time reads of user behavior. We track shifting priorities, perceptions of today’s and next-gen services, and provider experience, then pace how fast tech moves from trial to adoption, blending buyer, consumer, and channel inputs with social signals (#WhySwitch, #UX).

Partner with our analyst team to build a custom report designed around your business priorities. From analysing market trends to assessing competitors or crafting bespoke datasets, we tailor insights to your needs.
Supplier Intelligence
Discovery & Profiling
Capacity & Footprint
Performance & Risk
Compliance & Governance
Commercial Readiness
Who Supplies Whom
Scorecards & Shortlists
Playbooks & Docs
Category Intelligence
Definition & Scope
Demand & Use Cases
Cost Drivers
Market Structure
Supply Chain Map
Trade & Policy
Operating Norms
Deliverables
Buyer Intelligence
Account Basics
Spend & Scope
Procurement Model
Vendor Requirements
Terms & Policies
Entry Strategy
Pain Points & Triggers
Outputs
Pricing Analysis
Benchmarks
Trends
Should-Cost
Indexation
Landed Cost
Commercial Terms
Deliverables
Brand Analysis
Positioning & Value Prop
Share & Presence
Customer Evidence
Go-to-Market
Digital & Reputation
Compliance & Trust
KPIs & Gaps
Outputs
Full Research Suite comprises of:
Market outlook & trends analysis
Interviews & case studies
Strategic recommendations
Vendor profiles & capabilities analysis
5-year forecasts
8 regions and 60+ country-level data splits
Market segment data splits
12 months of continuous data updates
DELIVERED AS:
PDF EXCEL ONLINE
PD1 Non-Small Cell Lung Cancer Treatment Market - Growth & Outlook 2025 to 2035
Non-Small Cell Lung Carcinoma (NSCLC) Market Size and Share Forecast Outlook 2025 to 2035
Cellulose Diacetate Film Market Size and Share Forecast Outlook 2025 to 2035
Cellulose Fiber Market Forecast and Outlook 2025 to 2035
Cellulite Treatment Market Size and Share Forecast Outlook 2025 to 2035
Cellulose Derivative Market Size and Share Forecast Outlook 2025 to 2035
Cellulose Film Packaging Market Size and Share Forecast Outlook 2025 to 2035
Cell Therapy Systems Market Size and Share Forecast Outlook 2025 to 2035
Cellular IoT Market Size and Share Forecast Outlook 2025 to 2035
Cell Isolation Market Size and Share Forecast Outlook 2025 to 2035
Cellulose Ether and Derivatives Market Size and Share Forecast Outlook 2025 to 2035
Cellular Push-to-talk Market Size and Share Forecast Outlook 2025 to 2035
Cell Culture Waste Aspirator Market Size and Share Forecast Outlook 2025 to 2035
Cell Culture Media Market Size and Share Forecast Outlook 2025 to 2035
Cellulosic Polymers Market Size and Share Forecast Outlook 2025 to 2035
Cellbag Bioreactor Chambers Market Size and Share Forecast Outlook 2025 to 2035
Cell Surface Markers Detection Market Size and Share Forecast Outlook 2025 to 2035
Cellular Modem Market Size and Share Forecast Outlook 2025 to 2035
Cellulite Reduction Treatments Market Size and Share Forecast Outlook 2025 to 2035
Cell Culture Supplements Market Size and Share Forecast Outlook 2025 to 2035

Thank you!
You will receive an email from our Business Development Manager. Please be sure to check your SPAM/JUNK folder too.
Chat With
MaRIA