Reports

- Global Locations -

Headquarters

Future Market Insights, Inc.

Christiana Corporate, 200
Continental Drive, Suite 401,
Newark, Delaware - 19713,
United States

T: +1-845-579-5705

Americas

Future Market Insights, Inc.

616 Corporate Way, Suite 2-9018,
Valley Cottage, NY 10989, United States

T: +1-347-918-3531

MEA

Future Market Insights

1602-6 Jumeirah Bay X2 Tower, Plot No: JLT-PH2-X2A,
Jumeirah Lakes Towers, Dubai,
United Arab Emirates

Europe

Future Market Insights

3rd Floor, 207 Regent Street,
W1B 3HH London
United Kingdom

T: + 44 (0) 20 8123 9659
D: +44 (0) 20 3287 4268

Asia Pacific

Future Market Insights

IndiaLand Global Tech Park, Unit UG-1, Behind Grand HighStreet, Phase 1, Hinjawadi, MH, Pune – 411057, India

Allergy Immunotherapy Market Outlook

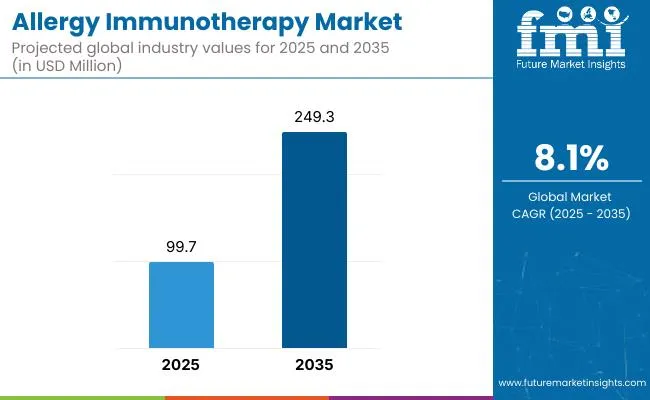
FMI estimates that the global allergy immunotherapy market could reach US$ 1.74 billion in 2023. Booming at a CAGR of 8.9% from 2023 to 2033, the market is likely to surpass US$ 4.07 billion by 2033.

The immunotherapy treatment market has gained significant attention recently due to its innovative approach to fighting cancer. However, it is important to note that a growing allergy immunotherapy market utilizes similar immunotherapy principles to treat allergies.

While allergy immunotherapy is distinct from cancer-focused immunotherapy treatment, the two have certain similarities. Both rely on the immune system to fight disease and involve biologics to stimulate an immune response. Additionally, the success of cancer immunotherapies has spurred interest in applying similar approaches to other disease areas, including allergies.

The allergy immunotherapy market is a rapidly growing sector of the healthcare industry, driven by a wide range of factors shaping the current landscape. Key drivers include the increasing prevalence of allergies, advancements in biotechnology and immunology, and rising demand for personalized medicine.

Allergy immunotherapy is a treatment to prevent allergic reactions caused by food, grass pollen, dust, and bee venom, among other causes. Allergy immunotherapy aids in controlling symptoms among people suffering from allergies such as rhinitis, asthma, and conjunctivitis, among other common allergies.

Allergy immunotherapy involves injections regularly that generally increase the dosage to develop resistance in the patient. With a progressive increase in dosage, the patient's immunity system becomes less fragile due to the increased production of blocking antibodies that fight the foreign substances that cause allergies.

Asthma is a key part of allergy because it is often triggered by allergic reactions and is closely linked to other allergic conditions. Therefore, the asthma allergy immunotherapy market is a sub-segment of the larger immunotherapy market, focused specifically on developing products for treating asthma and allergic conditions.

Shift toward more targeted and personalized treatment is a key trend in the market. The understanding of the molecular mechanisms underlying allergic reactions is growing. As a result, researchers and clinicians are developing more advanced and individualized therapies that can address each patient's specific needs. This trend also drives the development of biomarkers and diagnostic tools to help identify the underlying causes of allergies and guide treatment decisions.

Currently, there are three main types of allergy immunotherapy products in use: sublingual allergy immunotherapy (SLIT), subcutaneous allergy immunotherapy (SCIT)/injection, and oral allergy immunotherapy. Among these, SLIT offers treatment without injections instead of treating allergies with tablets.

Tablets used in the SLIT treatment treat allergies caused by ragweed, grass pollen, and dust mites and are approved by the United States Food and Drugs Administration (FDA). However, SLIT offers treatment for only one type of allergen and does not prevent curbing the possibility of developing other kinds of allergies.

This gives an edge to SCIT treatment, considered the highly effective form of allergy immunotherapy since it simultaneously prevents the development of asthma and other allergies. As people across the world grow highly sensitive to different types of allergies, the proliferating need for effective fighting methodologies is likely to drive the market on a positive growth trajectory.

Attributes Details
Allergy Immunotherapy Market Value (2023) US$ 1.74 billion
Global Market Absolute Dollar Growth (US$ million/billion) US$ 95.97 million
Allergy Immunotherapy Market Expected Value (2033) US$ 4.07 billion
Allergy Immunotherapy Market Projected CAGR (2023 to 2033) 8.9%

Don't pay for what you don't need

Customize your report by selecting specific countries or regions and save 30%!

2018 to 2022 Global Allergy Immunotherapy Market Outlook Compared to 2023 to 2033 Forecast

The allergy immunotherapy market is forecast to expand at a CAGR of 8.9% during 2023 and 2033 in comparison to a 2.5% CAGR registered from 2018 to 2022. The allergy shots (Immunotherapy) market dates back to the early 20th century when doctors began injecting small amounts of allergens to desensitize patients to their allergies. Since then, allergy immunotherapy has become a widely accepted and effective treatment option for many people with allergies.

In recent years, the market has experienced significant growth, driven by the increasing prevalence of allergies, the growing demand for personalized medicine, and the development of new and advanced allergy immunotherapy products. Additionally, the increasing adoption of sublingual immunotherapy (SLIT) contributes to market growth. It is a newer form of allergy immunotherapy that involves administering allergens under the tongue rather than by injection.

Overall, the historical outlook of the market has been positive, with steady growth in demand and innovation in treatment options. As a result, the market size was recorded at US$ 1.67 billion in 2022. The market is now going through a significant upswing, providing a wide range of prospects for companies working in the industry.

  • Short Term (2023 to 2026): The market is likely to experience steady growth during this period owing to the increasing prevalence of allergies and the rising demand for effective treatment options. Developing novel immunotherapeutic agents, such as sublingual tablets, oral drops, and other forms of allergy immunotherapy, could also contribute to market growth.
  • Medium Term (2026 to 2029): During this timeframe, the market is poised for significant expansion as new products and technologies enter the market. The introduction of advanced immunotherapy treatments, such as immunoglobulin E (IgE) inhibitors, biologics, and gene therapies, is likely to drive market growth.
  • Long Term (2029 to 2033): Looking further ahead, the long-term growth prospects for the market are strong, with increasing demand from patients, physicians, and healthcare systems for personalized and effective allergy treatments. Additionally, the growing interest in precision medicine and personalized healthcare is likely to drive the development of innovative immunotherapy solutions tailored to individual patient needs.

These factors are anticipated to support a 2.3X increase in the allergy immunotherapy market between 2023 and 2033. The market is projected to be worth US$ 4.07 billion by the end of 2033, according to FMI analysts.

Increasing Incidence of Allergies Calls for Efficient Treatments

The rising prevalence of allergies year-on-year worldwide is propelling demand for effectual allergy immunotherapy. For instance, allergic rhinitis is among the extremely common allergies in the world, affecting roughly 10% to 30% of the global population.

According to the estimates of the American Academy of Allergy Asthma & Immunology, nearly 7.8% of the American population aged above 18 develop allergic rhinitis.

Likewise, in 2012, over 17.6 million adults and 6.6 million children were reported to be diagnosed with rhinitis. The number grew to 20 million adults in 2015, thus creating demand for treatments that improve the lifestyle and offer relief from the effects of the allergy.

Along similar lines, other allergies, such as asthma, skin allergies, and food allergies, are also quite prevalent across the world and continue to drive demand for immunotherapy.

In 2016, the World Health Organization (WHO) estimated that over 339 people suffer from asthma globally and attributed more than 400,000 deaths to asthma in that year. By the same token, Food Allergy Research & Education (FARE) reported that over 32 million people in the United States suffer from food allergies, necessitating emergency medical care for one person every 3 minutes to seek.

Similarly, new research by the Journal of Allergy and Clinical Immunology (JACI) estimated that 2-37% of the European population has a self-reported food allergy. As people become increasingly aware of the availability of these treatments, an increasing number of people are willing to seek treatment, driving the allergy immunotherapy market on a remunerative path.

Sabyasachi Ghosh
Sabyasachi Ghosh

Principal Consultant

Talk to Analyst

Find your sweet spots for generating winning opportunities in this market.

High Demand for Advanced Procedures

The growing incidence of allergies and the subsequent spending on medical treatments are enabling market players to enhance their treatment offerings. Players are enhancing the existing SLIT drugs, which have proven efficient in treating airway allergies, atopic dermatitis, and a few food allergies.

Recent surveys have suggested that SLIT remains a popular choice among consumers over SCIT, despite its limitations, owing to its accessibility. Moreover, it has been noted that the prevalence of food allergy rises by 10% every year, leading to higher demand for immunotherapy for food allergies.

By the same token, oral immunotherapy is gaining prominence among medical professionals and patients, especially in the treatment of allergic rhinitis. Oral immunotherapy is primarily used to control the incidence of allergic reactions caused by accidental or unintentional allergen exposures for individuals with minimal levels of tolerance. On this premise, market players are focusing on improving their offerings on the oral immunotherapy front.

On the other hand, macroeconomic factors such as increasing levels of pollution, changing eating habits, and increased consumption of alcohol are resulting in an increased prevalence of skin and other allergies, further boosting the need for allergy immunotherapy.

Key Challenges: High Cost and Side Effects

Allergy immunotherapy is a longer process than conventional therapies, prolonging for 3 to 5 years based on the type and severity of the allergy. It is likely to instigate patients to discontinue halfway through the treatment, owing to financial constraints during the process. This is expected to pose a challenge to the growth of the market to an extent.

On these lines, it is to be noted that allergy immunotherapy is relatively more expensive than traditional medication therapies due to its lengthy nature. The annual cost of allergy treatment is around $1000, with oral therapy costing $4000, while SLIT goes beyond $7000. As a result, patients rely on healthcare insurance to cover their expenses. When not covered under insurance, those who cannot afford the treatment have no other option but to resort to temporary medication. The high cost of the treatment is limiting the adoption, thereby hindering overall growth.

On the other hand, the side effects of these treatments are expected to hold back growth. Approximately 1.5% of patients undergoing oral immunotherapy experience side effects such as respiratory, gastrointestinal, or skin-related disorders, thus further restraining the healthy growth of the market.

Get the data you need at a Fraction of the cost

Personalize your report by choosing insights you need
and save 40%!

Comparative Analysis of Adjacent Allergy Immunotherapy Market

Allergy Immunotherapy Market:

Differentiating Aspects Allergy Immunotherapy Market
CAGR (2023 to 2033) 8.9%
Market Valuation in 2023 US$ 1.74 billion
Projected Market Value in 2033 US$ 4.07 billion
Growth Factors Rising awareness about the benefits of allergy immunotherapy among patients and healthcare professionals
Opportunities Growing demand for self-administered allergy immunotherapy products
Key Trends Increasing adoption of sublingual immunotherapy over traditional allergy shots

Allergy Treatment Market:

Differentiating Aspects Allergy Treatment Market
CAGR (2023 to 2033) 6.9%
Market Valuation in 2023 US$ 21.59 billion
Projected Market Value in 2033 US$ 42.08 billion
Growth Factors Rising adoption of advanced allergy treatment options, such as immunotherapy and biologics
Opportunities Growing demand for over-the-counter allergy treatments including nasal sprays and eye drops
Key Trends Increasing use of telemedicine and digital healthcare solutions for allergy treatment

Allergy Care Market:

Differentiating Aspects Allergy Care Market
CAGR (2023 to 2033) 6.1%
Market Valuation in 2023 US$ 23.34 billion
Projected Market Value in 2033 US$ 42.20 billion
Growth Factors Expansion of healthcare infrastructure and rising healthcare expenditure in developing countries
Opportunities Government initiatives and policies to reduce the burden of allergic diseases
Key Trends Growing demand for personalized medicine and targeted allergy care solutions

Mapping the Allergy Immunotherapy Market: Country-wise Analysis Sheds Lights on Market Trends

Country Germany
CAGR % 2018 to 2022 1.5%
CAGR % 2023 to End of Forecast (2033) 9.7%
Market Size by End of Forecast Period (2033) US$ 243.7 million
Country United Kingdom
CAGR % 2018 to 2022 2.7%
CAGR % 2023 to End of Forecast (2033) 9.1%
Market Size by End of Forecast Period (2033) US$ 162.0 million
Country United States
CAGR % 2018 to 2022 2.6%
CAGR % 2023 to End of Forecast (2033) 9.1%
Market Size by End of Forecast Period (2033) US$ 203.1 million
Country Canada
CAGR % 2018 to 2022 3.0%
CAGR % 2023 to End of Forecast (2033) 9.3%
Market Size by End of Forecast Period (2033) US$ 48.2 million
Country China
CAGR % 2018 to 2022 2.9%
CAGR % 2023 to End of Forecast (2033) 8.8%
Market Size by End of Forecast Period (2033) US$ 55.6 million

Europe Allergy Immunotherapy Market Shifts Towards Patient-centered Care with Emphasis on Quality of Life

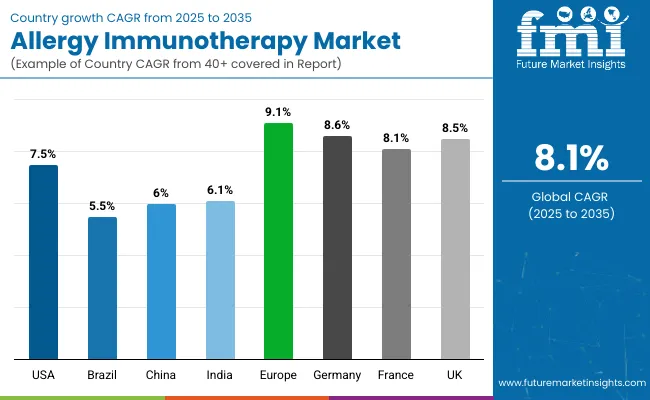
Europe is expected to remain the leading regional market for allergy immunotherapy during the assessment period, accounting for more than half of the global market value. The region's dominance is attributed to a wide population with various allergies. The European Academy of Allergy and Clinical Immunology (EAACI) reports that over 150 million people, representing 20% of the region's population, currently suffer from chronic food allergies.

Allergic rhinitis and asthma have been identified as extremely common allergies, affecting 100 million and 70 million people, respectively. Furthermore, the organization reported that by 2025, 50% of Europe's population could be affected by allergies, thus creating a lucrative growth opportunity for the allergy immunotherapy market.

The prevalence of allergies in Europe is also mounting into a huge economic burden due to consequential productivity losses in European nations. On the back of these factors, European governments and bodies, including EAACI, are working on raising awareness among people. They are calling for better medical education and treatments, thereby positively influencing the market's growth in the region.

The German allergy immunotherapy market is undergoing noteworthy growth. Germany's well-established healthcare infrastructure and high healthcare expenditure are contributing to market growth. Moreover, the country's robust regulatory framework and favorable reimbursement policies are driving the adoption of allergy immunotherapy treatments among patients.

Pharmaceutical companies operating in the German market are developing innovative immunotherapy solutions driving the market. For instance, Germany was the first country where ALK's innovative tree SLIT-tablet, ITULAZAX®, was introduced in 2019. Owing to the high prevalence of tree pollen allergies in northern Europe, Germany is a significant market for the product. In studies, ITULAZAX® showed therapeutic advantages all during the tree pollen season. An easy-to-take, once-daily SLIT tablet, ITULAZAX® is ideal for usage at home and is convenient. It is authorized for use in patients with moderate-to-severe allergic rhinitis and/or conjunctivitis caused by pollen and whose symptoms cannot be properly managed with symptom-relieving medicine.

The United Kingdom allergy immunotherapy market is experiencing significant growth in recent years. The market is growing primarily owing to the rising prevalence of allergies, especially asthma, rhinitis, and conjunctivitis. Around 20% of the population in the United Kingdom suffers from one or more allergy disorders, making it one of the nations with the top prevalence rates in the world. 20% of the population in the country suffers from allergy rhinitis (AR), one of the more prevalent issues. The rising prevalence of respiratory conditions, including allergies, COPD, and asthma, is one of the key factors driving market expansion.

Numerous factors, such as environmental pollution, lifestyle changes, and genetic predisposition, have contributed to the rising prevalence of allergies in the United Kingdom. The market is expected to continue its growth trajectory during the forecast period, driven by growing demand for personalized treatment options, advancements in medical technology, and a favorable regulatory environment.

The government has been evaluating the framework for allergy labeling in the wake of fatal situations involving food-related allergies. The aim is to provide customers in the country who suffer from food allergies more confidence in the products they consume. This has further fueled the market growth by creating a favorable environment for innovation and the development of new treatment options.

The availability of advanced diagnostic tools, such as skin prick tests and serum-specific immunoglobulin E (IgE) tests, is boosting the adoption of these treatments. Moreover, the favorable reimbursement policies for allergy immunotherapy treatments by the National Health Service (NHS) are making these therapies more accessible to patients.

Sublingual Immunotherapy Emerges as a Popular Treatment Option in North America Allergy Immunotherapy Market

Although North America holds a relatively lower share than Europe, it is likely to remain the second highly lucrative region through the assessment period. The US is poised to remain at the forefront of the North American market, accounting for the bulk of market value owing to the high prevalence of allergies in the region.

The American College of Allergy and Asthma (ACAAI) estimates that allergies are the sixth leading cause of chronic illness in the United States, affecting more than 50 million people and resulting in expenses worth more than US$ 18 billion every year.

Moreover, children are at a higher risk of allergies. According to the 2014 National Health Interview Survey (NHIS), 8.4% of children in the United States under age 18 suffered from allergic rhinitis, 10% from respiratory allergies, 5.4% from food allergies, and 11.6% from skin allergies. Due to the aforementioned facets, the demand for allergy immunotherapy could prevail high in the future.

The United States allergy immunotherapy market is witnessing significant growth, driven by the increasing incidences of allergies and the rising demand for advanced treatment options. For instance, according to a study from the International Food Information Council published in May 2022, about 32 million individuals in the United States have reported having food allergies. About 200,000 people visit the emergency department each year due to these allergies.

Food allergies in young people were also discovered to be prevalent. Approximately 40.0% of children with food allergies are allergic to more than one food, and one in every thirteen children in the United States has been diagnosed with a food allergy. This country's need for allergy immunotherapy is anticipated to increase speedily due to such situations.

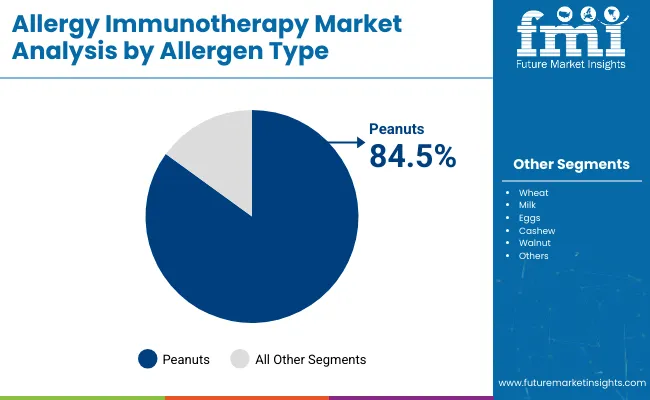
According to estimates from the Food and Drug Administration's Center for Biologics Evaluation and Research (FDA), one in five of the about one million children who are allergic to peanuts in the United States are likely to overcome their allergy. Immunotherapy, which can be administered by the patient and used as medicine in home healthcare settings, has demonstrated good and long-term effects in allergic individuals. As a result, immunotherapy has become a viable and safe alternative subcutaneous route for persistent and recurring allergies.

The adoption of subcutaneous immunotherapy (SCIT) and sublingual immunotherapy (SLIT) for treating allergies is on the rise in the United States. Additionally, the availability of customized allergy immunotherapy, such as cluster and mix therapy, is gaining traction among healthcare professionals and patients alike. These therapies offer improved efficacy and safety, leading to their increased adoption.

The increasing availability of advanced technologies, such as molecular diagnostics and genetic testing, further drives the market growth in the United States. These technologies help in accurate diagnosis and personalized treatment planning, improving patient outcomes.

The Canada allergy immunotherapy market is experiencing robust growth due to several factors. The increasing prevalence of allergies in Canada, particularly common allergens such as pollen, dust mites, and animal dander, has contributed to the market growth. According to the Canadian Allergy, Asthma, and Immunology Foundation, about 20% of People in Canada suffer from allergies, and the number is projected to continue rising.

Food Allergy Canada estimated that about three million citizens of Canada, representing 7.5% of the country's population, suffer from food allergies. As a result, the regulatory authorities of Canada are taking a proactive approach to develop and approving allergy immunotherapy products. For instance, Health Canada recently approved using sublingual immunotherapy tablets to treat grass pollen allergy. This has created a favorable regulatory environment, enabling pharmaceutical companies to bring new and innovative products.

Immunotherapy as a primary treatment option for allergies is gaining momentum in the country. Leading companies operating in the market are focusing on developing personalized treatment options that cater to the specific needs of individual patients. For instance, in 2016, Aralez Pharmaceuticals Inc. revealed the commercial release of Blexten in Canada for the management of long-term spontaneous urticarial and periodic allergic rhinitis.

Collaborative Efforts between Industry and Government Foster Innovation in East Asia Allergy Immunotherapy Market

East Asia is projected to remain a prominent region for the global allergy immunotherapy market, backed by a vast population base in China, Japan, and South Korea suffering from various kinds of allergies. Allergic rhinitis is one of the most common allergies in China and has significantly increased in the previous two decades.

Similarly, according to the Japanese Society of Pediatric Allergy and Clinical Immunology (JSPACI), oral immunotherapy is gaining tremendous traction in the region owing to its convenience, especially among patients suffering from allergic rhinitis. These factors are likely to continue to drive the market on a positive growth trajectory through the assessment period.

There is substantial evidence that the incidence of food allergies is rising in developing nations, with rates of food allergies reported in China comparable to those in Western nations. This has led to an increased demand for effective treatment options among the country’s vast population, which includes a significant proportion of young adults and children who suffer from allergies.

The strong focus of the government of China on healthcare and the expansion of the country’s healthcare infrastructure has contributed to the market growth. The government has increased investment in healthcare, including establishing specialized medical institutions and promoting research and development of innovative and effective allergy immunotherapy products.

Industry-government partnerships are also contributing to market growth. The government’s support has created a favorable environment for industry growth. This has led to significant advancements in research and development activities, new product launches, and increased investments in the market. Therefore, the China allergy immunotherapy market is poised for continued growth.

Allergy Immunotherapy Market: Understanding Market Dynamics through Segment-wise Analysis

Segment Product Type
Attributes SLIT Tablets
CAGR % 2018 to 2022 2.7%
CAGR % 2023 to End of Forecast(2033) 9.4%
Segment Distribution Channel
Attributes Institutional Sales
CAGR % 2018 to 2022 2.4%
CAGR % 2023 to End of Forecast(2033) 8.7%

SLIT Tablets Holds Lion's Share

The SLIT (Sublingual Immunotherapy) segment commands the key share owing to several factors. SLIT offers a convenient and safe alternative to traditional allergy shots. It also provides a non-invasive method of administering immunotherapy. Patients can self-administer SLIT at home, eliminating the need for frequent visits to the healthcare professional for injections.

SLIT has also demonstrated efficacy in reducing symptoms and improving the lives of patients with severe allergies. The treatment works by exposing patients to small doses of allergens, gradually building up their tolerance and reducing their sensitivity to the allergen over time. Additionally, SLIT has a favorable safety profile compared to traditional allergy shots, as it does not carry the risk of anaphylaxis or other severe reactions.

The growing prevalence of allergic disorders, coupled with the increasing demand for personalized treatment approaches, has fueled the growth of the SLIT market. The availability of a wide range of allergens and formulations in the SLIT segment has also contributed to its dominance in the market.

Institutional Sales Hold Dominance

By distribution channel, institutional sales are expected to channel the maximum revenue, due to high reliance on government and semi-government hospitals for treatments backed by their affordability. This is also attributed to the availability of reimbursements and supportive policies in government hospitals in developed economies. The dominance of the institutional sales segment of the market can also be attributed to several factors, including the established players with distribution networks, high barriers to entry, and regulatory requirements that favor institutional sales.

The institutional sales segment is able to leverage its expertise in managing complex logistical and regulatory challenges associated with the delivery of allergy immunotherapy products. This includes navigating complex supply chains, adhering to regulatory compliance standards, and maintaining high levels of product quality and safety.

This segment also benefits from greater bargaining power with payers and reimbursement agencies. This can result in more favorable pricing and reimbursement terms. This provides a competitive advantage over other segments of the market, particularly those that rely on retail or direct-to-consumer channels.

From Niche to Mainstream: The Promising Future of Allergy Immunotherapy Market’s Remaining Segments

Injection Remains Highly Sought-out

Based on the product type, the injection segment is poised to remain the highly sought product type, accounting for nearly 2/3rd of the market share through the forecast period. This is essentially attributed to higher effectiveness and quicker response to the medication.

Allergic Rhinitis Creates Huge Demand

Based on indication, allergic rhinitis is forecasted to capture more than 2/5h of global market value, one of the most common allergies worldwide. On the other hand, allergic asthma is expected to channel more than 1/5th of the market share, owing to the high prevalence among children.

Pollens and House Dust Mites Remain Extremely Common

Among allergens, pollens and house dust mites are expected to cumulatively account for more than 2/5th of the market share, holding a share of near-equal proportions. This is ascribed to the fact that they are highly common in living areas, thus easily affecting people across the world.

Allergy Immunotherapy Market Leaders Collaborate on Innovative Research to Develop Personalized Treatment Plans for Patients with Severe Allergies

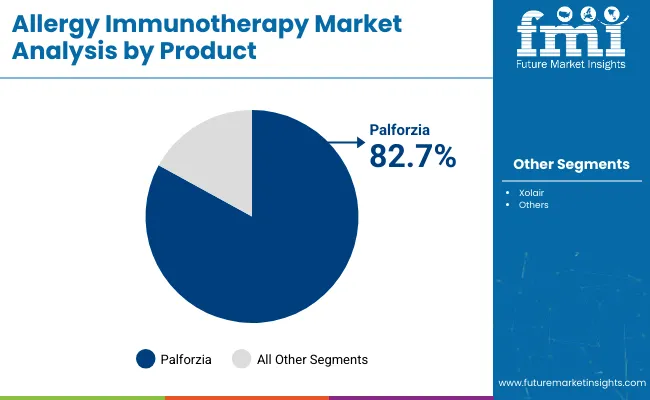
Market players are leveraging the growing prevalence of allergies and are directing their efforts toward developing treatments for food allergies, in specific. To achieve the same, they are investing in research and development activities. On these lines, Aimmune Therapeutics (Nestle Health Science) became the first organization to procure FDA approval for its drug, PALFORZIA, to treat food allergies after receiving approval in 2020.

Several organizations are focusing on developing new products - tablets, and injections to stay ahead of the curve. On this premise, in April 2020, ALK Abello announced that Health Canada had approved once-daily ITULATEK, a sublingual tablet, for the treatment of tree pollen allergy. In September 2021, ALK stated that by 2030, it aims to increase the number of patients by at least 100,000 per year in order to provide access to allergy diagnostics, immunotherapy treatments, and/or adrenaline products.

On the other hand, growing demand is compelling market players to expand their supply capacity, which has also been observed as a key trend. On this premise, In May 2020, Stallergenes Greer announced the expansion of the supply of subcutaneous products (SCIT) to cater to the growing demand. In June 2021, after the complete restart of SCIT manufacturing in Antony, Stallergenes Greer revealed that Alustal®, its subcutaneous allergen immunotherapy (SCIT) solution, is now accessible in Italy and Spain. In January 2022, with Imperial College London, Stallergenes Greer established a research partnership to strengthen the precision medicine approach in allergen immunotherapy and for the identification of biomarkers of AIT effectiveness.

Some of the leading players in the market are

  • ALK Abello
  • Stallergenes Greer
  • Allergy Therapeutics
  • Aimmune Therapeutics
  • Anergis
  • Arrayit Corporation
  • Biomay AG
  • HAL Allergy Group
  • DBV Technologies

Allergy Immunotherapy Market - Segmentation

Product:

  • SLIT Tablets
    • Odactra
    • Grastek
    • Ragwitek
    • Oralair
    • Actair
    • Others
  • Oral
    • Palforzia
    • Others
  • Injections
  • Others

Immunotherapy:

  • Sublingual Immunotherapy
  • Subcutaneous Immunotherapy
    • Specific Immunotherapy
  • Others

Indication:

  • Allergic Rhinitis
  • Allergic Asthma
  • Food Allergy
  • Atopic Dermatitis
  • Others

Allergen:

  • Pollens
    • Grass Pollens
    • Weed Pollens
    • Tree Pollens
  • House Dust Mites
  • Mold
  • Animal Dander
  • Bee Venom
  • Cockroaches/Insects
  • Others

Distribution Channel:

  • Institutional Sales
    • Government Hospitals
    • Semi-Government Hospitals
    • Private Hospitals
  • Retail Sales
    • Retail Pharmacy
    • Drug Stores
    • Online Pharmacy

Region:

  • North America
  • Latin America
  • Europe
  • South Asia
  • Oceania
  • East Asia
  • Middle East and Africa

Frequently Asked Questions

What is the projected CAGR of the Allergy Immunotherapy Market by 2033?

The projected CAGR of the Allergy Immunotherapy market by 2033 is 8.9%.

What is the projected Allergy Immunotherapy Market value for 2033?

The projected market value for 2033 is US$ 4.07 billion.

What is the Current Market Valuation of the Allergy Immunotherapy Market?

The market is estimated to secure a valuation of US$ 1.74 billion in 2023.

Which Region Holds a Significant Share of the Allergy Immunotherapy Market?

Europe holds a significant share of the Allergy Immunotherapy market.

Why is the European market growing remarkably fast in Allergy Immunotherapy Market?

The European market is growing remarkably fast in the market due to the increasing prevalence of allergies.

Table of Content

1. Executive Summary | Allergy Immunotherapy Market

    1.1. Global Market Outlook

    1.2. Demand-side Trends

    1.3. Supply-side Trends

    1.4. Technology Roadmap Analysis

    1.5. Analysis and Recommendations

2. Market Overview

    2.1. Market Coverage / Taxonomy

    2.2. Market Definition / Scope / Limitations

3. Market Background

    3.1. Market Dynamics

        3.1.1. Drivers

        3.1.2. Restraints

        3.1.3. Opportunity

        3.1.4. Trends

    3.2. Scenario Forecast

        3.2.1. Demand in Optimistic Scenario

        3.2.2. Demand in Likely Scenario

        3.2.3. Demand in Conservative Scenario

    3.3. Opportunity Map Analysis

    3.4. Investment Feasibility Matrix

    3.5. PESTLE and Porter’s Analysis

    3.6. Regulatory Landscape

        3.6.1. By Key Regions

        3.6.2. By Key Countries

    3.7. Regional Parent Market Outlook

4. Global Market Analysis 2018 to 2022 and Forecast, 2023 to 2033

    4.1. Historical Market Size Value (US$ Million) Analysis, 2018 to 2022

    4.2. Current and Future Market Size Value (US$ Million) Projections, 2023 to 2033

        4.2.1. Y-o-Y Growth Trend Analysis

        4.2.2. Absolute $ Opportunity Analysis

5. Global Market Analysis 2018 to 2022 and Forecast 2023 to 2033, By Type

    5.1. Introduction / Key Findings

    5.2. Historical Market Size Value (US$ Million) Analysis By Type, 2018 to 2022

    5.3. Current and Future Market Size Value (US$ Million) Analysis and Forecast By Type, 2023 to 2033

        5.3.1. Subcutaneous Immunotherapy

        5.3.2. Sublingual Immunotherapy

        5.3.3. Specific Immunotherapy

    5.4. Y-o-Y Growth Trend Analysis By Type, 2018 to 2022

    5.5. Absolute $ Opportunity Analysis By Type, 2023 to 2033

6. Global Market Analysis 2018 to 2022 and Forecast 2023 to 2033, By Allergy Type

    6.1. Introduction / Key Findings

    6.2. Historical Market Size Value (US$ Million) Analysis By Allergy Type, 2018 to 2022

    6.3. Current and Future Market Size Value (US$ Million) Analysis and Forecast By Allergy Type, 2023 to 2033

        6.3.1. Allergic Rhinitis

        6.3.2. Allergic Asthma

        6.3.3. Food Allergy

        6.3.4. Atopic Dermatitis

        6.3.5. Others

    6.4. Y-o-Y Growth Trend Analysis By Allergy Type, 2018 to 2022

    6.5. Absolute $ Opportunity Analysis By Allergy Type, 2023 to 2033

7. Global Market Analysis 2018 to 2022 and Forecast 2023 to 2033, By Distribution Channel

    7.1. Introduction / Key Findings

    7.2. Historical Market Size Value (US$ Million) Analysis By Distribution Channel , 2018 to 2022

    7.3. Current and Future Market Size Value (US$ Million) Analysis and Forecast By Distribution Channel , 2023 to 2033

        7.3.1. Hospital Pharmacy

        7.3.2. Retail Pharmacy

        7.3.3. Online Pharmacy

    7.4. Y-o-Y Growth Trend Analysis By Distribution Channel , 2018 to 2022

    7.5. Absolute $ Opportunity Analysis By Distribution Channel , 2023 to 2033

8. Global Market Analysis 2018 to 2022 and Forecast 2023 to 2033, By Region

    8.1. Introduction

    8.2. Historical Market Size Value (US$ Million) Analysis By Region, 2018 to 2022

    8.3. Current Market Size Value (US$ Million) Analysis and Forecast By Region, 2023 to 2033

        8.3.1. North America

        8.3.2. Latin America

        8.3.3. Europe

        8.3.4. South Asia

        8.3.5. East Asia

        8.3.6. Oceania

        8.3.7. MEA

    8.4. Market Attractiveness Analysis By Region

9. North America Market Analysis 2018 to 2022 and Forecast 2023 to 2033, By Country

    9.1. Historical Market Size Value (US$ Million) Trend Analysis By Market Taxonomy, 2018 to 2022

    9.2. Market Size Value (US$ Million) Forecast By Market Taxonomy, 2023 to 2033

        9.2.1. By Country

            9.2.1.1. The USA

            9.2.1.2. Canada

        9.2.2. By Type

        9.2.3. By Allergy Type

        9.2.4. By Distribution Channel

    9.3. Market Attractiveness Analysis

        9.3.1. By Country

        9.3.2. By Type

        9.3.3. By Allergy Type

        9.3.4. By Distribution Channel

    9.4. Key Takeaways

10. Latin America Market Analysis 2018 to 2022 and Forecast 2023 to 2033, By Country

    10.1. Historical Market Size Value (US$ Million) Trend Analysis By Market Taxonomy, 2018 to 2022

    10.2. Market Size Value (US$ Million) Forecast By Market Taxonomy, 2023 to 2033

        10.2.1. By Country

            10.2.1.1. Brazil

            10.2.1.2. Mexico

            10.2.1.3. Rest of Latin America

        10.2.2. By Type

        10.2.3. By Allergy Type

        10.2.4. By Distribution Channel

    10.3. Market Attractiveness Analysis

        10.3.1. By Country

        10.3.2. By Type

        10.3.3. By Allergy Type

        10.3.4. By Distribution Channel

    10.4. Key Takeaways

11. Europe Market Analysis 2018 to 2022 and Forecast 2023 to 2033, By Country

    11.1. Historical Market Size Value (US$ Million) Trend Analysis By Market Taxonomy, 2018 to 2022

    11.2. Market Size Value (US$ Million) Forecast By Market Taxonomy, 2023 to 2033

        11.2.1. By Country

            11.2.1.1. Germany

            11.2.1.2. United Kingdom

            11.2.1.3. France

            11.2.1.4. Spain

            11.2.1.5. Italy

            11.2.1.6. Rest of Europe

        11.2.2. By Type

        11.2.3. By Allergy Type

        11.2.4. By Distribution Channel

    11.3. Market Attractiveness Analysis

        11.3.1. By Country

        11.3.2. By Type

        11.3.3. By Allergy Type

        11.3.4. By Distribution Channel

    11.4. Key Takeaways

12. South Asia Market Analysis 2018 to 2022 and Forecast 2023 to 2033, By Country

    12.1. Historical Market Size Value (US$ Million) Trend Analysis By Market Taxonomy, 2018 to 2022

    12.2. Market Size Value (US$ Million) Forecast By Market Taxonomy, 2023 to 2033

        12.2.1. By Country

            12.2.1.1. India

            12.2.1.2. Malaysia

            12.2.1.3. Singapore

            12.2.1.4. Thailand

            12.2.1.5. Rest of South Asia

        12.2.2. By Type

        12.2.3. By Allergy Type

        12.2.4. By Distribution Channel

    12.3. Market Attractiveness Analysis

        12.3.1. By Country

        12.3.2. By Type

        12.3.3. By Allergy Type

        12.3.4. By Distribution Channel

    12.4. Key Takeaways

13. East Asia Market Analysis 2018 to 2022 and Forecast 2023 to 2033, By Country

    13.1. Historical Market Size Value (US$ Million) Trend Analysis By Market Taxonomy, 2018 to 2022

    13.2. Market Size Value (US$ Million) Forecast By Market Taxonomy, 2023 to 2033

        13.2.1. By Country

            13.2.1.1. China

            13.2.1.2. Japan

            13.2.1.3. South Korea

        13.2.2. By Type

        13.2.3. By Allergy Type

        13.2.4. By Distribution Channel

    13.3. Market Attractiveness Analysis

        13.3.1. By Country

        13.3.2. By Type

        13.3.3. By Allergy Type

        13.3.4. By Distribution Channel

    13.4. Key Takeaways

14. Oceania Market Analysis 2018 to 2022 and Forecast 2023 to 2033, By Country

    14.1. Historical Market Size Value (US$ Million) Trend Analysis By Market Taxonomy, 2018 to 2022

    14.2. Market Size Value (US$ Million) Forecast By Market Taxonomy, 2023 to 2033

        14.2.1. By Country

            14.2.1.1. Australia

            14.2.1.2. New Zealand

        14.2.2. By Type

        14.2.3. By Allergy Type

        14.2.4. By Distribution Channel

    14.3. Market Attractiveness Analysis

        14.3.1. By Country

        14.3.2. By Type

        14.3.3. By Allergy Type

        14.3.4. By Distribution Channel

    14.4. Key Takeaways

15. MEA Market Analysis 2018 to 2022 and Forecast 2023 to 2033, By Country

    15.1. Historical Market Size Value (US$ Million) Trend Analysis By Market Taxonomy, 2018 to 2022

    15.2. Market Size Value (US$ Million) Forecast By Market Taxonomy, 2023 to 2033

        15.2.1. By Country

            15.2.1.1. GCC Countries

            15.2.1.2. South Africa

            15.2.1.3. Israel

            15.2.1.4. Rest of MEA

        15.2.2. By Type

        15.2.3. By Allergy Type

        15.2.4. By Distribution Channel

    15.3. Market Attractiveness Analysis

        15.3.1. By Country

        15.3.2. By Type

        15.3.3. By Allergy Type

        15.3.4. By Distribution Channel

    15.4. Key Takeaways

16. Key Countries Market Analysis

    16.1. USA

        16.1.1. Pricing Analysis

        16.1.2. Market Share Analysis, 2022

            16.1.2.1. By Type

            16.1.2.2. By Allergy Type

            16.1.2.3. By Distribution Channel

    16.2. Canada

        16.2.1. Pricing Analysis

        16.2.2. Market Share Analysis, 2022

            16.2.2.1. By Type

            16.2.2.2. By Allergy Type

            16.2.2.3. By Distribution Channel

    16.3. Brazil

        16.3.1. Pricing Analysis

        16.3.2. Market Share Analysis, 2022

            16.3.2.1. By Type

            16.3.2.2. By Allergy Type

            16.3.2.3. By Distribution Channel

    16.4. Mexico

        16.4.1. Pricing Analysis

        16.4.2. Market Share Analysis, 2022

            16.4.2.1. By Type

            16.4.2.2. By Allergy Type

            16.4.2.3. By Distribution Channel

    16.5. Germany

        16.5.1. Pricing Analysis

        16.5.2. Market Share Analysis, 2022

            16.5.2.1. By Type

            16.5.2.2. By Allergy Type

            16.5.2.3. By Distribution Channel

    16.6. United Kingdom

        16.6.1. Pricing Analysis

        16.6.2. Market Share Analysis, 2022

            16.6.2.1. By Type

            16.6.2.2. By Allergy Type

            16.6.2.3. By Distribution Channel

    16.7. France

        16.7.1. Pricing Analysis

        16.7.2. Market Share Analysis, 2022

            16.7.2.1. By Type

            16.7.2.2. By Allergy Type

            16.7.2.3. By Distribution Channel

    16.8. Spain

        16.8.1. Pricing Analysis

        16.8.2. Market Share Analysis, 2022

            16.8.2.1. By Type

            16.8.2.2. By Allergy Type

            16.8.2.3. By Distribution Channel

    16.9. Italy

        16.9.1. Pricing Analysis

        16.9.2. Market Share Analysis, 2022

            16.9.2.1. By Type

            16.9.2.2. By Allergy Type

            16.9.2.3. By Distribution Channel

    16.10. India

        16.10.1. Pricing Analysis

        16.10.2. Market Share Analysis, 2022

            16.10.2.1. By Type

            16.10.2.2. By Allergy Type

            16.10.2.3. By Distribution Channel

    16.11. Malaysia

        16.11.1. Pricing Analysis

        16.11.2. Market Share Analysis, 2022

            16.11.2.1. By Type

            16.11.2.2. By Allergy Type

            16.11.2.3. By Distribution Channel

    16.12. Singapore

        16.12.1. Pricing Analysis

        16.12.2. Market Share Analysis, 2022

            16.12.2.1. By Type

            16.12.2.2. By Allergy Type

            16.12.2.3. By Distribution Channel

    16.13. Thailand

        16.13.1. Pricing Analysis

        16.13.2. Market Share Analysis, 2022

            16.13.2.1. By Type

            16.13.2.2. By Allergy Type

            16.13.2.3. By Distribution Channel

    16.14. China

        16.14.1. Pricing Analysis

        16.14.2. Market Share Analysis, 2022

            16.14.2.1. By Type

            16.14.2.2. By Allergy Type

            16.14.2.3. By Distribution Channel

    16.15. Japan

        16.15.1. Pricing Analysis

        16.15.2. Market Share Analysis, 2022

            16.15.2.1. By Type

            16.15.2.2. By Allergy Type

            16.15.2.3. By Distribution Channel

    16.16. South Korea

        16.16.1. Pricing Analysis

        16.16.2. Market Share Analysis, 2022

            16.16.2.1. By Type

            16.16.2.2. By Allergy Type

            16.16.2.3. By Distribution Channel

    16.17. Australia

        16.17.1. Pricing Analysis

        16.17.2. Market Share Analysis, 2022

            16.17.2.1. By Type

            16.17.2.2. By Allergy Type

            16.17.2.3. By Distribution Channel

    16.18. New Zealand

        16.18.1. Pricing Analysis

        16.18.2. Market Share Analysis, 2022

            16.18.2.1. By Type

            16.18.2.2. By Allergy Type

            16.18.2.3. By Distribution Channel

    16.19. GCC Countries

        16.19.1. Pricing Analysis

        16.19.2. Market Share Analysis, 2022

            16.19.2.1. By Type

            16.19.2.2. By Allergy Type

            16.19.2.3. By Distribution Channel

    16.20. South Africa

        16.20.1. Pricing Analysis

        16.20.2. Market Share Analysis, 2022

            16.20.2.1. By Type

            16.20.2.2. By Allergy Type

            16.20.2.3. By Distribution Channel

    16.21. Israel

        16.21.1. Pricing Analysis

        16.21.2. Market Share Analysis, 2022

            16.21.2.1. By Type

            16.21.2.2. By Allergy Type

            16.21.2.3. By Distribution Channel

17. Market Structure Analysis

    17.1. Competition Dashboard

    17.2. Competition Benchmarking

    17.3. Market Share Analysis of Top Players

        17.3.1. By Regional

        17.3.2. By Type

        17.3.3. By Allergy Type

        17.3.4. By Distribution Channel

18. Competition Analysis

    18.1. Competition Deep Dive

        18.1.1. ALK Abello

            18.1.1.1. Overview

            18.1.1.2. Product Portfolio

            18.1.1.3. Profitability by Market Segments

            18.1.1.4. Sales Footprint

            18.1.1.5. Strategy Overview

                18.1.1.5.1. Marketing Strategy

        18.1.2. Stallergenes Greer

            18.1.2.1. Overview

            18.1.2.2. Product Portfolio

            18.1.2.3. Profitability by Market Segments

            18.1.2.4. Sales Footprint

            18.1.2.5. Strategy Overview

                18.1.2.5.1. Marketing Strategy

        18.1.3. Allergy Therapeutics

            18.1.3.1. Overview

            18.1.3.2. Product Portfolio

            18.1.3.3. Profitability by Market Segments

            18.1.3.4. Sales Footprint

            18.1.3.5. Strategy Overview

                18.1.3.5.1. Marketing Strategy

        18.1.4. Aimmune Therapeutics

            18.1.4.1. Overview

            18.1.4.2. Product Portfolio

            18.1.4.3. Profitability by Market Segments

            18.1.4.4. Sales Footprint

            18.1.4.5. Strategy Overview

                18.1.4.5.1. Marketing Strategy

        18.1.5. Merck KGaA

            18.1.5.1. Overview

            18.1.5.2. Product Portfolio

            18.1.5.3. Profitability by Market Segments

            18.1.5.4. Sales Footprint

            18.1.5.5. Strategy Overview

                18.1.5.5.1. Marketing Strategy

        18.1.6. Arrayit Corporation

            18.1.6.1. Overview

            18.1.6.2. Product Portfolio

            18.1.6.3. Profitability by Market Segments

            18.1.6.4. Sales Footprint

            18.1.6.5. Strategy Overview

                18.1.6.5.1. Marketing Strategy

        18.1.7. Biomay AG

            18.1.7.1. Overview

            18.1.7.2. Product Portfolio

            18.1.7.3. Profitability by Market Segments

            18.1.7.4. Sales Footprint

            18.1.7.5. Strategy Overview

                18.1.7.5.1. Marketing Strategy

        18.1.8. HAL Allergy Group

            18.1.8.1. Overview

            18.1.8.2. Product Portfolio

            18.1.8.3. Profitability by Market Segments

            18.1.8.4. Sales Footprint

            18.1.8.5. Strategy Overview

                18.1.8.5.1. Marketing Strategy

        18.1.9. HolisterStier

            18.1.9.1. Overview

            18.1.9.2. Product Portfolio

            18.1.9.3. Profitability by Market Segments

            18.1.9.4. Sales Footprint

            18.1.9.5. Strategy Overview

                18.1.9.5.1. Marketing Strategy

        18.1.10. WOLWpharma

            18.1.10.1. Overview

            18.1.10.2. Product Portfolio

            18.1.10.3. Profitability by Market Segments

            18.1.10.4. Sales Footprint

            18.1.10.5. Strategy Overview

                18.1.10.5.1. Marketing Strategy

19. Assumptions & Acronyms Used

20. Research Methodology

Don't pay for what you don't need

Customize your report by selecting specific countries or regions and save 30%!

List of Tables

Table 1: Global Market Value (US$ Million) Forecast by Region, 2018 to 2033

Table 2: Global Market Value (US$ Million) Forecast by Type, 2018 to 2033

Table 3: Global Market Value (US$ Million) Forecast by Allergy Type, 2018 to 2033

Table 4: Global Market Value (US$ Million) Forecast by Distribution Channel , 2018 to 2033

Table 5: North America Market Value (US$ Million) Forecast by Country, 2018 to 2033

Table 6: North America Market Value (US$ Million) Forecast by Type, 2018 to 2033

Table 7: North America Market Value (US$ Million) Forecast by Allergy Type, 2018 to 2033

Table 8: North America Market Value (US$ Million) Forecast by Distribution Channel , 2018 to 2033

Table 9: Latin America Market Value (US$ Million) Forecast by Country, 2018 to 2033

Table 10: Latin America Market Value (US$ Million) Forecast by Type, 2018 to 2033

Table 11: Latin America Market Value (US$ Million) Forecast by Allergy Type, 2018 to 2033

Table 12: Latin America Market Value (US$ Million) Forecast by Distribution Channel , 2018 to 2033

Table 13: Europe Market Value (US$ Million) Forecast by Country, 2018 to 2033

Table 14: Europe Market Value (US$ Million) Forecast by Type, 2018 to 2033

Table 15: Europe Market Value (US$ Million) Forecast by Allergy Type, 2018 to 2033

Table 16: Europe Market Value (US$ Million) Forecast by Distribution Channel , 2018 to 2033

Table 17: South Asia Market Value (US$ Million) Forecast by Country, 2018 to 2033

Table 18: South Asia Market Value (US$ Million) Forecast by Type, 2018 to 2033

Table 19: South Asia Market Value (US$ Million) Forecast by Allergy Type, 2018 to 2033

Table 20: South Asia Market Value (US$ Million) Forecast by Distribution Channel , 2018 to 2033

Table 21: East Asia Market Value (US$ Million) Forecast by Country, 2018 to 2033

Table 22: East Asia Market Value (US$ Million) Forecast by Type, 2018 to 2033

Table 23: East Asia Market Value (US$ Million) Forecast by Allergy Type, 2018 to 2033

Table 24: East Asia Market Value (US$ Million) Forecast by Distribution Channel , 2018 to 2033

Table 25: Oceania Market Value (US$ Million) Forecast by Country, 2018 to 2033

Table 26: Oceania Market Value (US$ Million) Forecast by Type, 2018 to 2033

Table 27: Oceania Market Value (US$ Million) Forecast by Allergy Type, 2018 to 2033

Table 28: Oceania Market Value (US$ Million) Forecast by Distribution Channel , 2018 to 2033

Table 29: MEA Market Value (US$ Million) Forecast by Country, 2018 to 2033

Table 30: MEA Market Value (US$ Million) Forecast by Type, 2018 to 2033

Table 31: MEA Market Value (US$ Million) Forecast by Allergy Type, 2018 to 2033

Table 32: MEA Market Value (US$ Million) Forecast by Distribution Channel , 2018 to 2033
Sabyasachi Ghosh
Sabyasachi Ghosh

Principal Consultant

Talk to Analyst

Find your sweet spots for generating winning opportunities in this market.

List of Charts

Figure 1: Global Market Value (US$ Million) by Type, 2023 to 2033

Figure 2: Global Market Value (US$ Million) by Allergy Type, 2023 to 2033

Figure 3: Global Market Value (US$ Million) by Distribution Channel , 2023 to 2033

Figure 4: Global Market Value (US$ Million) by Region, 2023 to 2033

Figure 5: Global Market Value (US$ Million) Analysis by Region, 2018 to 2033

Figure 6: Global Market Value Share (%) and BPS Analysis by Region, 2023 to 2033

Figure 7: Global Market Y-o-Y Growth (%) Projections by Region, 2023 to 2033

Figure 8: Global Market Value (US$ Million) Analysis by Type, 2018 to 2033

Figure 9: Global Market Value Share (%) and BPS Analysis by Type, 2023 to 2033

Figure 10: Global Market Y-o-Y Growth (%) Projections by Type, 2023 to 2033

Figure 11: Global Market Value (US$ Million) Analysis by Allergy Type, 2018 to 2033

Figure 12: Global Market Value Share (%) and BPS Analysis by Allergy Type, 2023 to 2033

Figure 13: Global Market Y-o-Y Growth (%) Projections by Allergy Type, 2023 to 2033

Figure 14: Global Market Value (US$ Million) Analysis by Distribution Channel , 2018 to 2033

Figure 15: Global Market Value Share (%) and BPS Analysis by Distribution Channel , 2023 to 2033

Figure 16: Global Market Y-o-Y Growth (%) Projections by Distribution Channel , 2023 to 2033

Figure 17: Global Market Attractiveness by Type, 2023 to 2033

Figure 18: Global Market Attractiveness by Allergy Type, 2023 to 2033

Figure 19: Global Market Attractiveness by Distribution Channel , 2023 to 2033

Figure 20: Global Market Attractiveness by Region, 2023 to 2033

Figure 21: North America Market Value (US$ Million) by Type, 2023 to 2033

Figure 22: North America Market Value (US$ Million) by Allergy Type, 2023 to 2033

Figure 23: North America Market Value (US$ Million) by Distribution Channel , 2023 to 2033

Figure 24: North America Market Value (US$ Million) by Country, 2023 to 2033

Figure 25: North America Market Value (US$ Million) Analysis by Country, 2018 to 2033

Figure 26: North America Market Value Share (%) and BPS Analysis by Country, 2023 to 2033

Figure 27: North America Market Y-o-Y Growth (%) Projections by Country, 2023 to 2033

Figure 28: North America Market Value (US$ Million) Analysis by Type, 2018 to 2033

Figure 29: North America Market Value Share (%) and BPS Analysis by Type, 2023 to 2033

Figure 30: North America Market Y-o-Y Growth (%) Projections by Type, 2023 to 2033

Figure 31: North America Market Value (US$ Million) Analysis by Allergy Type, 2018 to 2033

Figure 32: North America Market Value Share (%) and BPS Analysis by Allergy Type, 2023 to 2033

Figure 33: North America Market Y-o-Y Growth (%) Projections by Allergy Type, 2023 to 2033

Figure 34: North America Market Value (US$ Million) Analysis by Distribution Channel , 2018 to 2033

Figure 35: North America Market Value Share (%) and BPS Analysis by Distribution Channel , 2023 to 2033

Figure 36: North America Market Y-o-Y Growth (%) Projections by Distribution Channel , 2023 to 2033

Figure 37: North America Market Attractiveness by Type, 2023 to 2033

Figure 38: North America Market Attractiveness by Allergy Type, 2023 to 2033

Figure 39: North America Market Attractiveness by Distribution Channel , 2023 to 2033

Figure 40: North America Market Attractiveness by Country, 2023 to 2033

Figure 41: Latin America Market Value (US$ Million) by Type, 2023 to 2033

Figure 42: Latin America Market Value (US$ Million) by Allergy Type, 2023 to 2033

Figure 43: Latin America Market Value (US$ Million) by Distribution Channel , 2023 to 2033

Figure 44: Latin America Market Value (US$ Million) by Country, 2023 to 2033

Figure 45: Latin America Market Value (US$ Million) Analysis by Country, 2018 to 2033

Figure 46: Latin America Market Value Share (%) and BPS Analysis by Country, 2023 to 2033

Figure 47: Latin America Market Y-o-Y Growth (%) Projections by Country, 2023 to 2033

Figure 48: Latin America Market Value (US$ Million) Analysis by Type, 2018 to 2033

Figure 49: Latin America Market Value Share (%) and BPS Analysis by Type, 2023 to 2033

Figure 50: Latin America Market Y-o-Y Growth (%) Projections by Type, 2023 to 2033

Figure 51: Latin America Market Value (US$ Million) Analysis by Allergy Type, 2018 to 2033

Figure 52: Latin America Market Value Share (%) and BPS Analysis by Allergy Type, 2023 to 2033

Figure 53: Latin America Market Y-o-Y Growth (%) Projections by Allergy Type, 2023 to 2033

Figure 54: Latin America Market Value (US$ Million) Analysis by Distribution Channel , 2018 to 2033

Figure 55: Latin America Market Value Share (%) and BPS Analysis by Distribution Channel , 2023 to 2033

Figure 56: Latin America Market Y-o-Y Growth (%) Projections by Distribution Channel , 2023 to 2033

Figure 57: Latin America Market Attractiveness by Type, 2023 to 2033

Figure 58: Latin America Market Attractiveness by Allergy Type, 2023 to 2033

Figure 59: Latin America Market Attractiveness by Distribution Channel , 2023 to 2033

Figure 60: Latin America Market Attractiveness by Country, 2023 to 2033

Figure 61: Europe Market Value (US$ Million) by Type, 2023 to 2033

Figure 62: Europe Market Value (US$ Million) by Allergy Type, 2023 to 2033

Figure 63: Europe Market Value (US$ Million) by Distribution Channel , 2023 to 2033

Figure 64: Europe Market Value (US$ Million) by Country, 2023 to 2033

Figure 65: Europe Market Value (US$ Million) Analysis by Country, 2018 to 2033

Figure 66: Europe Market Value Share (%) and BPS Analysis by Country, 2023 to 2033

Figure 67: Europe Market Y-o-Y Growth (%) Projections by Country, 2023 to 2033

Figure 68: Europe Market Value (US$ Million) Analysis by Type, 2018 to 2033

Figure 69: Europe Market Value Share (%) and BPS Analysis by Type, 2023 to 2033

Figure 70: Europe Market Y-o-Y Growth (%) Projections by Type, 2023 to 2033

Figure 71: Europe Market Value (US$ Million) Analysis by Allergy Type, 2018 to 2033

Figure 72: Europe Market Value Share (%) and BPS Analysis by Allergy Type, 2023 to 2033

Figure 73: Europe Market Y-o-Y Growth (%) Projections by Allergy Type, 2023 to 2033

Figure 74: Europe Market Value (US$ Million) Analysis by Distribution Channel , 2018 to 2033

Figure 75: Europe Market Value Share (%) and BPS Analysis by Distribution Channel , 2023 to 2033

Figure 76: Europe Market Y-o-Y Growth (%) Projections by Distribution Channel , 2023 to 2033

Figure 77: Europe Market Attractiveness by Type, 2023 to 2033

Figure 78: Europe Market Attractiveness by Allergy Type, 2023 to 2033

Figure 79: Europe Market Attractiveness by Distribution Channel , 2023 to 2033

Figure 80: Europe Market Attractiveness by Country, 2023 to 2033

Figure 81: South Asia Market Value (US$ Million) by Type, 2023 to 2033

Figure 82: South Asia Market Value (US$ Million) by Allergy Type, 2023 to 2033

Figure 83: South Asia Market Value (US$ Million) by Distribution Channel , 2023 to 2033

Figure 84: South Asia Market Value (US$ Million) by Country, 2023 to 2033

Figure 85: South Asia Market Value (US$ Million) Analysis by Country, 2018 to 2033

Figure 86: South Asia Market Value Share (%) and BPS Analysis by Country, 2023 to 2033

Figure 87: South Asia Market Y-o-Y Growth (%) Projections by Country, 2023 to 2033

Figure 88: South Asia Market Value (US$ Million) Analysis by Type, 2018 to 2033

Figure 89: South Asia Market Value Share (%) and BPS Analysis by Type, 2023 to 2033

Figure 90: South Asia Market Y-o-Y Growth (%) Projections by Type, 2023 to 2033

Figure 91: South Asia Market Value (US$ Million) Analysis by Allergy Type, 2018 to 2033

Figure 92: South Asia Market Value Share (%) and BPS Analysis by Allergy Type, 2023 to 2033

Figure 93: South Asia Market Y-o-Y Growth (%) Projections by Allergy Type, 2023 to 2033

Figure 94: South Asia Market Value (US$ Million) Analysis by Distribution Channel , 2018 to 2033

Figure 95: South Asia Market Value Share (%) and BPS Analysis by Distribution Channel , 2023 to 2033

Figure 96: South Asia Market Y-o-Y Growth (%) Projections by Distribution Channel , 2023 to 2033

Figure 97: South Asia Market Attractiveness by Type, 2023 to 2033

Figure 98: South Asia Market Attractiveness by Allergy Type, 2023 to 2033

Figure 99: South Asia Market Attractiveness by Distribution Channel , 2023 to 2033

Figure 100: South Asia Market Attractiveness by Country, 2023 to 2033

Figure 101: East Asia Market Value (US$ Million) by Type, 2023 to 2033

Figure 102: East Asia Market Value (US$ Million) by Allergy Type, 2023 to 2033

Figure 103: East Asia Market Value (US$ Million) by Distribution Channel , 2023 to 2033

Figure 104: East Asia Market Value (US$ Million) by Country, 2023 to 2033

Figure 105: East Asia Market Value (US$ Million) Analysis by Country, 2018 to 2033

Figure 106: East Asia Market Value Share (%) and BPS Analysis by Country, 2023 to 2033

Figure 107: East Asia Market Y-o-Y Growth (%) Projections by Country, 2023 to 2033

Figure 108: East Asia Market Value (US$ Million) Analysis by Type, 2018 to 2033

Figure 109: East Asia Market Value Share (%) and BPS Analysis by Type, 2023 to 2033

Figure 110: East Asia Market Y-o-Y Growth (%) Projections by Type, 2023 to 2033

Figure 111: East Asia Market Value (US$ Million) Analysis by Allergy Type, 2018 to 2033

Figure 112: East Asia Market Value Share (%) and BPS Analysis by Allergy Type, 2023 to 2033

Figure 113: East Asia Market Y-o-Y Growth (%) Projections by Allergy Type, 2023 to 2033

Figure 114: East Asia Market Value (US$ Million) Analysis by Distribution Channel , 2018 to 2033

Figure 115: East Asia Market Value Share (%) and BPS Analysis by Distribution Channel , 2023 to 2033

Figure 116: East Asia Market Y-o-Y Growth (%) Projections by Distribution Channel , 2023 to 2033

Figure 117: East Asia Market Attractiveness by Type, 2023 to 2033

Figure 118: East Asia Market Attractiveness by Allergy Type, 2023 to 2033

Figure 119: East Asia Market Attractiveness by Distribution Channel , 2023 to 2033

Figure 120: East Asia Market Attractiveness by Country, 2023 to 2033

Figure 121: Oceania Market Value (US$ Million) by Type, 2023 to 2033

Figure 122: Oceania Market Value (US$ Million) by Allergy Type, 2023 to 2033

Figure 123: Oceania Market Value (US$ Million) by Distribution Channel , 2023 to 2033

Figure 124: Oceania Market Value (US$ Million) by Country, 2023 to 2033

Figure 125: Oceania Market Value (US$ Million) Analysis by Country, 2018 to 2033

Figure 126: Oceania Market Value Share (%) and BPS Analysis by Country, 2023 to 2033

Figure 127: Oceania Market Y-o-Y Growth (%) Projections by Country, 2023 to 2033

Figure 128: Oceania Market Value (US$ Million) Analysis by Type, 2018 to 2033

Figure 129: Oceania Market Value Share (%) and BPS Analysis by Type, 2023 to 2033

Figure 130: Oceania Market Y-o-Y Growth (%) Projections by Type, 2023 to 2033

Figure 131: Oceania Market Value (US$ Million) Analysis by Allergy Type, 2018 to 2033

Figure 132: Oceania Market Value Share (%) and BPS Analysis by Allergy Type, 2023 to 2033

Figure 133: Oceania Market Y-o-Y Growth (%) Projections by Allergy Type, 2023 to 2033

Figure 134: Oceania Market Value (US$ Million) Analysis by Distribution Channel , 2018 to 2033

Figure 135: Oceania Market Value Share (%) and BPS Analysis by Distribution Channel , 2023 to 2033

Figure 136: Oceania Market Y-o-Y Growth (%) Projections by Distribution Channel , 2023 to 2033

Figure 137: Oceania Market Attractiveness by Type, 2023 to 2033

Figure 138: Oceania Market Attractiveness by Allergy Type, 2023 to 2033

Figure 139: Oceania Market Attractiveness by Distribution Channel , 2023 to 2033

Figure 140: Oceania Market Attractiveness by Country, 2023 to 2033

Figure 141: MEA Market Value (US$ Million) by Type, 2023 to 2033

Figure 142: MEA Market Value (US$ Million) by Allergy Type, 2023 to 2033

Figure 143: MEA Market Value (US$ Million) by Distribution Channel , 2023 to 2033

Figure 144: MEA Market Value (US$ Million) by Country, 2023 to 2033

Figure 145: MEA Market Value (US$ Million) Analysis by Country, 2018 to 2033

Figure 146: MEA Market Value Share (%) and BPS Analysis by Country, 2023 to 2033

Figure 147: MEA Market Y-o-Y Growth (%) Projections by Country, 2023 to 2033

Figure 148: MEA Market Value (US$ Million) Analysis by Type, 2018 to 2033

Figure 149: MEA Market Value Share (%) and BPS Analysis by Type, 2023 to 2033

Figure 150: MEA Market Y-o-Y Growth (%) Projections by Type, 2023 to 2033

Figure 151: MEA Market Value (US$ Million) Analysis by Allergy Type, 2018 to 2033

Figure 152: MEA Market Value Share (%) and BPS Analysis by Allergy Type, 2023 to 2033

Figure 153: MEA Market Y-o-Y Growth (%) Projections by Allergy Type, 2023 to 2033

Figure 154: MEA Market Value (US$ Million) Analysis by Distribution Channel , 2018 to 2033

Figure 155: MEA Market Value Share (%) and BPS Analysis by Distribution Channel , 2023 to 2033

Figure 156: MEA Market Y-o-Y Growth (%) Projections by Distribution Channel , 2023 to 2033

Figure 157: MEA Market Attractiveness by Type, 2023 to 2033

Figure 158: MEA Market Attractiveness by Allergy Type, 2023 to 2033

Figure 159: MEA Market Attractiveness by Distribution Channel , 2023 to 2033

Figure 160: MEA Market Attractiveness by Country, 2023 to 2033

Recommendations

Healthcare

IgE Allergy Blood Tests Market

Published : January 2023

Healthcare

Food Allergy Market

Published : December 2022

Explore Healthcare Insights

View Reports

Allergy Immunotherapy Market