The Pollen Allergy Market is estimated to be valued at USD 6.4 billion in 2025 and is projected to reach USD 9.6 billion by 2035, registering a compound annual growth rate (CAGR) of 4.2% over the forecast period.
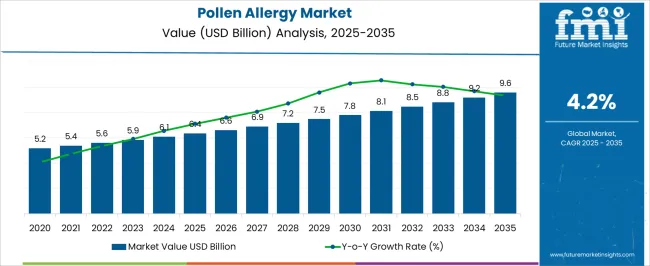
| Metric | Value |
|---|---|
| Pollen Allergy Market Estimated Value in (2025 E) | USD 6.4 billion |
| Pollen Allergy Market Forecast Value in (2035 F) | USD 9.6 billion |
| Forecast CAGR (2025 to 2035) | 4.2% |
The Pollen Allergy market is experiencing sustained growth due to rising global prevalence of allergic rhinitis and increased awareness regarding early diagnosis and treatment. A shift toward patient-centric care models and growing investments in allergy diagnostics and immunotherapy services are contributing to the expansion of this market. Technological advancements in allergen detection and precision-based treatment delivery are allowing healthcare providers to improve diagnosis accuracy and therapeutic outcomes.
Public health campaigns and broader insurance coverage for allergy treatments are supporting higher diagnosis rates and increased adoption of long-term management services. Climate change and increasing pollen load in urban environments are further intensifying allergy severity and lengthening allergy seasons, which has led to higher demand for both therapeutic and preventive solutions.
Continued research efforts in the field of immunology and allergy have paved the way for targeted therapies and better patient adherence strategies These factors collectively are shaping the future of the pollen allergy market and driving its growth trajectory.
The market is segmented by Product Type, Allergen Type, Therapeutics Drug Class, and End-User and region. By Product Type, the market is divided into Services, Instruments, and Consumables. In terms of Allergen Type, the market is classified into Inhaled, Food, Drug, and Other. Based on Therapeutics Drug Class, the market is segmented into Antihistamines, Decongestants, Corticosteroids, Mast Cell Stabilizers, Leukotriene Inhibitors, Nasal Anticholinergics, Immunomodulators, Auto injectable Epinephrine, and Immunotherapy. By End-User, the market is divided into Hospitals and Diagnostic Laboratories. Regionally, the market is classified into North America, Latin America, Western Europe, Eastern Europe, Balkan & Baltic Countries, Russia & Belarus, Central Asia, East Asia, South Asia & Pacific, and the Middle East & Africa.
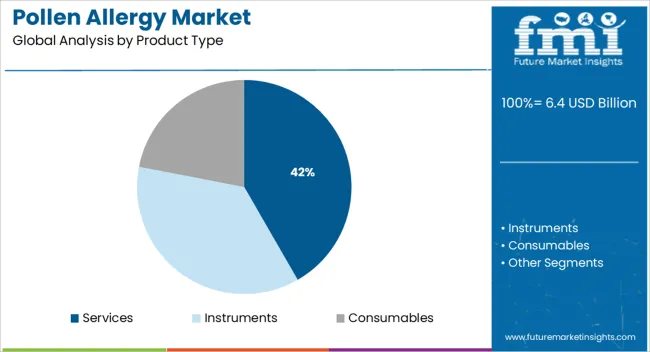
The services segment is projected to account for 41.7% of the Pollen Allergy market revenue share in 2025, establishing itself as the leading product type. This dominance is being attributed to the growing demand for diagnostic, testing, and immunotherapy services, which are essential in accurately identifying and managing allergic responses. It has been observed that healthcare providers and allergy specialists are increasingly emphasizing preventive care and long-term desensitization strategies, which rely heavily on specialized services.
Allergy testing services, particularly those that include skin prick testing and specific IgE blood tests, are seeing wider acceptance due to their clinical relevance and reliability. The growth in outpatient allergy centers and telehealth-based consultations has expanded the reach of these services to underserved and rural populations.
The increased awareness among patients regarding personalized treatment and routine allergy assessments has also supported the expansion of this segment Collectively, these developments have reinforced the position of services as the most preferred product type in the market.
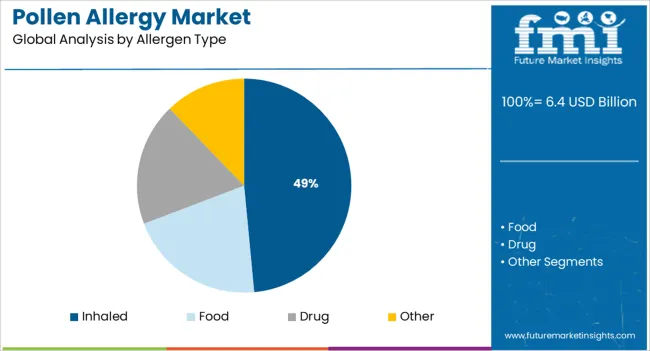
The inhaled allergen type segment is anticipated to contribute 48.5% of the Pollen Allergy market revenue share in 2025, making it the most prominent allergen category. This leadership is being driven by the widespread prevalence of airborne pollen allergens such as grass, tree, and weed pollens, which are known to trigger moderate to severe allergic responses in a large percentage of the global population. Healthcare studies and clinical observations have noted that inhaled allergens remain the primary source of seasonal allergy symptoms including sneezing, nasal congestion, and itchy eyes.
The increase in urban air pollution and environmental changes has intensified pollen spread and exposure, amplifying the impact of inhaled allergens. Patients are increasingly seeking medical attention for respiratory allergy symptoms, which are often traced to airborne pollen sources.
Allergy clinics and diagnostic centers are focused on testing and managing these inhaled allergens through immunotherapy, symptom control, and avoidance strategies These factors are responsible for maintaining the dominance of this segment in the overall allergen landscape.
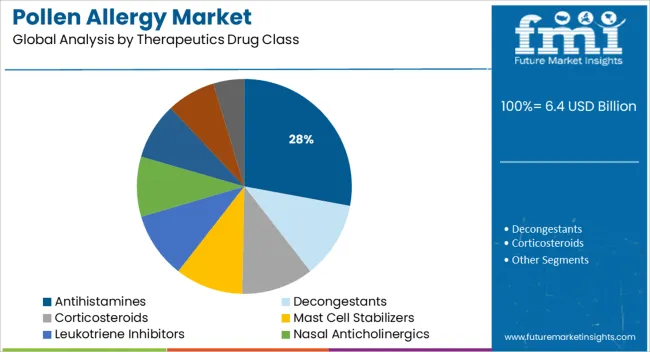
The antihistamines segment is forecasted to hold 27.9% of the Pollen Allergy market revenue share in 2025, positioning it as the leading therapeutic drug class. This segment’s growth is being sustained by the widespread use of antihistamines as the first line of treatment for mild to moderate allergic symptoms such as runny nose, sneezing, and skin irritation. Clinicians are frequently prescribing both over-the-counter and prescription-based antihistamines due to their rapid onset of action, proven safety profile, and affordability.
The availability of second-generation antihistamines with reduced sedative effects has further enhanced patient compliance and expanded usage across age groups. Pharmaceutical company disclosures and clinical guidelines have highlighted the role of antihistamines in providing symptomatic relief and serving as a supportive therapy alongside immunotherapy or corticosteroids.
Their convenience, non-invasive administration, and established efficacy have made them a preferred choice for both acute and chronic management of pollen-induced allergic reactions These factors have collectively enabled antihistamines to remain a cornerstone treatment in the pollen allergy market.
The pollen allergy market is expected to gain market growth in the forecast period of 2025 to 2035. Latest market analysis by FMI the market is to grow at a CAGR of 4.2% in the above-mentioned forecast period.
Pollens are referred to as mostly consist of tiny particles released by grasses, trees, and plants during their reproductive cycle. These pollen particles can easily gasp by animals and humans which can cause inflammation and irritation to some individuals and this allergy can lead to fever and rhinitis.
Patients with pollen allergy need to be aware of the changes that can occur in their area to help them adapt to changes in the pattern and presentation of disease that may result from climate change. The global pollen allergy market rose at a CAGR of 3.8% from 2020 to 2025.
The rising Prevalence of Allergy and Changing Lifestyle Leading to Decreased Immune Resistance drive the Pollen Allergy Market
The rise in the number of patients suffering from pollen-based allergies and more precisely hay fever drives the growth of the market. Moreover, the growing number of patients especially children is another contributor to escalating the global pollen allergy market. Rapid urbanization in the advancing countries is the major factor that boosts the growth of the pollen allergies market in the forecast period.
Allergy is considered a risk factor for asthma, chronic inflammatory conditions and reduce quality of life. Because of these factors, there is a high need for the treatment of allergies. The global pollen allergy market is expected to show tremendous growth due to increased Pharmaceutical Research and Development spending and biotechnology investment.
The increase in greenhouse gas can result in pollen-induced reparative disease which is further estimated to cushion the growth of the pollen allergies market. Increasing environmental pollution will further provide opportunities for the growth of the pollen allergies market in the coming years.
Increase in Healthcare Spending and Government Initiatives to Drive the Market Growth
Over the past few decades, it has been noted that global per capita healthcare spending has increased considerably owing to the increasing rate of awareness regarding the availability of myriad treatments and diagnostic methods for treating various diseases.
Increasing healthcare spending is likely to result in increasing demand for better quality and rapid diagnostic methods, and in turn, create high growth opportunities for players operating in the treatment of pollen allergies market.
Respiratory disease places a huge burden on society in terms of disability and premature mortality, and also in direct health service costs, drugs prescribed, and the indirect costs related to lost production. Pollen allergy is frequently accompanied by allergic asthma treatment. This condition is also impacting the global pollen allergy market.
In order to increase awareness about allergic rhinitis, several government organizations have started awareness programs. For instance, Allergy UK is the operational name of the British Allergy Foundation that observes allergy awareness week from April 25 to May 1.
Increased Awareness Regarding Allergy Immunotherapy to Hamper the Market Growth
Despite a positive growth trajectory, the global pollen allergy market is facing various challenges that are likely to pose a threat to its growth during the forecast period.
The lack of a permanent cure for grass pollen allergy disease and home-based diagnosis are a few restraints to the growth of the global pollen allergy market. The rise in the preference towards the utilization of biosimilars is further projected to impede the growth of the pollen allergies market in the forecast period.
However, the decrease in the awareness of allergy immunotherapy (AIT) amongst patients might further challenge the growth of the pollen allergies market in the near future
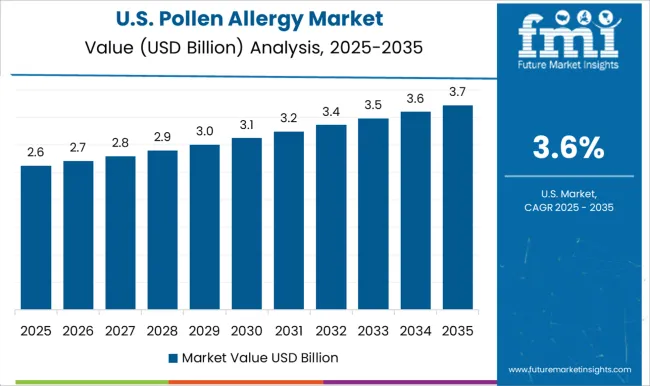
Increasing Rate of Allergic Diseases in the USA to Propel the Market Growth
The USA is estimated to account for over 40% of the North American market in 2025. North America has dominated the global pollen allergy market due to the increased incidence rate of allergies and awareness of therapy.
A study conducted by the American College of Allergy, Asthma & Immunology in 2010 reported that about 16.9 million adults and 6.7 million children were diagnosed with hay fever and its prevalence is increasing by approximately 30% in adults and 40% in children.
The United States Food and Drug Administration 2014 estimated around 30 million people in the United States and 500 million globally suffer from one or other form of hay fever symptoms.
Moreover, the increasing focus on Research and Development to develop novel products to cater to high unmet medical needs is highly impacting the market’s growth.
For instance, GlaxoSmithKline plc announced that the USA Food and Drug Administration (FDA) has approved Flonase® Allergy Relief (fluticasone propionate 50 mcg spray), containing the No. 1 prescribed allergy treatment ingredient1, as an over-the-counter (OTC) treatment for temporary relief of the symptoms of hay fever or upper respiratory allergies.2
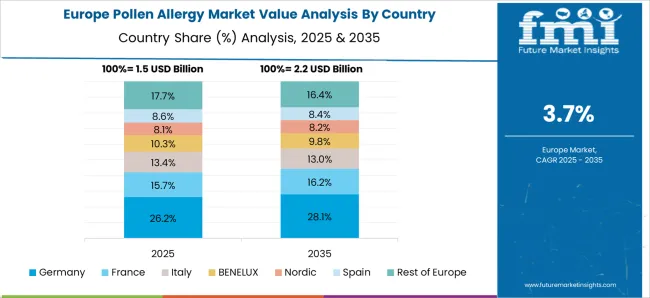
Rising Prevalence of Respiratory Allergic Disorders Driving Growth in the Europe Market
The Europe pollen allergy market is expected to rise at a CAGR of 4.0% from 2025 to 2035. Europe is expected to have the second-largest market for global pollen allergy market. Increasing awareness among people about diseases is also a major factor that may boost the growth of the market in this region.
Europe dominates the pollen allergies market due to the rise in the prevalence of respiratory allergic disorders. Europe is the fastest-growing market in pollen allergy due to increasing healthcare funding by the government. Moreover, an increase in the need for therapeutics is further anticipated to propel the growth pollen allergies market in the region in the coming years.
The Charity Allergy UK estimated that about 18 million people were found to be affected with grass pollen allergy which is more common among children and teenagers. Symptoms of pollen include frequent sneezing, running or blocked nose, and itchy eyes, and throat. In some instances, it can also lead to loss of senses to smell, facial pain, sweating, and severe headache. People suffering from asthma face even worse symptoms which include tight chest, shortness of breath, coughing, and wheezing.
Advancement in Healthcare to Propel the Market Growth
Asia Pacific is anticipated to expand at the fastest CAGR of 3.8% during the forecast period. Asia Pacific emerged as the fastest-growing region in the pollen allergy market owing to the presence of unmet healthcare infrastructure needs and the increasing prevalence of allergic diseases.
Furthermore, favorable government initiatives in regions like Japan and Australia pertaining to drug price adjustment and the development of novel drugs for the treatment of pollen allergy are expected to provide manufacturers with lucrative future growth opportunities.
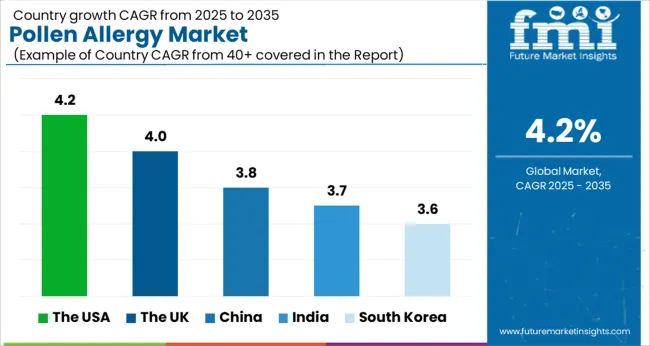
| Country | CAGR |
|---|---|
| The UK | 4.0% |
| India | 3.7% |
| South Korea | 3.6% |
| China | 3.8% |
| The USA | 4.2% |
Corticosteroids Segment Remains Dominant Among Other Types
Antihistamines, Decongestants, Corticosteroids, Mast Cell Stabilizers, Leukotriene Inhibitors, Nasal Anticholinergics, Immunomodulators, Auto injectable Epinephrine, and Immunotherapy are the key segments analyzed in the scope of the study.
Corticosteroids dominated the pollen allergy market in 2025 with a revenue share of 35.5%. Corticosteroids are mostly used as the first line of treatment and are also expected to contribute towards the aforementioned conclusion.
Whereas, calcineurin inhibitors are expected to grow at the fastest CAGR during the forecast period owing to their high response rate and the presence of a strong pipeline of calcineurin inhibitors and semi-synthetic analogs of these inhibitors.
Inhaled Allergen SignificantlyDominated the Market
Based on allergen type, the market is categorized into food, inhaled, drug, and others. Inhaled allergens led the global pollen allergy market in 2025 due to increased incidences of respiratory allergies across the globe. The segment is projected to expand further at the fastest CAGR owing to the high demand for allergy testing and the introduction of specific allergens for the detection of pollen allergy.
The drug allergies segment is also expected to register a strong CAGR of 3.8% from 2025 to 2035. Food allergies were the second-largest segment, in terms of revenue share, and are projected to continue the trend throughout the forecast years. Children are more susceptible to these types of allergic diseases. According to the estimates published by the USA National Institute of Health (NIH), the prevalence of food allergies among children is double that of adults.
With technological innovations happening at a rapid pace, and companies looking for ways to increase customer engagement, start-ups are taking all possible steps to establish a name for themselves in the pollen allergy market.
Some of the start-ups in the pollen allergy market include-
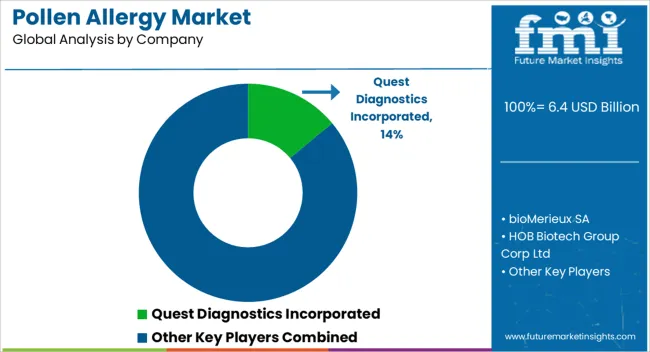
The professional survey study carefully analyses the operations and overview of the corporate structures and functioning of the leading and major manufacturers and players functional within the global pollen allergy market. It assesses its product offerings, financial outlook, sales, revenue, and growth over the forecast period.
Some of the leading manufacturers and players assessed in the global pollen allergy market are bioMerieux SA, HOB Biotech Group Corp Ltd, Alcon, HYCOR Biomedical, Inc, Immunomic Therapeutics, Quest Diagnostics Incorporated, Omega Diagnostics Group PLC, Siemens Healthcare Private Limited, Stallergenes Greer, Lincoln Diagnostics, Inc., and others
Manufacturers and players functional in the pollen allergy market are adopting various corporate growth strategies such as new product launches, mergers and acquisitions, and geographical expansion, among others.
| Report Attribute | Details |
|---|---|
| Growth Rate | CAGR 4.2% from 2025 to 2035 |
| Expected Market Value (2025) | USD 6.4 billion |
| ProjectedForecast Value (2035) | USD 9.6 billion |
| Base Year for Estimation | 2025 |
| Historical Data | 2020 to 2025 |
| Forecast Period | 2025 to 2035 |
| Quantitative Units | Revenue in USD Million & CAGR from 2025 to 2035 |
| Report Coverage | Revenue Forecast, Volume Forecast, Company Ranking, Competitive L&scape, Growth Factors, Trends & Pricing Analysis |
| Segments Covered | Product Type, Allergen Type, Therapeutics Drug Class, End-User, Regions |
| Regions Covered | North America; Latin America; Europe; South Asia; East Asia; Oceania; Middle East & Africa (MEA) |
| Key Countries Profiled | The USA, Canada, Brazil, Mexico, Germany, The UK, France, Spain, Italy, India, Malaysia, Singapore, Thailand, Australia, New Zealand, China, Japan, South Korea, GCC, South Africa, Israel |
| Key Companies Profiled | bioMerieux SA; HOB Biotech Group Corp Ltd; Alcon; HYCOR Biomedical, Inc; Immunomic Therapeutics; Quest Diagnostics Incorporated; Omega Diagnostics Group PLC; Siemens Healthcare Private Limited; Stallergenes Greer; Lincoln Diagnostics, Inc. |
| Customization | Available Upon Request |
The global pollen allergy market is estimated to be valued at USD 6.4 billion in 2025.
The market size for the pollen allergy market is projected to reach USD 9.6 billion by 2035.
The pollen allergy market is expected to grow at a 4.2% CAGR between 2025 and 2035.
The key product types in pollen allergy market are services, instruments and consumables.
In terms of allergen type, inhaled segment to command 48.5% share in the pollen allergy market in 2025.


Full Research Suite comprises of:
Market outlook & trends analysis
Interviews & case studies
Strategic recommendations
Vendor profiles & capabilities analysis
5-year forecasts
8 regions and 60+ country-level data splits
Market segment data splits
12 months of continuous data updates
DELIVERED AS:
PDF EXCEL ONLINE
Allergy Diagnostic Market Forecast and Outlook 2025 to 2035
Allergy Tester Market Size and Share Forecast Outlook 2025 to 2035
Allergy Immunotherapy Market Analysis - Size, Share & Forecast 2025 to 2035
Market Share Breakdown of Allergy Immunotherapy Providers
Allergy Treatment Market Analysis - Demand & Forecast 2024 to 2034
IgE Allergy Blood Tests Market Size, Growth, and Forecast 2025 to 2035
Food Allergy Market Size and Share Forecast Outlook 2025 to 2035
Food Allergy Immunotherapy Market Analysis Size and Share Forecast Outlook 2025 to 2035
Nasal Allergy Treatment Market Size and Share Forecast Outlook 2025 to 2035
Birch Allergy Treatment Market Analysis by Drug Class, Route of Administration, Distribution Channel and Region: Forecast from 2025 to 2035
Ocular Allergy Diagnostic System Market Size and Share Forecast Outlook 2025 to 2035
Seasonal Allergy Market Size and Share Forecast Outlook 2025 to 2035
Veterinary Allergy Diagnostics Market Size and Share Forecast Outlook 2025 to 2035
Needle Free Allergy Therapy Market Size and Share Forecast Outlook 2025 to 2035

Thank you!
You will receive an email from our Business Development Manager. Please be sure to check your SPAM/JUNK folder too.
Chat With
MaRIA