Reports

- Global Locations -

Headquarters

Future Market Insights, Inc.

Christiana Corporate, 200
Continental Drive, Suite 401,
Newark, Delaware - 19713,
United States

T: +1-845-579-5705

Americas

Future Market Insights, Inc.

616 Corporate Way, Suite 2-9018,
Valley Cottage, NY 10989, United States

T: +1-347-918-3531

MEA

Future Market Insights

1602-6 Jumeirah Bay X2 Tower, Plot No: JLT-PH2-X2A,
Jumeirah Lakes Towers, Dubai,
United Arab Emirates

Europe

Future Market Insights

3rd Floor, 207 Regent Street,
W1B 3HH London
United Kingdom

T: + 44 (0) 20 8123 9659
D: +44 (0) 20 3287 4268

Asia Pacific

Future Market Insights

IndiaLand Global Tech Park, Unit UG-1, Behind Grand HighStreet, Phase 1, Hinjawadi, MH, Pune – 411057, India

Allergy Diagnostics Market - Key Highlights from Report (2023 to 2033)

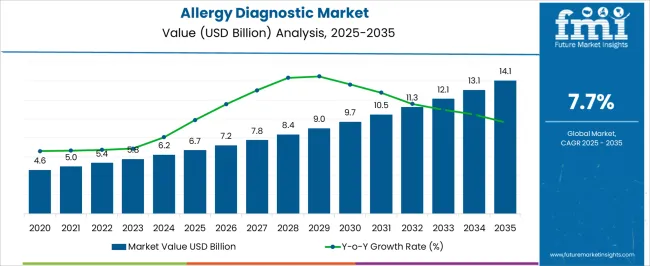
According to FMI, the global allergy diagnostics market is expected to grow at around 7.7% CAGR throughout the forecast period of 2023 to 2033. The USA and Canada currently lead the market for allergy diagnostics. Consistent growth throughout the assessment period can be attributed to the rising prevalence of food and drug allergies, the presence of developed infrastructure, and increasing consumer spending on healthcare.

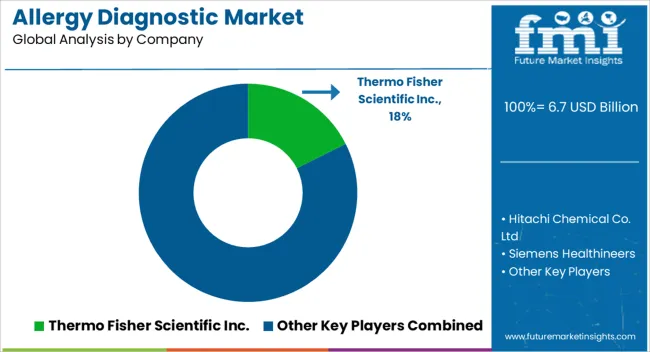
Diagnostic laboratories have emerged as leading end users of allergy diagnostics devices. Some of the major companies with allergy diagnostics devices are Hitachi Chemical Co., Ltd Thermo Fisher Scientific, Inc., Siemens Healthineers, Danaher Corporation, HOB Biotech Group Co, bioMérieux, Hycor Biomedical Inc. Stallergenes Greer, R-Biopharm AG, and Lincoln Diagnostics, Inc. among others.

Attributes Details
Allergy Diagnostics Market CAGR (2023 to 2033) 7.7%
Market Size for Allergy Diagnostics (2023) US$ 5.6 billion
Market Size for Allergy Diagnostics (2033) US$ 11.8 billion
Allergy Diagnostics Market Size Absolute Dollar Growth US$ 6.2 billion

Don't pay for what you don't need

Customize your report by selecting specific countries or regions and save 30%!

Allergy Diagnostics Market Future Outlook Brighter than 2017 to 2021 Historic Growth

According to the report by Future Market Insights, the demand for allergy diagnostics has been increasing significantly with the rising prevalence of asthma and hay fever across the globe. According to a report published by the World Health Organization, globally, around 262 million people are impacted by asthma, out of which 461,000 die from asthma.

Increasing air pollution and lack of awareness regarding food and drug allergy in emerging and poor countries are promoting major companies' allergy diagnostics devices towards developing cost-effective allergy diagnostics kits.

Attributes Details
CAGR % 2017 to 2022 9.6%
CAGR % 2023 to End of Forecast (2033) 7.7%

In the case of patients with severe asthma or other allergic reaction, virtual care and limited visiting methods were employed to restrict human contact and stop the virus transmission.

Rapid allergy molecule detection and diagnosis is a crucial parts of diagnostic services. The development of a fully automated immunoassay system used in the in-vitro assessment of allergen molecules will reduce the testing time and improve efficacy.

In the future, the market is anticipated to grow significantly, as the majority of diagnostic laboratories and hospitals are inclining towards automated allergy diagnostics for its high effectiveness. Canada and USA are likely to yield highly opportunistic prospects, contributing towards the overall expansion of the market.

Why Is Self-Diagnosis of Allergic Reaction Becoming Popular?

According to Food Allergy Organization, nearly 200,000 Americans are sent to the emergency room for severe food-related allergic reactions. The rising prevalence of allergic reactions, especially in children, coupled with long queues and waiting times and scarcity of allergy specialists in hospitals and laboratories, fueled the demand for self-diagnostic kits for allergy reactions.

User-friendly interface and ease of application are promoting the adoption of allergy diagnostics among home users. Market players are trying to make them readily available in the market by strengthening their supply chain channels leading to further allergy diagnostics market growth.

MyAllergyTest became the stepping stone in terms of the self-diagnosis domain as it is the first FDA-approved allergic reaction test kit capable of testing 10 different types of allergic reactions.

The introduction of cost-effective at-home food sensitivity and allergy diagnostics will boost the market growth in upcoming years. Such allergy diagnostics device applications will reduce the burden on hospitals and laboratories, culminating in reduced allergy diagnostic and medical costs.

Sabyasachi Ghosh
Sabyasachi Ghosh

Principal Consultant

Talk to Analyst

Find your sweet spots for generating winning opportunities in this market.

How is Surge in Allergic Asthma Cases Related with Air Pollution?

According to the American College of Allergy, Asthma, and Immunology, 6.1 million children and 20.4 million adults in the USA have asthma. The prevalence of asthma is on the higher side in children than in adults.

Increasing smoke and air pollution aggravates and triggers asthma attacks leading to hospitalization. Increasing air pollution and the rising prevalence of asthma in children has opened the doors for allergy diagnostics and market growth.

Self-operated inhaled allergen diagnostic kits are light, simple, and non-invasive allergy diagnostics tools. These devices perform rapid diagnostic tests eliminating the need for healthcare infrastructure.

According to National Center for Biotechnology Information, gaseous pollutants have pro-allergic immunologic effects triggering an allergic asthma attack. The market players are working towards finding protective responses to stress due to pollution and integrating it into developing allergy diagnostics for inhaled allergens.

Increasing innovation among market players towards developing rapid response allergy diagnostic kits will boost the market demand.

Constraints of Allergy Diagnostics Market

On the other side, it is also anticipated that the rising price of allergy diagnostic equipment to result in major constraints on allergy diagnostics market expansion over the projected time frame. The shortage of allergists, however, may present further difficulties for the development of the market in the near future.

Get the data you need at a Fraction of the cost

Personalize your report by choosing insights you need
and save 40%!

Comparative View of Adjacent Market

Allergy Diagnostics Market:

Attributes Allergy Diagnostics Market
CAGR (2023 to 2033) 7.7%
Market Value (2023) US$ 5.6 billion
Growth Factor As pollution levels rise, the market for allergy diagnostics is projected to surge.
Opportunity The presence of leading allergy diagnostic manufacturers who provide innovative allergy diagnostic tests is driving market growth.
Key Trends The surge in food allergies is expected to boost market growth for allergy diagnostics.

Egg Allergy Market:

Attributes Egg Allergy Market
CAGR (2023 to 2033) 7.22%
Market Value (2023) US$ 2642.14 million
Growth Factor Asthma instances are increasing, and new technologies are being developed propelling market expansion.
Opportunity Technological advances in treatment and diagnosis methods are projected to fuel market expansion.
Key Trends Advanced technology methods of detection and treatment will generate several prospects for the egg allergy market.

Allergy Treatment Market:

Attributes Allergy Treatment Market
CAGR (2023 to 2033) 6.53%
Market Value (2023) US$ 21.64 billion
Growth Factor Increasing frequency of various types of allergies
Opportunity Increase in the number of  Research and Development (R&D) activity
Key Trends Increasing investment in healthcare infrastructure

Country-wise Analysis

Country United States
HCAGR (2017 to 2022) 10.7%
CAGR (2023 to 2033) 7.1%
Country United Kingdom
HCAGR (2017 to 2022) 8.5%
CAGR (2023 to 2033) 6.7%
Country Japan
HCAGR (2017 to 2022) 8.4%
CAGR (2023 to 2033) 6.8%
Country China
HCAGR (2017 to 2022) 10.1%
CAGR (2023 to 2033) 7.2%
Country South Korea
HCAGR (2017 to 2022) 8.2%
CAGR (2023 to 2033) 6.4%

What are Allergy Diagnostics Market Drivers in the USA?

The allergy diagnostics market in the USA is anticipated to follow a positive growth trajectory during the forecast period due to growing cases of peanut, milk, and seafood allergies across the country.

According to a report published by the Asthma and Allergy Foundation of America, allergies affect around 50 million Americans every year, making it the sixth leading cause of chronic illness in the country.

Attributes Details
USA Market Size (2033) US$ 4.4 billion
USA Market Absolute Dollar Growth (US$ million/billion) US$ 2.2 billion

The rising incidence of drug allergy-related death will fuel the demand for faster and more efficient allergy diagnostics. Increasing incidences of skin allergies, especially eczema and skin inflammation, along with the high rate of allergic rhinitis (hay fever) in the black American population and boost the market in the USA as well as surge the demand for health tools for diagnosing allergic rhinitis.

Awareness initiatives undertaken by government and non-government organizations to limit food and drug allergy-related causalities are likely to positively influence the demand for allergy diagnostics in the healthcare sector.

Why is Canada Expected to Exhibit High Market Growth?

According to Food Allergy Canada, around 3 million Canadians are affected by at least one food allergy. Such a high prevalence of food allergies heightens the risk of anaphylaxis and other complications.

Growing instances of peanut allergies and food intolerance is likely to boost the demand for advanced allergy diagnostics.

The presence of advanced healthcare infrastructure, favorable government, and insurance policies, and increased per capita income are key allergy diagnostics market drivers in Canada.

As per the Adverse Drug Reaction Canada, adverse drug reaction claims around 22,000 lives every year, making it Canada’s fourth leading cause of death. The drug reactions also cost around US$13.7 billion to US$ 17.7 billion to the Canadian healthcare systems.

Rising government funding for effective treatment and genetic testing will accelerate product demand. With improved efficiency and elevated efficacy, healthy market growth is expected during the forecast period.

Why Is the Demand For Allergy Diagnostic Kits On Rise In the United Kingdom?

Attributes Details
United Kingdom Market Size (2033) US$ 507.6 million
United Kingdom Market Absolute Dollar Growth (US$ million/billion) US$ 242.6 million

According to Allergy United Kingdom, more than 20% of the British population is suffering from one or more allergic disorders. The report also states that nearly 44 % of adults suffer from a minimum of one allergy.

Increasing consumer spending habits on the healthcare system coupled with the presence of an advanced healthcare system will boost the allergy diagnostics market in the United Kingdom during the forecast period.

Increasing awareness regarding asthma and other allergic reactions like atopic eczema and hay fever will fuel the demand for allergy diagnostics.

Initiatives like World Asthma Day and Beat Asthma will elevate the demand for allergy diagnostics. Market players are working towards modifying allergy diagnostics to promote self-administration and cater to the demand for minimally invasive diagnostic measures.

How Lucrative is the Growth Opportunity in China?

Attributes Details
China Market Size (2033) US$ 819.8 million
China Market Absolute Dollar Growth (US$ million/billion) US$ 409.5 million

According to World Allergy Organization, in China, around 500 anaphylaxis-related death are reported every year. Increasing cases of food allergies will increase the chances of a person going into anaphylactic shock. Rapid advancement and modernization of healthcare centers in China will create lucrative market opportunities for allergy diagnostics.

Increasing per capita income and increased spending on healthcare will positively influence the allergy diagnostics market growth. Increasing government and private funding for spreading asthma awareness will boost allergy diagnostics market sales.

According to World Health Organization, around 24,281 deaths due to asthma were recorded in 2018. The increasing prevalence of asthma in the younger population, along with elevated air pollution levels, will provide momentum to the allergy diagnostics market growth.

What Factors are hindering the Allergy Diagnostics Market Growth in India?

The Indian market for allergy diagnostics is expected to grow at an elevated rate throughout the forecast period. As per the data from the National Health Portal of India, nearly 20% to 30% of the total population in India is affected by at least one type of allergy.

Low GDP and the presence of sub-optimal healthcare infrastructure are the main factors hindering market growth in India. The high prevalence of myths and stigmatic beliefs regarding asthma, coupled with a high rate of illiteracy, is restricting the allergy diagnostics market growth.

Limited income and the high cost of medicines are the main factors limiting the market growth in India. The scarcity of skilled professionals and allergy specialists and the absence of super-specialist training programs in Allergy and Immunology in the country are severely affecting the market growth. According to the National Institute of Health, around 37.5 million active cases of asthma are present in India. The report also states that around 40-50% of pediatric asthma cases in India are severe.

Limited availability of allergen-specific immunotherapy for allergic rhinitis and biologics for severe asthma and lack of high-quality allergen extracts for skin tests and adrenaline auto-injectors is curtailing the allergy diagnostics market growth in India.

The market scenario is expected to change in upcoming years owing to increasing government investment in healthcare infrastructure development. Improvement in foreign direct investment policies and rising awareness regarding asthma will create novel market opportunities for allergy diagnostics in India.

Allergy Diagnostics Market - Category-wise Insights

Segment Product Type
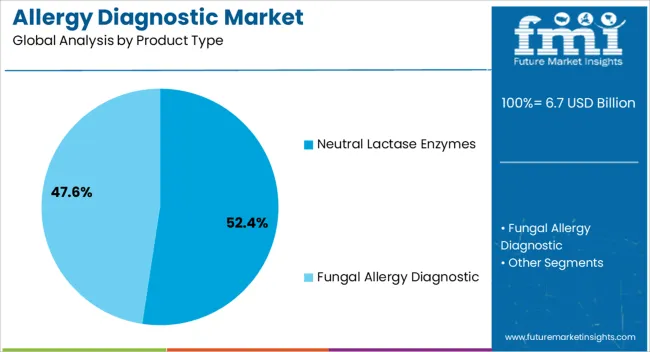
Top Sub-segment Fungal Allergy Diagnostic
CAGR (2017 to 2022) 9.1%
CAGR 2023 to 2033 6.9%
Segment Allergen Type
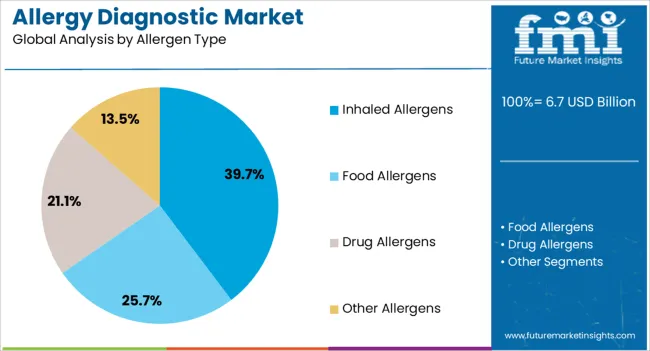
Top Sub-segment Inhaled Allergens
CAGR (2017 to 2022) 10.7%
CAGR 2023 to 2033 7.1%

Which End User Exhibits Higher Application of Allergy diagnostics?

Diagnostic laboratories are anticipated to generate the highest demand for allergy diagnostics throughout the forecast period. The rising prevalence of allergies and the increasing necessity for diagnostic kits will elevate the demand for allergy diagnostics and make it the dominating end-user of allergy diagnostics devices.

Why is Food Allergy Diagnostics Becoming Popular?

By allergen type, food allergy diagnostics are expected to generate tremendous forecast revenue in the allergy diagnostics market, attributed to the large population suffering from peanuts, shellfish, dairy products, and tree nuts. Moreover, the adoption of a home-based allergy diagnostics kit will help in monitoring the patient’s condition until help arrives, ultimately increasing the chances of survival.

What Opportunities are Prevalent in the Product Type Segment?

Demand for allergy diagnostics, especially fungal allergy diagnostics, is anticipated to be relatively strong amid the rising prevalence of mold and yeast allergy in the adult population. As the cases of allergy-induced asthma continue to rise, market players are looking to provide low-cost allergy testing kits to remote corners of the world.

Which Test Type Is Expected To Display Rapid Growth During Forecast Period?

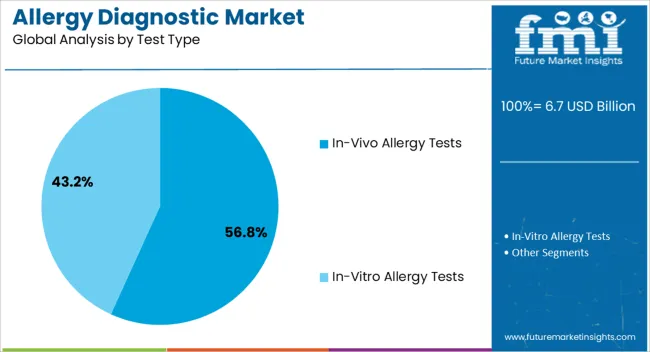
In-vitro allergy tests are anticipated to generate the highest demand throughout the forecast period. Rising demand for allergy diagnostics, i.e. minimal invasive testing and increasing pollution-related allergies, is likely to elevate the demand for in-vitro allergy tests.

Allergy Diagnostics Market - Competitive Landscape

The allergy diagnostics market is highly competitive owing to the presence of numerous established players. The manufacturers of allergy diagnostics devices are employing multiple marketing techniques to expand their global outreach. Allergy diagnostics market players are focusing towards employing organic and inorganic strategies to expand their global foothold.

Inorganic strategies include strategic mergers and acquisitions and forming an alliance with regional distributors to strengthen their supply chain channels. They are also emphasizing faster product approvals, product development and patenting.

Market top players of allergy diagnostics devices are also focusing on offering lucrative discounts and competitive pricing to increase their penetration in emerging markets.

For instance:

  • bioMérieux - Broad Range of Products

bioMérieux provides a broad range of products for allergy diagnostic. The product lineup includes VIDAS Allergy panels, mini VIDAS and VIDAS immunoassay analyzer systems. The VIDAS Allergy panels are implemented for food and respiratory allergy diagnostic.

  • STAT Medical - First Product Line

STAT Medical debuted its first product line in August 2022, with a series of easy at-home allergy test kits that allow anyone to screen themselves for a wide range of common food and respiratory allergies with a single finger prick.

  • Oncologica - A New Allergyfocus Test

Oncologica, a premier healthcare testing laboratory based in Cambridge, will debut a new Allergyfocus test in June 2022 to assist patients in determining which common global allergens their bodies react to.

  • Minaris Medical America, Inc. - Replaces Hitachi Chemical Diagnostics, Inc.

Minaris Medical America, Inc. has taken the place of Hitachi Chemical Diagnostics, Inc. as of 2021. By bringing the medical business group companies under the Minaris Medical brand, Hitachi intends to improve its position internationally and expand its commercial in-vitro diagnostics operations. Owner of both businesses is Showa Denko Materials Co., Ltd.

Future Market Insights has also analyzed the following top players of allergy diagnostics devices in its detailed report:

  • Hitachi Chemical Co. Ltd
  • Thermo Fisher Scientific Inc.
  • Siemens Healthineers
  • Danaher Corporation
  • HOB Biotech Group Co
  • bioMérieux
  • Hycor Biomedical Inc.
  • Stallergenes Greer
  • R-Biopharm AG
  • Lincoln Diagnostics Inc.

Key Segment

By Product Type:

  • Fungal Allergy Diagnostic
  • Neutral Lactase Enzymes

By Allergen Type:

  • Inhaled Allergens
  • Food Allergens
  • Drug Allergens
  • Other Allergens

By Test Type:

  • In-vivo allergy tests
  • In-vitro allergy tests

By End User:

  • Diagnostic Laboratories
  • Hospitals
  • Academic Research Institutes
  • Other End Users

By Region:

  • North America
  • Latin America
  • Europe
  • East Asia
  • South Asia
  • Middle East and Africa

Frequently Asked Questions

How is the Market Growing?

The market for allergy diagnostics is predicted to grow at CAGR of 7.7% through 2033.

Which Region Holds the Highest Revenue Potential in the Market?

North America holds the highest potential forecast revenue of allergy diagnostics market.

What is the Current Allergy Diagnostics Market Size?

The allergy diagnostics market size is anticipated to be over US$ 5.6 billion in 2023.

What is the Future Scope of Growth for the Market?

The market for allergy diagnostics is expected to surpass US$ 11.8 billion by 2033.

Table of Content

1. Executive Summary | Allergy Diagnostics Market

    1.1. Global Market Outlook

    1.2. Demand-side Trends

    1.3. Supply-side Trends

    1.4. Technology Roadmap Analysis

    1.5. Analysis and Recommendations

2. Market Overview

    2.1. Market Coverage / Taxonomy

    2.2. Market Definition / Scope / Limitations

3. Market Background

    3.1. Market Dynamics

        3.1.1. Drivers

        3.1.2. Restraints

        3.1.3. Opportunity

        3.1.4. Trends

    3.2. Scenario Forecast

        3.2.1. Demand in Optimistic Scenario

        3.2.2. Demand in Likely Scenario

        3.2.3. Demand in Conservative Scenario

    3.3. Opportunity Map Analysis

    3.4. Investment Feasibility Matrix

    3.5. PESTLE and Porter’s Analysis

    3.6. Regulatory Landscape

        3.6.1. By Key Regions

        3.6.2. By Key Countries

    3.7. Regional Parent Market Outlook

4. Global Market Analysis 2017 to 2022 and Forecast, 2023 to 2033

    4.1. Historical Market Size Value (US$ million) Analysis, 2017 to 2022

    4.2. Current and Future Market Size Value (US$ million) Projections, 2023 to 2033

        4.2.1. Y-o-Y Growth Trend Analysis

        4.2.2. Absolute $ Opportunity Analysis

5. Global Market Analysis 2017 to 2022 and Forecast 2023 to 2033, By Product Type

    5.1. Introduction / Key Findings

    5.2. Historical Market Size Value (US$ million) Analysis By Product Type, 2017 to 2022

    5.3. Current and Future Market Size Value (US$ million) Analysis and Forecast By Product Type, 2023 to 2033

        5.3.1. Fungal Allergy Diagnostic

        5.3.2. Neutral Lactase Enzymes

    5.4. Y-o-Y Growth Trend Analysis By Product Type, 2017 to 2022

    5.5. Absolute $ Opportunity Analysis By Product Type, 2023 to 2033

6. Global Market Analysis 2017 to 2022 and Forecast 2023 to 2033, By Allergen Type

    6.1. Introduction / Key Findings

    6.2. Historical Market Size Value (US$ million) Analysis By Allergen Type, 2017 to 2022

    6.3. Current and Future Market Size Value (US$ million) Analysis and Forecast By Allergen Type, 2023 to 2033

        6.3.1. Inhaled Allergens

        6.3.2. Food Allergens

        6.3.3. Drug Allergens

        6.3.4. Other Allergens

    6.4. Y-o-Y Growth Trend Analysis By Allergen Type, 2017 to 2022

    6.5. Absolute $ Opportunity Analysis By Allergen Type, 2023 to 2033

7. Global Market Analysis 2017 to 2022 and Forecast 2023 to 2033, By Test Type

    7.1. Introduction / Key Findings

    7.2. Historical Market Size Value (US$ million) Analysis By Test Type, 2017 to 2022

    7.3. Current and Future Market Size Value (US$ million) Analysis and Forecast By Test Type, 2023 to 2033

        7.3.1. In-vivo allergy Tests

        7.3.2. In-vitro allergy Tests

    7.4. Y-o-Y Growth Trend Analysis By Test Type, 2017 to 2022

    7.5. Absolute $ Opportunity Analysis By Test Type, 2023 to 2033

8. Global Market Analysis 2017 to 2022 and Forecast 2023 to 2033, By End User

    8.1. Introduction / Key Findings

    8.2. Historical Market Size Value (US$ million) Analysis By End User, 2017 to 2022

    8.3. Current and Future Market Size Value (US$ million) Analysis and Forecast By End User, 2023 to 2033

        8.3.1. Diagnostic Laboratories

        8.3.2. Hospitals

        8.3.3. Academic Research Institutes

        8.3.4. Other End Users

    8.4. Y-o-Y Growth Trend Analysis By End User, 2017 to 2022

    8.5. Absolute $ Opportunity Analysis By End User, 2023 to 2033

9. Global Market Analysis 2017 to 2022 and Forecast 2023 to 2033, By Region

    9.1. Introduction

    9.2. Historical Market Size Value (US$ million) Analysis By Region, 2017 to 2022

    9.3. Current Market Size Value (US$ million) Analysis and Forecast By Region, 2023 to 2033

        9.3.1. North America

        9.3.2. Latin America

        9.3.3. Europe

        9.3.4. East Asia

        9.3.5. South Asia & Pacific

        9.3.6. MEA

    9.4. Market Attractiveness Analysis By Region

10. North America Market Analysis 2017 to 2022 and Forecast 2023 to 2033, By Country

    10.1. Historical Market Size Value (US$ million) Trend Analysis By Market Taxonomy, 2017 to 2022

    10.2. Market Size Value (US$ million) Forecast By Market Taxonomy, 2023 to 2033

        10.2.1. By Country

            10.2.1.1. The USA

            10.2.1.2. Canada

        10.2.2. By Product Type

        10.2.3. By Allergen Type

        10.2.4. By Test Type

        10.2.5. By End User

    10.3. Market Attractiveness Analysis

        10.3.1. By Country

        10.3.2. By Product Type

        10.3.3. By Allergen Type

        10.3.4. By Test Type

        10.3.5. By End User

    10.4. Key Takeaways

11. Latin America Market Analysis 2017 to 2022 and Forecast 2023 to 2033, By Country

    11.1. Historical Market Size Value (US$ million) Trend Analysis By Market Taxonomy, 2017 to 2022

    11.2. Market Size Value (US$ million) Forecast By Market Taxonomy, 2023 to 2033

        11.2.1. By Country

            11.2.1.1. Brazil

            11.2.1.2. Mexico

            11.2.1.3. Rest of Latin America

        11.2.2. By Product Type

        11.2.3. By Allergen Type

        11.2.4. By Test Type

        11.2.5. By End User

    11.3. Market Attractiveness Analysis

        11.3.1. By Country

        11.3.2. By Product Type

        11.3.3. By Allergen Type

        11.3.4. By Test Type

        11.3.5. By End User

    11.4. Key Takeaways

12. Europe Market Analysis 2017 to 2022 and Forecast 2023 to 2033, By Country

    12.1. Historical Market Size Value (US$ million) Trend Analysis By Market Taxonomy, 2017 to 2022

    12.2. Market Size Value (US$ million) Forecast By Market Taxonomy, 2023 to 2033

        12.2.1. By Country

            12.2.1.1. Germany

            12.2.1.2. Italy

            12.2.1.3. France

            12.2.1.4. The United Kingdom

            12.2.1.5. Spain

            12.2.1.6. Rest of Europe

        12.2.2. By Product Type

        12.2.3. By Allergen Type

        12.2.4. By Test Type 

        12.2.5. By End User

    12.3. Market Attractiveness Analysis

        12.3.1. By Country

        12.3.2. By Product Type

        12.3.3. By Allergen Type

        12.3.4. By Test Type

        12.3.5. By End User

    12.4. Key Takeaways

13. East Asia Market Analysis 2017 to 2022 and Forecast 2023 to 2033, By Country

    13.1. Historical Market Size Value (US$ million) Trend Analysis By Market Taxonomy, 2017 to 2022

    13.2. Market Size Value (US$ million) Forecast By Market Taxonomy, 2023 to 2033

        13.2.1. By Country

            13.2.1.1. China

            13.2.1.2. Japan

            13.2.1.3. South Korea

        13.2.2. By Product Type

        13.2.3. By Allergen Type

        13.2.4. By Test Type

        13.2.5. By End User

    13.3. Market Attractiveness Analysis

        13.3.1. By Country

        13.3.2. By Product Type

        13.3.3. By Allergen Type

        13.3.4. By Test Type

        13.3.5. By End User

    13.4. Key Takeaways

14. South Asia & Pacific Market Analysis 2017 to 2022 and Forecast 2023 to 2033, By Country

    14.1. Historical Market Size Value (US$ million) Trend Analysis By Market Taxonomy, 2017 to 2022

    14.2. Market Size Value (US$ million) Forecast By Market Taxonomy, 2023 to 2033

        14.2.1. By Country

            14.2.1.1. India

            14.2.1.2. Malaysia

            14.2.1.3. Australia & New Zealand

            14.2.1.4. ASEAN

            14.2.1.5. Rest of South Asia & Pacific

        14.2.2. By Product Type

        14.2.3. By Allergen Type

        14.2.4. By Test Type

        14.2.5. By End User

    14.3. Market Attractiveness Analysis

        14.3.1. By Country

        14.3.2. By Product Type

        14.3.3. By Allergen Type

        14.3.4. By Test Type

        14.3.5. By End User

    14.4. Key Takeaways

15. MEA Market Analysis 2017 to 2022 and Forecast 2023 to 2033, By Country

    15.1. Historical Market Size Value (US$ million) Trend Analysis By Market Taxonomy, 2017 to 2022

    15.2. Market Size Value (US$ million) Forecast By Market Taxonomy, 2023 to 2033

        15.2.1. By Country

            15.2.1.1. GCC Countries

            15.2.1.2. South Africa

            15.2.1.3. Rest of Middle East and Africa (MEA)

        15.2.2. By Product Type

        15.2.3. By Allergen Type

        15.2.4. By Test Type

        15.2.5. By End User

    15.3. Market Attractiveness Analysis

        15.3.1. By Country

        15.3.2. By Product Type

        15.3.3. By Allergen Type

        15.3.4. By Test Type

        15.3.5. By End User

    15.4. Key Takeaways

16. Key Countries Market Analysis

    16.1. The USA

        16.1.1. Pricing Analysis

        16.1.2. Market Share Analysis, 2022

            16.1.2.1. By Product Type

            16.1.2.2. By Allergen Type

            16.1.2.3. By Test Type

            16.1.2.4. By End User

    16.2. Canada

        16.2.1. Pricing Analysis

        16.2.2. Market Share Analysis, 2022

            16.2.2.1. By Product Type

            16.2.2.2. By Allergen Type

            16.2.2.3. By Test Type

            16.2.2.4. By End User

    16.3. Brazil

        16.3.1. Pricing Analysis

        16.3.2. Market Share Analysis, 2022

            16.3.2.1. By Product Type

            16.3.2.2. By Allergen Type

            16.3.2.3. By Test Type

            16.3.2.4. By End User

    16.4. Mexico

        16.4.1. Pricing Analysis

        16.4.2. Market Share Analysis, 2022

            16.4.2.1. By Product Type

            16.4.2.2. By Allergen Type

            16.4.2.3. By Test Type

            16.4.2.4. By End User

    16.5. Germany

        16.5.1. Pricing Analysis

        16.5.2. Market Share Analysis, 2022

            16.5.2.1. By Product Type

            16.5.2.2. By Allergen Type

            16.5.2.3. By Test Type

            16.5.2.4. By End User

    16.6. Italy

        16.6.1. Pricing Analysis

        16.6.2. Market Share Analysis, 2022

            16.6.2.1. By Product Type

            16.6.2.2. By Allergen Type

            16.6.2.3. By Test Type

            16.6.2.4. By End User

    16.7. France

        16.7.1. Pricing Analysis

        16.7.2. Market Share Analysis, 2022

            16.7.2.1. By Product Type

            16.7.2.2. By Allergen Type

            16.7.2.3. By Test Type

            16.7.2.4. By End User

    16.8. The United Kingdom

        16.8.1. Pricing Analysis

        16.8.2. Market Share Analysis, 2022

            16.8.2.1. By Product Type

            16.8.2.2. By Allergen Type

            16.8.2.3. By Test Type

            16.8.2.4. By End User

    16.9. Spain

        16.9.1. Pricing Analysis

        16.9.2. Market Share Analysis, 2022

            16.9.2.1. By Product Type

            16.9.2.2. By Allergen Type

            16.9.2.3. By Test Type

            16.9.2.4. By End User

    16.10. China

        16.10.1. Pricing Analysis

        16.10.2. Market Share Analysis, 2022

            16.10.2.1. By Product Type

            16.10.2.2. By Allergen Type

            16.10.2.3. By Test Type

            16.10.2.4. By End User

    16.11. Japan

        16.11.1. Pricing Analysis

        16.11.2. Market Share Analysis, 2022

            16.11.2.1. By Product Type

            16.11.2.2. By Allergen Type

            16.11.2.3. By Test Type

            16.11.2.4. By End User

    16.12. South Korea

        16.12.1. Pricing Analysis

        16.12.2. Market Share Analysis, 2022

            16.12.2.1. By Product Type

            16.12.2.2. By Allergen Type

            16.12.2.3. By Test Type

            16.12.2.4. By End User

    16.13. India

        16.13.1. Pricing Analysis

        16.13.2. Market Share Analysis, 2022

            16.13.2.1. By Product Type

            16.13.2.2. By Allergen Type

            16.13.2.3. By Test Type

            16.13.2.4. By End User

    16.14. Malaysia

        16.14.1. Pricing Analysis

        16.14.2. Market Share Analysis, 2022

            16.14.2.1. By Product Type

            16.14.2.2. By Allergen Type

            16.14.2.3. By Test Type

            16.14.2.4. By End User

    16.15. Australia & New Zealand

        16.15.1. Pricing Analysis

        16.15.2. Market Share Analysis, 2022

            16.15.2.1. By Product Type

            16.15.2.2. By Allergen Type

            16.15.2.3. By Test Type

            16.15.2.4. By End User

    16.16. ASEAN

        16.16.1. Pricing Analysis

        16.16.2. Market Share Analysis, 2022

            16.16.2.1. By Product Type

            16.16.2.2. By Allergen Type

            16.16.2.3. By Test Type

            16.16.2.4. By End User

    16.17. GCC Countries

        16.17.1. Pricing Analysis

        16.17.2. Market Share Analysis, 2022

            16.17.2.1. By Product Type

            16.17.2.2. By Allergen Type

            16.17.2.3. By Test Type

            16.17.2.4. By End User

    16.18. South Africa

        16.18.1. Pricing Analysis

        16.18.2. Market Share Analysis, 2022

            16.18.2.1. By Product Type

            16.18.2.2. By Allergen Type

            16.18.2.3. By Test Type

            16.18.2.4. By End User

17. Market Structure Analysis

    17.1. Competition Dashboard

    17.2. Competition Benchmarking

    17.3. Market Share Analysis of Top Players

        17.3.1. By Regional

        17.3.2. By Product Type

        17.3.3. By Allergen Type

        17.3.4. By Test Type

        17.3.5. By End User

18. Competition Analysis

    18.1. Competition Deep Dive

        18.1.1. Hitachi Chemical Co., Ltd

            18.1.1.1. Overview

            18.1.1.2. Product Portfolio

            18.1.1.3. Profitability by Market Segments

            18.1.1.4. Sales Footprint

            18.1.1.5. Strategy Overview

                18.1.1.5.1. Marketing Strategy

        18.1.2. Thermo Fisher Scientific, Inc.

            18.1.2.1. Overview

            18.1.2.2. Product Portfolio

            18.1.2.3. Profitability by Market Segments

            18.1.2.4. Sales Footprint

            18.1.2.5. Strategy Overview

                18.1.2.5.1. Marketing Strategy

        18.1.3. Siemens Healthineers

            18.1.3.1. Overview

            18.1.3.2. Product Portfolio

            18.1.3.3. Profitability by Market Segments

            18.1.3.4. Sales Footprint

            18.1.3.5. Strategy Overview

                18.1.3.5.1. Marketing Strategy

        18.1.4. Danaher Corporation

            18.1.4.1. Overview

            18.1.4.2. Product Portfolio

            18.1.4.3. Profitability by Market Segments

            18.1.4.4. Sales Footprint

            18.1.4.5. Strategy Overview

                18.1.4.5.1. Marketing Strategy

        18.1.5. HOB Biotech Group Co

            18.1.5.1. Overview

            18.1.5.2. Product Portfolio

            18.1.5.3. Profitability by Market Segments

            18.1.5.4. Sales Footprint

            18.1.5.5. Strategy Overview

                18.1.5.5.1. Marketing Strategy

        18.1.6. bioMérieux

            18.1.6.1. Overview

            18.1.6.2. Product Portfolio

            18.1.6.3. Profitability by Market Segments

            18.1.6.4. Sales Footprint

            18.1.6.5. Strategy Overview

                18.1.6.5.1. Marketing Strategy

        18.1.7. Hycor Biomedical Inc.

            18.1.7.1. Overview

            18.1.7.2. Product Portfolio

            18.1.7.3. Profitability by Market Segments

            18.1.7.4. Sales Footprint

            18.1.7.5. Strategy Overview

                18.1.7.5.1. Marketing Strategy

        18.1.8. Stallergenes Greer

            18.1.8.1. Overview

            18.1.8.2. Product Portfolio

            18.1.8.3. Profitability by Market Segments

            18.1.8.4. Sales Footprint

            18.1.8.5. Strategy Overview

                18.1.8.5.1. Marketing Strategy

        18.1.9. R-Biopharm AG

            18.1.9.1. Overview

            18.1.9.2. Product Portfolio

            18.1.9.3. Profitability by Market Segments

            18.1.9.4. Sales Footprint

            18.1.9.5. Strategy Overview

                18.1.9.5.1. Marketing Strategy

        18.1.10. Lincoln Diagnostics, Inc.

            18.1.10.1. Overview

            18.1.10.2. Product Portfolio

            18.1.10.3. Profitability by Market Segments

            18.1.10.4. Sales Footprint

            18.1.10.5. Strategy Overview

                18.1.10.5.1. Marketing Strategy

19. Assumptions & Acronyms Used

20. Research Methodology

Don't pay for what you don't need

Customize your report by selecting specific countries or regions and save 30%!

List of Tables

Table 1: Global Market Value (US$ million) Forecast by Region, 2017 to 2033

Table 2: Global Market Value (US$ million) Forecast by Product Type, 2017 to 2033

Table 3: Global Market Value (US$ million) Forecast by Allergen Type, 2017 to 2033

Table 4: Global Market Value (US$ million) Forecast by Test Type, 2017 to 2033

Table 5: Global Market Value (US$ million) Forecast by End User, 2017 to 2033

Table 6: North America Market Value (US$ million) Forecast by Country, 2017 to 2033

Table 7: North America Market Value (US$ million) Forecast by Product Type, 2017 to 2033

Table 8: North America Market Value (US$ million) Forecast by Allergen Type, 2017 to 2033

Table 9: North America Market Value (US$ million) Forecast by Test Type, 2017 to 2033

Table 10: North America Market Value (US$ million) Forecast by End User, 2017 to 2033

Table 11: Latin America Market Value (US$ million) Forecast by Country, 2017 to 2033

Table 12: Latin America Market Value (US$ million) Forecast by Product Type, 2017 to 2033

Table 13: Latin America Market Value (US$ million) Forecast by Allergen Type, 2017 to 2033

Table 14: Latin America Market Value (US$ million) Forecast by Test Type, 2017 to 2033

Table 15: Latin America Market Value (US$ million) Forecast by End User, 2017 to 2033

Table 16: Europe Market Value (US$ million) Forecast by Country, 2017 to 2033

Table 17: Europe Market Value (US$ million) Forecast by Product Type, 2017 to 2033

Table 18: Europe Market Value (US$ million) Forecast by Allergen Type, 2017 to 2033

Table 19: Europe Market Value (US$ million) Forecast by Test Type, 2017 to 2033

Table 20: Europe Market Value (US$ million) Forecast by End User, 2017 to 2033

Table 21: East Asia Market Value (US$ million) Forecast by Country, 2017 to 2033

Table 22: East Asia Market Value (US$ million) Forecast by Product Type, 2017 to 2033

Table 23: East Asia Market Value (US$ million) Forecast by Allergen Type, 2017 to 2033

Table 24: East Asia Market Value (US$ million) Forecast by Test Type, 2017 to 2033

Table 25: East Asia Market Value (US$ million) Forecast by End User, 2017 to 2033

Table 26: South Asia & Pacific Market Value (US$ million) Forecast by Country, 2017 to 2033

Table 27: South Asia & Pacific Market Value (US$ million) Forecast by Product Type, 2017 to 2033

Table 28: South Asia & Pacific Market Value (US$ million) Forecast by Allergen Type, 2017 to 2033

Table 29: South Asia & Pacific Market Value (US$ million) Forecast by Test Type, 2017 to 2033

Table 30: South Asia & Pacific Market Value (US$ million) Forecast by End User, 2017 to 2033

Table 31: MEA Market Value (US$ million) Forecast by Country, 2017 to 2033

Table 32: MEA Market Value (US$ million) Forecast by Product Type, 2017 to 2033

Table 33: MEA Market Value (US$ million) Forecast by Allergen Type, 2017 to 2033

Table 34: MEA Market Value (US$ million) Forecast by Test Type, 2017 to 2033

Table 35: MEA Market Value (US$ million) Forecast by End User, 2017 to 2033
Sabyasachi Ghosh
Sabyasachi Ghosh

Principal Consultant

Talk to Analyst

Find your sweet spots for generating winning opportunities in this market.

List of Charts

Figure 1: Global Market Value (US$ million) by Product Type, 2023 to 2033

Figure 2: Global Market Value (US$ million) by Allergen Type, 2023 to 2033

Figure 3: Global Market Value (US$ million) by Test Type, 2023 to 2033

Figure 4: Global Market Value (US$ million) by End User, 2023 to 2033

Figure 5: Global Market Value (US$ million) by Region, 2023 to 2033

Figure 6: Global Market Value (US$ million) Analysis by Region, 2017 to 2033

Figure 7: Global Market Value Share (%) and BPS Analysis by Region, 2023 to 2033

Figure 8: Global Market Y-o-Y Growth (%) Projections by Region, 2023 to 2033

Figure 9: Global Market Value (US$ million) Analysis by Product Type, 2017 to 2033

Figure 10: Global Market Value Share (%) and BPS Analysis by Product Type, 2023 to 2033

Figure 11: Global Market Y-o-Y Growth (%) Projections by Product Type, 2023 to 2033

Figure 12: Global Market Value (US$ million) Analysis by Allergen Type, 2017 to 2033

Figure 13: Global Market Value Share (%) and BPS Analysis by Allergen Type, 2023 to 2033

Figure 14: Global Market Y-o-Y Growth (%) Projections by Allergen Type, 2023 to 2033

Figure 15: Global Market Value (US$ million) Analysis by Test Type, 2017 to 2033

Figure 16: Global Market Value Share (%) and BPS Analysis by Test Type, 2023 to 2033

Figure 17: Global Market Y-o-Y Growth (%) Projections by Test Type, 2023 to 2033

Figure 18: Global Market Value (US$ million) Analysis by End User, 2017 to 2033

Figure 19: Global Market Value Share (%) and BPS Analysis by End User, 2023 to 2033

Figure 20: Global Market Y-o-Y Growth (%) Projections by End User, 2023 to 2033

Figure 21: Global Market Attractiveness by Product Type, 2023 to 2033

Figure 22: Global Market Attractiveness by Allergen Type, 2023 to 2033

Figure 23: Global Market Attractiveness by Test Type, 2023 to 2033

Figure 24: Global Market Attractiveness by End User, 2023 to 2033

Figure 25: Global Market Attractiveness by Region, 2023 to 2033

Figure 26: North America Market Value (US$ million) by Product Type, 2023 to 2033

Figure 27: North America Market Value (US$ million) by Allergen Type, 2023 to 2033

Figure 28: North America Market Value (US$ million) by Test Type, 2023 to 2033

Figure 29: North America Market Value (US$ million) by End User, 2023 to 2033

Figure 30: North America Market Value (US$ million) by Country, 2023 to 2033

Figure 31: North America Market Value (US$ million) Analysis by Country, 2017 to 2033

Figure 32: North America Market Value Share (%) and BPS Analysis by Country, 2023 to 2033

Figure 33: North America Market Y-o-Y Growth (%) Projections by Country, 2023 to 2033

Figure 34: North America Market Value (US$ million) Analysis by Product Type, 2017 to 2033

Figure 35: North America Market Value Share (%) and BPS Analysis by Product Type, 2023 to 2033

Figure 36: North America Market Y-o-Y Growth (%) Projections by Product Type, 2023 to 2033

Figure 37: North America Market Value (US$ million) Analysis by Allergen Type, 2017 to 2033

Figure 38: North America Market Value Share (%) and BPS Analysis by Allergen Type, 2023 to 2033

Figure 39: North America Market Y-o-Y Growth (%) Projections by Allergen Type, 2023 to 2033

Figure 40: North America Market Value (US$ million) Analysis by Test Type, 2017 to 2033

Figure 41: North America Market Value Share (%) and BPS Analysis by Test Type, 2023 to 2033

Figure 42: North America Market Y-o-Y Growth (%) Projections by Test Type, 2023 to 2033

Figure 43: North America Market Value (US$ million) Analysis by End User, 2017 to 2033

Figure 44: North America Market Value Share (%) and BPS Analysis by End User, 2023 to 2033

Figure 45: North America Market Y-o-Y Growth (%) Projections by End User, 2023 to 2033

Figure 46: North America Market Attractiveness by Product Type, 2023 to 2033

Figure 47: North America Market Attractiveness by Allergen Type, 2023 to 2033

Figure 48: North America Market Attractiveness by Test Type, 2023 to 2033

Figure 49: North America Market Attractiveness by End User, 2023 to 2033

Figure 50: North America Market Attractiveness by Country, 2023 to 2033

Figure 51: Latin America Market Value (US$ million) by Product Type, 2023 to 2033

Figure 52: Latin America Market Value (US$ million) by Allergen Type, 2023 to 2033

Figure 53: Latin America Market Value (US$ million) by Test Type, 2023 to 2033

Figure 54: Latin America Market Value (US$ million) by End User, 2023 to 2033

Figure 55: Latin America Market Value (US$ million) by Country, 2023 to 2033

Figure 56: Latin America Market Value (US$ million) Analysis by Country, 2017 to 2033

Figure 57: Latin America Market Value Share (%) and BPS Analysis by Country, 2023 to 2033

Figure 58: Latin America Market Y-o-Y Growth (%) Projections by Country, 2023 to 2033

Figure 59: Latin America Market Value (US$ million) Analysis by Product Type, 2017 to 2033

Figure 60: Latin America Market Value Share (%) and BPS Analysis by Product Type, 2023 to 2033

Figure 61: Latin America Market Y-o-Y Growth (%) Projections by Product Type, 2023 to 2033

Figure 62: Latin America Market Value (US$ million) Analysis by Allergen Type, 2017 to 2033

Figure 63: Latin America Market Value Share (%) and BPS Analysis by Allergen Type, 2023 to 2033

Figure 64: Latin America Market Y-o-Y Growth (%) Projections by Allergen Type, 2023 to 2033

Figure 65: Latin America Market Value (US$ million) Analysis by Test Type, 2017 to 2033

Figure 66: Latin America Market Value Share (%) and BPS Analysis by Test Type, 2023 to 2033

Figure 67: Latin America Market Y-o-Y Growth (%) Projections by Test Type, 2023 to 2033

Figure 68: Latin America Market Value (US$ million) Analysis by End User, 2017 to 2033

Figure 69: Latin America Market Value Share (%) and BPS Analysis by End User, 2023 to 2033

Figure 70: Latin America Market Y-o-Y Growth (%) Projections by End User, 2023 to 2033

Figure 71: Latin America Market Attractiveness by Product Type, 2023 to 2033

Figure 72: Latin America Market Attractiveness by Allergen Type, 2023 to 2033

Figure 73: Latin America Market Attractiveness by Test Type, 2023 to 2033

Figure 74: Latin America Market Attractiveness by End User, 2023 to 2033

Figure 75: Latin America Market Attractiveness by Country, 2023 to 2033

Figure 76: Europe Market Value (US$ million) by Product Type, 2023 to 2033

Figure 77: Europe Market Value (US$ million) by Allergen Type, 2023 to 2033

Figure 78: Europe Market Value (US$ million) by Test Type, 2023 to 2033

Figure 79: Europe Market Value (US$ million) by End User, 2023 to 2033

Figure 80: Europe Market Value (US$ million) by Country, 2023 to 2033

Figure 81: Europe Market Value (US$ million) Analysis by Country, 2017 to 2033

Figure 82: Europe Market Value Share (%) and BPS Analysis by Country, 2023 to 2033

Figure 83: Europe Market Y-o-Y Growth (%) Projections by Country, 2023 to 2033

Figure 84: Europe Market Value (US$ million) Analysis by Product Type, 2017 to 2033

Figure 85: Europe Market Value Share (%) and BPS Analysis by Product Type, 2023 to 2033

Figure 86: Europe Market Y-o-Y Growth (%) Projections by Product Type, 2023 to 2033

Figure 87: Europe Market Value (US$ million) Analysis by Allergen Type, 2017 to 2033

Figure 88: Europe Market Value Share (%) and BPS Analysis by Allergen Type, 2023 to 2033

Figure 89: Europe Market Y-o-Y Growth (%) Projections by Allergen Type, 2023 to 2033

Figure 90: Europe Market Value (US$ million) Analysis by Test Type, 2017 to 2033

Figure 91: Europe Market Value Share (%) and BPS Analysis by Test Type, 2023 to 2033

Figure 92: Europe Market Y-o-Y Growth (%) Projections by Test Type, 2023 to 2033

Figure 93: Europe Market Value (US$ million) Analysis by End User, 2017 to 2033

Figure 94: Europe Market Value Share (%) and BPS Analysis by End User, 2023 to 2033

Figure 95: Europe Market Y-o-Y Growth (%) Projections by End User, 2023 to 2033

Figure 96: Europe Market Attractiveness by Product Type, 2023 to 2033

Figure 97: Europe Market Attractiveness by Allergen Type, 2023 to 2033

Figure 98: Europe Market Attractiveness by Test Type, 2023 to 2033

Figure 99: Europe Market Attractiveness by End User, 2023 to 2033

Figure 100: Europe Market Attractiveness by Country, 2023 to 2033

Figure 101: East Asia Market Value (US$ million) by Product Type, 2023 to 2033

Figure 102: East Asia Market Value (US$ million) by Allergen Type, 2023 to 2033

Figure 103: East Asia Market Value (US$ million) by Test Type, 2023 to 2033

Figure 104: East Asia Market Value (US$ million) by End User, 2023 to 2033

Figure 105: East Asia Market Value (US$ million) by Country, 2023 to 2033

Figure 106: East Asia Market Value (US$ million) Analysis by Country, 2017 to 2033

Figure 107: East Asia Market Value Share (%) and BPS Analysis by Country, 2023 to 2033

Figure 108: East Asia Market Y-o-Y Growth (%) Projections by Country, 2023 to 2033

Figure 109: East Asia Market Value (US$ million) Analysis by Product Type, 2017 to 2033

Figure 110: East Asia Market Value Share (%) and BPS Analysis by Product Type, 2023 to 2033

Figure 111: East Asia Market Y-o-Y Growth (%) Projections by Product Type, 2023 to 2033

Figure 112: East Asia Market Value (US$ million) Analysis by Allergen Type, 2017 to 2033

Figure 113: East Asia Market Value Share (%) and BPS Analysis by Allergen Type, 2023 to 2033

Figure 114: East Asia Market Y-o-Y Growth (%) Projections by Allergen Type, 2023 to 2033

Figure 115: East Asia Market Value (US$ million) Analysis by Test Type, 2017 to 2033

Figure 116: East Asia Market Value Share (%) and BPS Analysis by Test Type, 2023 to 2033

Figure 117: East Asia Market Y-o-Y Growth (%) Projections by Test Type, 2023 to 2033

Figure 118: East Asia Market Value (US$ million) Analysis by End User, 2017 to 2033

Figure 119: East Asia Market Value Share (%) and BPS Analysis by End User, 2023 to 2033

Figure 120: East Asia Market Y-o-Y Growth (%) Projections by End User, 2023 to 2033

Figure 121: East Asia Market Attractiveness by Product Type, 2023 to 2033

Figure 122: East Asia Market Attractiveness by Allergen Type, 2023 to 2033

Figure 123: East Asia Market Attractiveness by Test Type, 2023 to 2033

Figure 124: East Asia Market Attractiveness by End User, 2023 to 2033

Figure 125: East Asia Market Attractiveness by Country, 2023 to 2033

Figure 126: South Asia & Pacific Market Value (US$ million) by Product Type, 2023 to 2033

Figure 127: South Asia & Pacific Market Value (US$ million) by Allergen Type, 2023 to 2033

Figure 128: South Asia & Pacific Market Value (US$ million) by Test Type, 2023 to 2033

Figure 129: South Asia & Pacific Market Value (US$ million) by End User, 2023 to 2033

Figure 130: South Asia & Pacific Market Value (US$ million) by Country, 2023 to 2033

Figure 131: South Asia & Pacific Market Value (US$ million) Analysis by Country, 2017 to 2033

Figure 132: South Asia & Pacific Market Value Share (%) and BPS Analysis by Country, 2023 to 2033

Figure 133: South Asia & Pacific Market Y-o-Y Growth (%) Projections by Country, 2023 to 2033

Figure 134: South Asia & Pacific Market Value (US$ million) Analysis by Product Type, 2017 to 2033

Figure 135: South Asia & Pacific Market Value Share (%) and BPS Analysis by Product Type, 2023 to 2033

Figure 136: South Asia & Pacific Market Y-o-Y Growth (%) Projections by Product Type, 2023 to 2033

Figure 137: South Asia & Pacific Market Value (US$ million) Analysis by Allergen Type, 2017 to 2033

Figure 138: South Asia & Pacific Market Value Share (%) and BPS Analysis by Allergen Type, 2023 to 2033

Figure 139: South Asia & Pacific Market Y-o-Y Growth (%) Projections by Allergen Type, 2023 to 2033

Figure 140: South Asia & Pacific Market Value (US$ million) Analysis by Test Type, 2017 to 2033

Figure 141: South Asia & Pacific Market Value Share (%) and BPS Analysis by Test Type, 2023 to 2033

Figure 142: South Asia & Pacific Market Y-o-Y Growth (%) Projections by Test Type, 2023 to 2033

Figure 143: South Asia & Pacific Market Value (US$ million) Analysis by End User, 2017 to 2033

Figure 144: South Asia & Pacific Market Value Share (%) and BPS Analysis by End User, 2023 to 2033

Figure 145: South Asia & Pacific Market Y-o-Y Growth (%) Projections by End User, 2023 to 2033

Figure 146: South Asia & Pacific Market Attractiveness by Product Type, 2023 to 2033

Figure 147: South Asia & Pacific Market Attractiveness by Allergen Type, 2023 to 2033

Figure 148: South Asia & Pacific Market Attractiveness by Test Type, 2023 to 2033

Figure 149: South Asia & Pacific Market Attractiveness by End User, 2023 to 2033

Figure 150: South Asia & Pacific Market Attractiveness by Country, 2023 to 2033

Figure 151: MEA Market Value (US$ million) by Product Type, 2023 to 2033

Figure 152: MEA Market Value (US$ million) by Allergen Type, 2023 to 2033

Figure 153: MEA Market Value (US$ million) by Test Type, 2023 to 2033

Figure 154: MEA Market Value (US$ million) by End User, 2023 to 2033

Figure 155: MEA Market Value (US$ million) by Country, 2023 to 2033

Figure 156: MEA Market Value (US$ million) Analysis by Country, 2017 to 2033

Figure 157: MEA Market Value Share (%) and BPS Analysis by Country, 2023 to 2033

Figure 158: MEA Market Y-o-Y Growth (%) Projections by Country, 2023 to 2033

Figure 159: MEA Market Value (US$ million) Analysis by Product Type, 2017 to 2033

Figure 160: MEA Market Value Share (%) and BPS Analysis by Product Type, 2023 to 2033

Figure 161: MEA Market Y-o-Y Growth (%) Projections by Product Type, 2023 to 2033

Figure 162: MEA Market Value (US$ million) Analysis by Allergen Type, 2017 to 2033

Figure 163: MEA Market Value Share (%) and BPS Analysis by Allergen Type, 2023 to 2033

Figure 164: MEA Market Y-o-Y Growth (%) Projections by Allergen Type, 2023 to 2033

Figure 165: MEA Market Value (US$ million) Analysis by Test Type, 2017 to 2033

Figure 166: MEA Market Value Share (%) and BPS Analysis by Test Type, 2023 to 2033

Figure 167: MEA Market Y-o-Y Growth (%) Projections by Test Type, 2023 to 2033

Figure 168: MEA Market Value (US$ million) Analysis by End User, 2017 to 2033

Figure 169: MEA Market Value Share (%) and BPS Analysis by End User, 2023 to 2033

Figure 170: MEA Market Y-o-Y Growth (%) Projections by End User, 2023 to 2033

Figure 171: MEA Market Attractiveness by Product Type, 2023 to 2033

Figure 172: MEA Market Attractiveness by Allergen Type, 2023 to 2033

Figure 173: MEA Market Attractiveness by Test Type, 2023 to 2033

Figure 174: MEA Market Attractiveness by End User, 2023 to 2033

Figure 175: MEA Market Attractiveness by Country, 2023 to 2033

Recommendations

Healthcare

Allergy Treatment Market

Published : November 2022

Explore Healthcare Insights

View Reports

Allergy Diagnostics Market