Reports

- Global Locations -

Headquarters

Future Market Insights, Inc.

Christiana Corporate, 200
Continental Drive, Suite 401,
Newark, Delaware - 19713,
United States

T: +1-845-579-5705

Americas

Future Market Insights, Inc.

616 Corporate Way, Suite 2-9018,
Valley Cottage, NY 10989, United States

T: +1-347-918-3531

MEA

Future Market Insights

1602-6 Jumeirah Bay X2 Tower, Plot No: JLT-PH2-X2A,
Jumeirah Lakes Towers, Dubai,
United Arab Emirates

Europe

Future Market Insights

3rd Floor, 207 Regent Street,
W1B 3HH London
United Kingdom

T: + 44 (0) 20 8123 9659
D: +44 (0) 20 3287 4268

Asia Pacific

Future Market Insights

IndiaLand Global Tech Park, Unit UG-1, Behind Grand HighStreet, Phase 1, Hinjawadi, MH, Pune – 411057, India

Nasal Allergy Treatment Market Snapshot

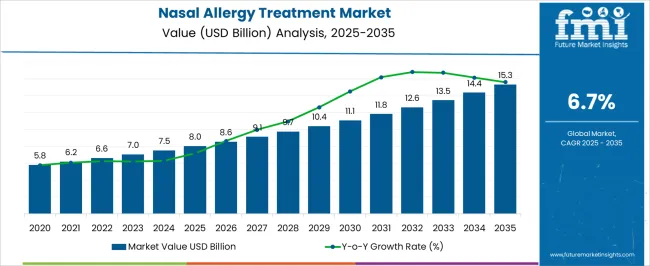
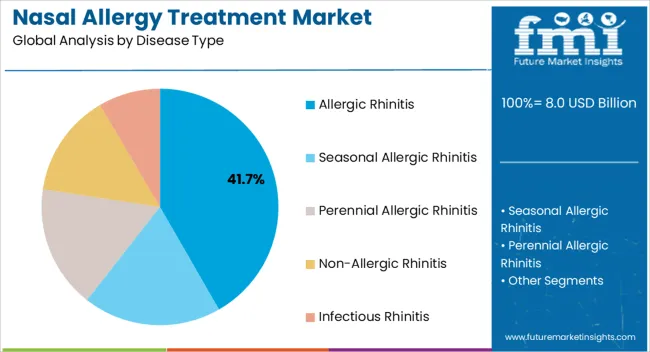
The global nasal allergy treatment market enjoys a valuation of US$ 6.6 Billion in 2022, and it is further projected to expand at a CAGR of 6.7% over the forecasted years. According to a recent study by Future Market Insights, allergic rhinitis by disease is leading the market with a share of about 65.8% in the year 2022, within the global market.

Market Outlook

Data Points Market Insights
Market Value 2022 US$ 6.6 Billion
Market Value 2033 US$ 13.3 Billion
CAGR 2023 to 2033 6.7%
Market Share of Top 5 Countries 62.1%
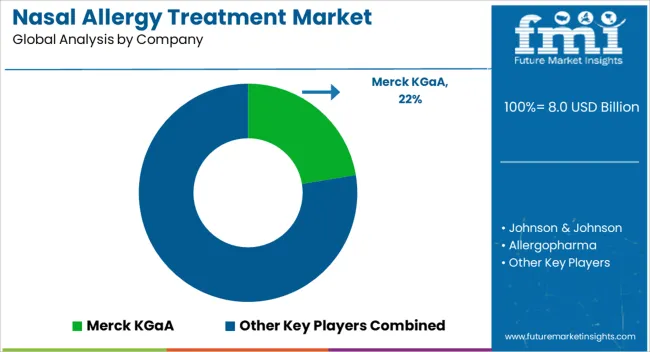
Key Market Players Merck KGaA, Johnson & Johnson, Allergopharma, Sanofi SA, McNeil Consumer Healthcare, Genentech Inc., GlaxoSmithKline PLC, Leti Pharma, Alerpharma S.A, Allergan, Inc., Meda Pharmaceuticals, Inc, Novartis International AG, Bausch Health Companies Inc., Allergopharma , ALK Abello, Stallergenes, Greer, Allergy Therapeutics, Aimmune Therapeutics, Biomay AG, HAL Allergy Group, Bayer, AstraZeneca

Nasal allergy, or allergic rhinitis (AR), a non-infectious inflammatory disease of the nasal mucosa following exposure to inhaled allergens in atopic patients, is mediated by IgE and involves a number of immune cells and cytokines. The currently available treatment options have increased due to a growing number of manufacturers identifying allergy as an area of interest and also with the help of a research and development team they are bringing in new innovative treatment and therapy options to the market. Although we are in the second wave of allergic diseases there is still a persistent amount of the population who suffer from nasal allergies.

Don't pay for what you don't need

Customize your report by selecting specific countries or regions and save 30%!

Sales Analysis of Nasal Allergy Treatment Market from 2018 to 2022 Vs Market Outlook for 2023 to 2033.

The global sales of the market are anticipated to rise at a CAGR of 6.7% between 2023 and 2033, owing to the rising prevalence of allergic diseases.

The global market holds around 32.6% share of the overall global allergy treatment market with a value of around US$ 20.2 Billion, in 2022.

The market is expanding as a result increase in the patient pool suffering from allergies. In fact, it is anticipated that the need for nasal allergy treatments would rise in the coming years due to the patient’s comfort and ease as it reduces inflammation, and remove congestion. The incidence rate and prevalence rate of allergic rhinitis are growing rapidly owing to which the demand for available treatments is expected to increase over the forecast period.

Some of the most popular therapies for nasal allergies are antihistamines, decongestants, nasal corticosteroids, allergen immunotherapy, and leukotriene receptor antagonists. Antihistamines rule the market, as it is one of the highly prescribed and adopted drugs for the treatment of allergies with or without prescription.

Owing to the above-mentioned factors, the global market is expected to grow at a prominent pace, and reach a valuation of around US$ 13.3 billion during the year 2033.

What are the Key Opportunities for the Manufacturers Operating in the Global Market?

Globally, the prevalence of hay fever/allergic rhinitis was registered at ~35%, which is gaining the attraction of manufacturers to develop a specific treatment for this indication. This creates an enormous opportunity for the manufacturer to explore the nasal allergy treatment market. The life science industry has set foot into the pharmaceutical industry giving rise to multiple biopharma companies that have proven technology and advanced treatment options that are exclusive and received approval, this gives healthcare specialists to rely upon these new treatment options.

For instance, the main method for treating people with sensitivities to aeroallergens is subcutaneous immunotherapy (SCIT). Subcutaneous immunotherapy (SCIT), a revolutionary treatment for allergic illnesses, reduces discomfort while modifying allergic disease by concentrating on the underlying immunological mechanism. In numerous well-controlled clinical trials, its effectiveness and safety have been proven in the treatment of allergies, allergic rhinitis/rhinoconjunctivitis, asthma, and hypersensitivity to stinging insects.

Overall, it is anticipated that the market for nasal allergy treatments will rise over the coming years as more research and development are put into creating fresh, efficient treatment choices.

Sabyasachi Ghosh
Sabyasachi Ghosh

Principal Consultant

Talk to Analyst

Find your sweet spots for generating winning opportunities in this market.

What are the Factors Restraining Demand within the Global Market?

The market is experiencing a decline due to the adverse effects associated with allergy shots and tablets.

  • For instance, more than 1.5% of the patients administering oral air experience adverse effects such as respiratory, gastrointestinal, or skin-related disorders.

Along with that, patients can experience minor effects such as redness or swelling at the injection site or effects on the entire body or particular body system. Along with that, rarely, a serious systemic reaction called anaphylaxis can develop.

In a few cases, people can experience systematic reactions such as hives, nasal congestion, watery eyes, and sneezing. More severe reactions may include wheezing or chest tightness and throat swelling. Rarely, allergy treatments can cause anaphylaxis, a potentially fatal reaction. It may result in low blood pressure and respiratory difficulties. An allergy shot can sometimes cause a significant reaction in a person. The majority of these can happen within 30 minutes of the injection.

The side effects associated with the treatment may hinder the market growth.
Country-wise Insights

What Makes the USA a Large Market for Nasal Allergy Treatment?

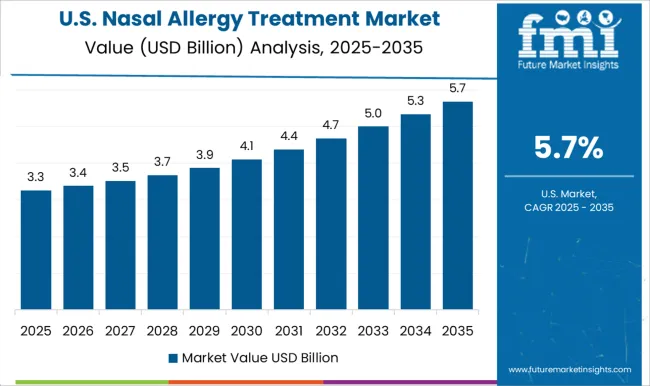
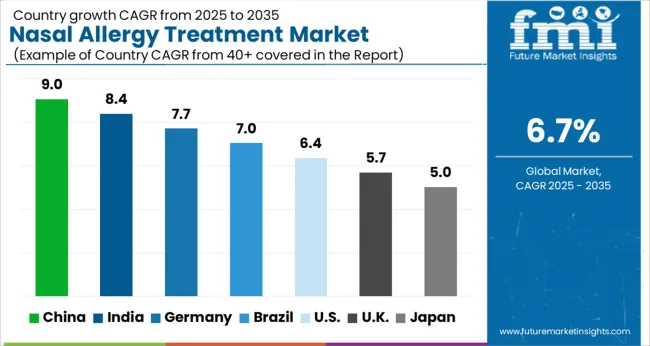
The USA dominates the North American region with a total market share of around 92.4% in 2022 and is expected to continue to maintain consistent growth over the entire projected period with a CAGR of 5.8%. The main drivers of nasal allergy prevalence in the United States include environmental factors such as air pollution, climate change, and exposure to allergens such as pollen and dust mites.

Allergies are the sixth most common chronic ailment in the United States, according to the American College of Allergy, Asthma & Immunology, with a cost of more than $18 billion annually. Each year, more than 50 million Americans experience allergic reactions. The frequency of AR was 19.9%, according to a recent large retrospective cohort study by Frontiers Media S.A. in the year 2023. According to the National Health Interview Survey done by the Centers for Disease Control and Prevention in 2018, 19.2 million adults in the US had hay fever (allergic rhinitis) in the previous 12 months.

Since the prevalence is high the manufacturer finds it lucrative to regulate in such a market, therefore this factor influences the nasal allergy treatment market in the most favorable manner in the USA market.

What is the Outlook of China in the Nasal Allergy Treatment Market?

China has a market share of 65.8% in the East Asia nasal allergy treatment market in 2022. Disease progression can be retarded by taking precautions such as diagnostic tests which include the provocation test, specific IgG4 test, tIgE test, and multiple other specific tests that can lead to successful treatment outcomes. China is focusing on improving its diagnosis to pace up into the global market.

For the prevention and treatment of allergic disorders, allergen detection is essential. Although China's technology is now lacking, many of the diagnostic gaps will soon be filled thanks to the development of new microparticle- and array-based methods.

To assist allergists and laboratory personnel in improving the diagnostic standard and directing the treatment of allergic illnesses for the benefit of patients and the market as a whole, this consensus summarizes the existing in vivo and in vitro diagnostic procedures for allergens.
What is the Scenario of Germany within the Nasal Allergy Treatment Market Space?

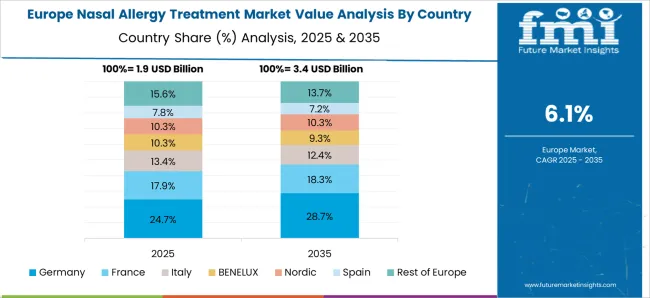
Germany holds a market share of 29.8% in 2022 in the European nasal allergy treatment market, owing to the presence of many established players in European countries.

Bencard Allergie, the German division of Allergy Therapeutics in the United Kingdom, which creates allergy vaccinations, was referenced by Labiotech UG in June 2022. The first allergoids for allergen-specific immunotherapies were marketed by a German business. With the use of virus-like particles, Allergy Therapeutics, and its affiliates are developing a novel method for allergy immunotherapy. Bencard appears to be in a strong position despite its opponents. According to a recent report from Allergy Therapeutics, Bencard contributes 60% of the company's revenues in Germany, which is where sales are growing the fastest.

Germany is strengthening its manufacturing and development of novel drugs which will positively grow the market in the future.

What Makes India a Highly Lucrative Market for Nasal Allergy Treatment?

India holds a share of around 48.6% in the South Asia market in 2022.

India has one of the highest levels of pollution, which is largely brought on by the use of mosquito coils and incense sticks indoors, and by outdoor, biomass, fossil fuels, and vehicle exhausts. According to Elsevier Inc., there are an estimated 37.5 million instances of asthma in India, and recent studies have indicated that the frequency of allergic rhinitis and asthma would rise in 2020.

Although India's prevalence rates are generally lower than those of high-income nations, there are still several million instances of the disease overall, according to various estimates. Indian manufacturers must therefore increase their supply of treatment drugs in order to handle such a sizable patient population.

Get the data you need at a Fraction of the cost

Personalize your report by choosing insights you need
and save 40%!

Category-wise Insights

Which Nasal Allergy Treatment Disease is driving the Market Growth?

Allergic rhinitis is expected to give high growth at a CAGR of 6.4% between 2023 and 2033. As per American Academy of Allergy Asthma and Immunology, 2022, allergic rhinitis affects almost 10-30% of the population worldwide. Additionally, sensitization to foreign proteins present in the environment affects upto 40% of the global population. In the geriatric population, rhinitis is less commonly allergic in nature. Hence the prevalence contributes to the global shares.

Which form is favored within the Global Market?

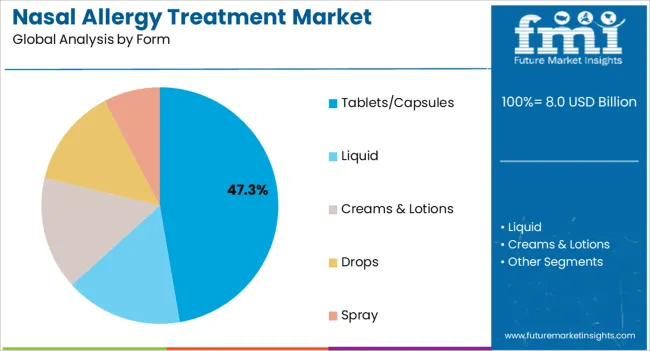
Tablets/Capsules are mostly favored by patients suffering from allergies. It has a market share of 37.1% in the global market in 2022.

The most popular sort of pill is a tablet. They encourage market growth since they are an affordable, secure, and efficient method of delivering oral medications. Tablets and capsules are frequently used by makers and formulators of drug products as a dosage form that is affordable.

Among OTC and Prescription which holds the dominant market share of the Global Market?

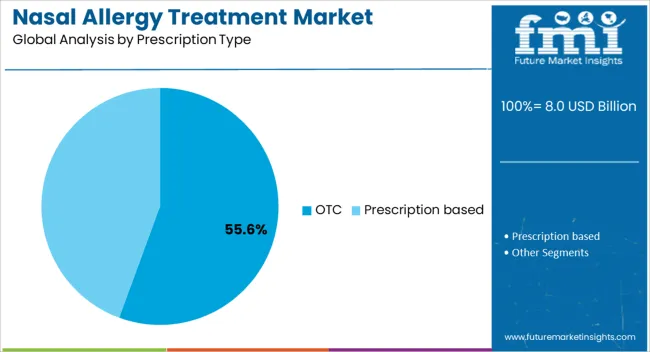
OTC has a market share of 76.3% in the global market in 2022. OTC medications are easier for customers to obtain because they are readily available and may be bought without a prescription. People aren't obliged to wait for medications to be filled or schedule appointments with doctors, which saves time and money. Because OTC drugs are typically less expensive than prescription drugs, more people can afford them.

Which is the preferred route of administration?

Oral route of administration is mostly preferred by patients. It has a market share of 36.6% in the global market in 2022.

Patients can take oral medications at home without the need for medical supervision because they are simple to administer. Patients who need long-term treatment for chronic diseases would especially benefit from this. Drugs used orally are frequently less expensive than medications taken orally or intravenously, which require more specialized equipment and medical supervision.

How Antihistamines is ahead of other treatments in Global Market?

Antihistamines have a market share of 46.0% in the global market in 2022. Since histamine, a substance secreted by the body in response to an allergen is blocked by antihistamines, they are frequently given for allergies. Sneezing, itching, and runny nose are examples of common allergic reaction symptoms that are brought on by histamine. A variety of allergic reactions, including as hay fever, allergic rhinitis, and hives, can be successfully treated with them.

Which Distribution Channel Benefits the Most from the Sales within the Market?

Hospital pharmacies hold a market share of 35.9% during the year 2022. The main locations where easily accessible licensed and approved medicine is found are hospitals. Hospital pharmacies may greatly enhance patient care by working together with doctors, nurses, and pharmacy teams to supply the appropriate medications and supplies in accordance with treatment procedures. The assurance of better patient outcomes aids hospitals in exceeding patient satisfaction targets. The segment is anticipated to grow at a profitable pace over the forecast period because of the comprehensive care provided in hospital settings.
Competitive Landscape

Increase in number of pipeline products and approval by the regulatory bodies, along with merger and acquisition by key players in different regions, are key differentiating strategies that nasal allergy treatment manufacturers are adopting.

  • In Aug 2018, two products from HAL Allergy Group received marketing clearance in Germany. They include SUBLIVAC® Birch 40.000 AUN/ml and SUBLIVAC® Trees 40.000 AUN/ml.
  • Nestle Health Science announced in August 2020 that it will purchase the food allergy product line of Aimmune Therapeutics, Inc. The agreement should be finalised by the fourth quarter of 2020.

Similarly, recent developments related to companies manufacturing nasal allergy treatment drugs have been tracked by the team at Future Market Insights. These are available in the full report.

Report Scope as per Nasal Allergy Treatment Industry Analysis

Attribute Details
Forecast Period 2018 to 2022
Historical Data Available for 2023 to 2033
Market Analysis US$ Million for Value
Key Regions Covered North America, Latin America, Europe, South Asia, East Asia, Oceania, and the Middle East & Africa
Key Countries Covered The USA, Canada, Brazil, Mexico, Argentina, the United kingdom, Germany, Italy, Russia, Spain, France, Benelux, India, Thailand, Indonesia, Malaysia, Japan, China, South Korea, Australia, New Zealand, Türkiye, GCC Countries, North Africa and South Africa
Key Market Segments Covered Disease Type, Form, Prescription Type, Route of Administration, Treatment, Distribution Channel and Region
Key Companies Profiled
  • Merck KGaA
  • Johnson & Johnson
  • Allergopharma
  • Sanofi SA
  • McNeil Consumer Healthcare,
  • Genentech Inc.
  • GlaxoSmithKline PLC
  • Leti Pharma,
  • Alerpharma S.A
  • Allergan, Inc.
  • Meda Pharmaceuticals, Inc
  • Novartis International AG
  • Bausch Health Companies Inc.
  • Allergopharma
  • ALK Abello
  • Stallergenes Greer
  • Allergy Therapeutics
  • Aimmune Therapeutics
  • Biomay AG
  • HAL Allergy Group
  • Bayer
  • AstraZeneca
Report Coverage Market Forecast, Competition Intelligence, DROT Analysis, Market Dynamics and Challenges, Strategic Growth Initiatives
Pricing Available upon Request

Key Market Segments Covered in the Nasal Allergy Treatment Industry Research

By Disease Type:

  • Allergic Rhinitis
  • Seasonal Allergic Rhinitis
  • Perennial Allergic Rhinitis
  • Non-Allergic Rhinitis
  • Infectious Rhinitis

By Form:

  • Tablets/Capsules
  • Liquid
  • Creams & Lotions
  • Drops
  • Spray

By Prescription Type:

  • OTC
  • Prescription based

By Route of Administration:

  • Oral
  • Intranasal
  • Sublingual
  • Sub Cutaneous
  • Intravenous

By Treatment:

  • Antihistamines
  • Decongestants
  • Nasal Corticosteroids
  • Allergen Immunotherapy
  • Leukotriene Receptor Antagonists

By Distribution Channel:

  • Hospital Pharmacies
  • Supermarkets/Hypermarkets
  • Online Pharmacies
  • Retail Pharmacies
  • Speciality Clinics
  • Others

Region:

  • North America
  • Latin America
  • Europe
  • South Asia
  • East Asia
  • Oceania
  • The Middle East and Africa (MEA)

Frequently Asked Questions

What is the Growth Potential of the Nasal Allergy Treatment Market?

The growth potential of the power nibbler market is 6.7% through 2033.

What Limits the Growth Potential of the Nasal Allergy Treatment Market?

Adverse effect of tablets is likely to limit market growth.

What is the North America’s Significant CAGR in 2023?

North America is likely to capture a CAGR of 5.8% in 2023.

Which Country is Fastest-growing in the Nasal Allergy Treatment Market in 2023?

The United States is estimated as the fastest-growing country.

Which Disease Type is Leading the Nasal Allergy Treatment Market in 2023?

Allergic rhinitis segment is leading the global market in 2023.

Table of Content

1. Executive Summary | Nasal Allergy Treatment Market

    1.1. Global Market Outlook

    1.2. Demand Side Trends

    1.3. Supply-Side Trends

    1.4. Analysis and Recommendations

2. Market Overview

    2.1. Market Coverage / Taxonomy

    2.2. Market Definition / Scope / Limitations

    2.3. Inclusions and Exclusions

3. Key Market Trends

    3.1. Key Trends Impacting the Market

    3.2. Product Innovation / Development Trends

4. Value Added Insights

    4.1. Disease Epidemiology

        4.1.1. Prevalence Population

        4.1.2. Diagnosed Prevalence Cases

        4.1.3. Gender Specific Cases

        4.1.4. Severity Specific Cases

    4.2. Annual Patient Volume of Disease Type for Key Countries

    4.3. Regulatory Landscape

    4.4. Patient Pool Suffering from Allergy

    4.5. Patient Treatment Journey

    4.6. Pipeline Assessment

    4.7. PESTLE Analysis

    4.8. Porter’s Analysis

5. Market Background

    5.1. Macro-Economic Factors

        5.1.1. Global GDP Growth Outlook

        5.1.2. Global Healthcare Expenditure Outlook

        5.1.3. Global Life Expectancy Outlook

        5.1.4. Pharmaceutical Spending

        5.1.5. Global Allergy Treatment Market Outlook

    5.2. Forecast Factors - Relevance & Impact

        5.2.1. Increase Prevalence of Allergy Rhinitis

        5.2.2. Diagnostic Rate (%)

        5.2.3. Treatment Seeking Rate (%)

        5.2.4. Cases treated with Nasal Allergies

        5.2.5. Overall Cost of Treatment

        5.2.6. Recent Advancements In Technology

        5.2.7. Regulatory Framework

        5.2.8. Key Strategic Developments By Market Players

        5.2.9. Adverse Effects May Impact the Market Growth

        5.2.10. Growing Investment in Healthcare Sector

    5.3. Market Dynamics

        5.3.1. Drivers

        5.3.2. Restraints

        5.3.3. Opportunity

6. COVID-19 Crisis – Impact Assessment

    6.1. COVID-19 and Impact Analysis

        6.1.1. Revenue By Disease Type

        6.1.2. Revenue By Form

        6.1.3. Revenue By Prescription Type

        6.1.4. Revenue By Route of Administration

        6.1.5. Revenue By Treatment

        6.1.6. Revenue By Distribution Channel

        6.1.7. Revenue By Country

    6.2. 2022 Market Scenario

7. Global Market Demand (in Value or Size in US$ Million) Analysis 2018 to 2022 and Forecast, 2023 to 2033

    7.1. Historical Market Value (US$ Million) Analysis, 2018 to 2022

    7.2. Current and Future Market Value (US$ Million) Projections, 2023 to 2033

        7.2.1. Y-o-Y Growth Trend Analysis

        7.2.2. Absolute $ Opportunity Analysis

8. Global Market Analysis 2018 to 2022 and Forecast 2023 to 2033, By Disease Type

    8.1. Introduction / Key Findings

    8.2. Historical Market Size (US$ Million) Analysis, By Disease Type, 2018 to 2022

    8.3. Current and Future Market Size (US$ Million) Analysis and Forecast By Disease Type, 2023 to 2033

        8.3.1. Allergic Rhinitis

        8.3.2. Seasonal Allergic Rhinitis

        8.3.3. Perennial Allergic Rhinitis

        8.3.4. Non-Allergic Rhinitis

        8.3.5. Infectious Rhinitis

    8.4. Market Attractiveness Analysis By Disease Type

9. Global Market Analysis 2018 to 2022 and Forecast 2023 to 2033, By Form

    9.1. Introduction / Key Findings

    9.2. Historical Market Size (US$ Million) Analysis, By Form, 2018 to 2022

    9.3. Current and Future Market Size (US$ Million) Analysis and Forecast By Form, 2023 to 2033

        9.3.1. Tablets/Capsules

        9.3.2. Liquid

        9.3.3. Creams & Lotions

        9.3.4. Drops

        9.3.5. Spray

    9.4. Market Attractiveness Analysis By Form

10. Global Market Analysis 2018 to 2022 and Forecast 2023 to 2033, By Prescription Type

    10.1. Introduction / Key Findings

    10.2. Historical Market Size (US$ Million) Analysis, By Prescription Type, 2018 to 2022

    10.3. Current and Future Market Size (US$ Million) Analysis and Forecast By Prescription Type, 2023 to 2033

        10.3.1. OTC

        10.3.2. Prescription based

    10.4. Market Attractiveness Analysis By Prescription Type

11. Global Market Analysis 2018 to 2022 and Forecast 2023 to 2033, By Route of Administration

    11.1. Introduction / Key Findings

    11.2. Historical Market Size (US$ Million) Analysis, By Route of Administration, 2018 to 2022

    11.3. Current and Future Market Size (US$ Million) Analysis and Forecast By Route of Administration, 2023 to 2033

        11.3.1. Oral

        11.3.2. Intranasal

        11.3.3. Sublingual

        11.3.4. Sub Cutaneous

        11.3.5. Intravenous

    11.4. Market Attractiveness Analysis By Route of Administration

12. Global Market Analysis 2018 to 2022 and Forecast 2023 to 2033, By Treatment

    12.1. Introduction / Key Findings

    12.2. Historical Market Size (US$ Million) Analysis, By Treatment, 2018 to 2022

    12.3. Current and Future Market Size (US$ Million) Analysis and Forecast By Treatment, 2023 to 2033

        12.3.1. Antihistamines

        12.3.2. Decongestants

        12.3.3. Nasal Corticosteroids

        12.3.4. Allergen Immunotherapy

        12.3.5. LeUnited kingdomotriene Receptor Antagonists

    12.4. Market Attractiveness Analysis By Treatment

13. Global Market Analysis 2018 to 2022 and Forecast 2023 to 2033, By Distribution Channel

    13.1. Introduction / Key Findings

    13.2. Historical Market Size (US$ Million) Analysis, By Distribution Channel, 2018 to 2022

    13.3. Current and Future Market Size (US$ Million) Analysis and Forecast By Distribution Channel, 2023 to 2033

        13.3.1. Hospital Pharmacies

        13.3.2. Supermarkets/Hypermarkets

        13.3.3. Online Pharmacies

        13.3.4. Retail Pharmacies

        13.3.5. Specialty Clinics

        13.3.6. Others

    13.4. Market Attractiveness Analysis By Distribution Channel

14. Global Market Analysis 2018 to 2022 and Forecast 2023 to 2033, By Region

    14.1. Introduction

    14.2. Historical Market Size (US$ Million) Analysis By Region, 2018 to 2022

    14.3. Current and Future Market Size (US$ Million) Analysis and Forecast By Region, 2023 to 2033

        14.3.1. North America

        14.3.2. Latin America

        14.3.3. Europe

        14.3.4. East Asia

        14.3.5. South Asia

        14.3.6. Oceania

        14.3.7. Middle East and Africa (MEA)

    14.4. Market Attractiveness Analysis By Region

15. North America Market Analysis 2018 to 2022 and Forecast 2023 to 2033

    15.1. Introduction

    15.2. Historical Market Size (US$ Million) Trend Analysis by Market Taxonomy, 2018 to 2022

    15.3. Current and Future Market Size (US$ Million) Analysis and Forecast by Market Taxonomy, 2023 to 2033

        15.3.1. By Country

            15.3.1.1. USA

            15.3.1.2. Canada

        15.3.2. By Disease Type

        15.3.3. By Form

        15.3.4. By Prescription Type

        15.3.5. By Route of Administration

        15.3.6. By Treatment

        15.3.7. By Distribution Channel

    15.4. Market Attractiveness Analysis

        15.4.1. By Country

        15.4.2. By Disease Type

        15.4.3. By Form

        15.4.4. By Prescription Type

        15.4.5. By Route of Administration

        15.4.6. By Treatment

        15.4.7. By Distribution Channel

    15.5. Market Trends

    15.6. Key Market Participants - Intensity Mapping

    15.7. Drivers and Restraints - Impact Analysis

    15.8. Country Level Analysis & Forecast

        15.8.1. USA Market Analysis

            15.8.1.1. Introduction

            15.8.1.2. Market Analysis and Forecast by Market Taxonomy

                15.8.1.2.1. By Disease Type

                15.8.1.2.2. By Form

                15.8.1.2.3. By Prescription Type

                15.8.1.2.4. By Route of Administration

                15.8.1.2.5. By Treatment

                15.8.1.2.6. By Distribution Channel

        15.8.2. Canada Market Analysis

            15.8.2.1. Introduction

            15.8.2.2. Market Analysis and Forecast by Market Taxonomy

                15.8.2.2.1. By Disease Type

                15.8.2.2.2. By Form

                15.8.2.2.3. By Prescription Type

                15.8.2.2.4. By Route of Administration

                15.8.2.2.5. By Treatment

                15.8.2.2.6. By Distribution Channel

16. Latin America Market Analysis 2018 to 2022 and Forecast 2023 to 2033

    16.1. Introduction

    16.2. Historical Market Size (US$ Million) Trend Analysis by Market Taxonomy, 2018 to 2022

    16.3. Current and Future Market Size (US$ Million) Analysis and Forecast by Market Taxonomy, 2023 to 2033

        16.3.1. By Country

            16.3.1.1. Mexico

            16.3.1.2. Brazil

            16.3.1.3. Argentina

            16.3.1.4. Rest of Latin America

        16.3.2. By Disease Type

        16.3.3. By Form

        16.3.4. By Prescription Type

        16.3.5. By Route of Administration

        16.3.6. By Treatment

        16.3.7. By Distribution Channel

    16.4. Market Attractiveness Analysis

        16.4.1. By Country

        16.4.2. By Disease Type

        16.4.3. By Form

        16.4.4. By Prescription Type

        16.4.5. By Route of Administration

        16.4.6. By Treatment

        16.4.7. By Distribution Channel

    16.5. Market Trends

    16.6. Key Market Participants - Intensity Mapping

    16.7. Drivers and Restraints - Impact Analysis

    16.8. Country Level Analysis & Forecast

        16.8.1. Mexico Market Analysis

            16.8.1.1. Introduction

            16.8.1.2. Market Analysis and Forecast by Market Taxonomy

                16.8.1.2.1. By Disease Type

                16.8.1.2.2. By Form

                16.8.1.2.3. By Prescription Type

                16.8.1.2.4. By Route of Administration

                16.8.1.2.5. By Treatment

                16.8.1.2.6. By Distribution Channel

        16.8.2. Brazil Market Analysis

            16.8.2.1. Introduction

            16.8.2.2. Market Analysis and Forecast by Market Taxonomy

                16.8.2.2.1. By Disease Type

                16.8.2.2.2. By Form

                16.8.2.2.3. By Prescription Type

                16.8.2.2.4. By Route of Administration

                16.8.2.2.5. By Treatment

                16.8.2.2.6. By Distribution Channel

        16.8.3. Argentina Market Analysis

            16.8.3.1. Introduction

            16.8.3.2. Market Analysis and Forecast by Market Taxonomy

                16.8.3.2.1. By Disease Type

                16.8.3.2.2. By Form

                16.8.3.2.3. By Prescription Type

                16.8.3.2.4. By Route of Administration

                16.8.3.2.5. By Treatment

                16.8.3.2.6. By Distribution Channel

17. Europe Market Analysis 2018 to 2022 and Forecast 2023 to 2033

    17.1. Introduction

    17.2. Historical Market Size (US$ Million) Trend Analysis by Market Taxonomy, 2018 to 2022

    17.3. Current and Future Market Size (US$ Million) Analysis and Forecast by Market Taxonomy, 2023 to 2033

        17.3.1. By Country

            17.3.1.1. United kingdom

            17.3.1.2. Germany

            17.3.1.3. France

            17.3.1.4. Italy

            17.3.1.5. Spain

            17.3.1.6. BENELUX

            17.3.1.7. Russia

            17.3.1.8. Nordics

            17.3.1.9. Rest of Europe

        17.3.2. By Disease Type

        17.3.3. By Form

        17.3.4. By Prescription Type

        17.3.5. By Route of Administration

        17.3.6. By Treatment

        17.3.7. By Distribution Channel

    17.4. Market Attractiveness Analysis

        17.4.1. By Country

        17.4.2. By Disease Type

        17.4.3. By Form

        17.4.4. By Prescription Type

        17.4.5. By Route of Administration

        17.4.6. By Treatment

        17.4.7. By Distribution Channel

    17.5. Market Trends

    17.6. Key Market Participants - Intensity Mapping

    17.7. Drivers and Restraints - Impact Analysis

    17.8. Country Level Analysis & Forecast

        17.8.1. U.K. Market Analysis

            17.8.1.1. Introduction

            17.8.1.2. Market Analysis and Forecast by Market Taxonomy

                17.8.1.2.1. By Disease Type

                17.8.1.2.2. By Form

                17.8.1.2.3. By Prescription Type

                17.8.1.2.4. By Route of Administration

                17.8.1.2.5. By Treatment

                17.8.1.2.6. By Distribution Channel

        17.8.2. Germany Market Analysis

            17.8.2.1. Introduction

            17.8.2.2. Market Analysis and Forecast by Market Taxonomy

                17.8.2.2.1. By Disease Type

                17.8.2.2.2. By Form

                17.8.2.2.3. By Prescription Type

                17.8.2.2.4. By Route of Administration

                17.8.2.2.5. By Treatment

                17.8.2.2.6. By Distribution Channel

        17.8.3. France Market Analysis

            17.8.3.1. Introduction

            17.8.3.2. Market Analysis and Forecast by Market Taxonomy

                17.8.3.2.1. By Disease Type

                17.8.3.2.2. By Form

                17.8.3.2.3. By Prescription Type

                17.8.3.2.4. By Route of Administration

                17.8.3.2.5. By Treatment

                17.8.3.2.6. By Distribution Channel

        17.8.4. Italy Market Analysis

            17.8.4.1. Introduction

            17.8.4.2. Market Analysis and Forecast by Market Taxonomy

                17.8.4.2.1. By Disease Type

                17.8.4.2.2. By Form

                17.8.4.2.3. By Prescription Type

                17.8.4.2.4. By Route of Administration

                17.8.4.2.5. By Treatment

                17.8.4.2.6. By Distribution Channel

        17.8.5. Spain Market Analysis

            17.8.5.1. Introduction

            17.8.5.2. Market Analysis and Forecast by Market Taxonomy

                17.8.5.2.1. By Disease Type

                17.8.5.2.2. By Form

                17.8.5.2.3. By Prescription Type

                17.8.5.2.4. By Route of Administration

                17.8.5.2.5. By Treatment

                17.8.5.2.6. By Distribution Channel

        17.8.6. BENELUX Market Analysis

            17.8.6.1. Introduction

            17.8.6.2. Market Analysis and Forecast by Market Taxonomy

                17.8.6.2.1. By Disease Type

                17.8.6.2.2. By Form

                17.8.6.2.3. By Prescription Type

                17.8.6.2.4. By Route of Administration

                17.8.6.2.5. By Treatment

                17.8.6.2.6. By Distribution Channel

        17.8.7. Russia Market Analysis

            17.8.7.1. Introduction

            17.8.7.2. Market Analysis and Forecast by Market Taxonomy

                17.8.7.2.1. By Disease Type

                17.8.7.2.2. By Form

                17.8.7.2.3. By Prescription Type

                17.8.7.2.4. By Route of Administration

                17.8.7.2.5. By Treatment

                17.8.7.2.6. By Distribution Channel

        17.8.8. Nordics Market Analysis

            17.8.8.1. Introduction

            17.8.8.2. Market Analysis and Forecast by Market Taxonomy

                17.8.8.2.1. By Disease Type

                17.8.8.2.2. By Form

                17.8.8.2.3. By Prescription Type

                17.8.8.2.4. By Route of Administration

                17.8.8.2.5. By Treatment

                17.8.8.2.6. By Distribution Channel

18. East Asia Market Analysis 2018 to 2022 and Forecast 2023 to 2033

    18.1. Introduction

    18.2. Historical Market Size (US$ Million) Trend Analysis by Market Taxonomy, 2018 to 2022

    18.3. Current and Future Market Size (US$ Million) Analysis and Forecast by Market Taxonomy, 2023 to 2033

        18.3.1. By Country

            18.3.1.1. China

            18.3.1.2. Japan

            18.3.1.3. South Korea

        18.3.2. By Disease Type

        18.3.3. By Form

        18.3.4. By Prescription Type

        18.3.5. By Route of Administration

        18.3.6. By Treatment

        18.3.7. By Distribution Channel

    18.4. Market Attractiveness Analysis

        18.4.1. By Country

        18.4.2. By Disease Type

        18.4.3. By Form

        18.4.4. By Prescription Type

        18.4.5. By Route of Administration

        18.4.6. By Treatment

        18.4.7. By Distribution Channel

    18.5. Market Trends

    18.6. Key Market Participants - Intensity Mapping

    18.7. Drivers and Restraints - Impact Analysis

    18.8. Country Level Analysis & Forecast

        18.8.1. China Market Analysis

            18.8.1.1. Introduction

            18.8.1.2. Market Analysis and Forecast by Market Taxonomy

                18.8.1.2.1. By Disease Type

                18.8.1.2.2. By Form

                18.8.1.2.3. By Prescription Type

                18.8.1.2.4. By Route of Administration

                18.8.1.2.5. By Treatment

                18.8.1.2.6. By Distribution Channel

        18.8.2. Japan Market Analysis

            18.8.2.1. Introduction

            18.8.2.2. Market Analysis and Forecast by Market Taxonomy

                18.8.2.2.1. By Disease Type

                18.8.2.2.2. By Form

                18.8.2.2.3. By Prescription Type

                18.8.2.2.4. By Route of Administration

                18.8.2.2.5. By Treatment

                18.8.2.2.6. By Distribution Channel

        18.8.3. South Korea Market Analysis

            18.8.3.1. Introduction

            18.8.3.2. Market Analysis and Forecast by Market Taxonomy

                18.8.3.2.1. By Disease Type

                18.8.3.2.2. By Form

                18.8.3.2.3. By Prescription Type

                18.8.3.2.4. By Route of Administration

                18.8.3.2.5. By Treatment

                18.8.3.2.6. By Distribution Channel

19. South Asia Market Analysis 2018 to 2022 and Forecast 2023 to 2033

    19.1. Introduction

    19.2. Historical Market Size (US$ Million) Trend Analysis by Market Taxonomy, 2018 to 2022

    19.3. Current and Future Market Size (US$ Million) Analysis and Forecast by Market Taxonomy, 2023 to 2033

        19.3.1. By Country

            19.3.1.1. India

            19.3.1.2. Malaysia

            19.3.1.3. Thailand

            19.3.1.4. Indonesia

            19.3.1.5. Philippines

            19.3.1.6. Vietnam

            19.3.1.7. Rest of South Asia

        19.3.2. By Disease Type

        19.3.3. By Form

        19.3.4. By Prescription Type

        19.3.5. By Route of Administration

        19.3.6. By Treatment

        19.3.7. By Distribution Channel

    19.4. Market Attractiveness Analysis

        19.4.1. By Country

        19.4.2. By Disease Type

        19.4.3. By Form

        19.4.4. By Prescription Type

        19.4.5. By Route of Administration

        19.4.6. By Treatment

        19.4.7. By Distribution Channel

    19.5. Market Trends

    19.6. Key Market Participants - Intensity Mapping

    19.7. Drivers and Restraints - Impact Analysis

    19.8. Country Level Analysis & Forecast

        19.8.1. India Market Analysis

            19.8.1.1. Introduction

            19.8.1.2. Market Analysis and Forecast by Market Taxonomy

                19.8.1.2.1. By Disease Type

                19.8.1.2.2. By Form

                19.8.1.2.3. By Prescription Type

                19.8.1.2.4. By Route of Administration

                19.8.1.2.5. By Treatment

                19.8.1.2.6. By Distribution Channel

        19.8.2. Malaysia Market Analysis

            19.8.2.1. Introduction

            19.8.2.2. Market Analysis and Forecast by Market Taxonomy

                19.8.2.2.1. By Disease Type

                19.8.2.2.2. By Form

                19.8.2.2.3. By Prescription Type

                19.8.2.2.4. By Route of Administration

                19.8.2.2.5. By Treatment

                19.8.2.2.6. By Distribution Channel

        19.8.3. Thailand Market Analysis

            19.8.3.1. Introduction

            19.8.3.2. Market Analysis and Forecast by Market Taxonomy

                19.8.3.2.1. By Disease Type

                19.8.3.2.2. By Form

                19.8.3.2.3. By Prescription Type

                19.8.3.2.4. By Route of Administration

                19.8.3.2.5. By Treatment

                19.8.3.2.6. By Distribution Channel

        19.8.4. Indonesia Market Analysis

            19.8.4.1. Introduction

            19.8.4.2. Market Analysis and Forecast by Market Taxonomy

                19.8.4.2.1. By Disease Type

                19.8.4.2.2. By Form

                19.8.4.2.3. By Prescription Type

                19.8.4.2.4. By Route of Administration

                19.8.4.2.5. By Treatment

                19.8.4.2.6. By Distribution Channel

        19.8.5. Philippines Market Analysis

            19.8.5.1. Introduction

            19.8.5.2. Market Analysis and Forecast by Market Taxonomy

                19.8.5.2.1. By Disease Type

                19.8.5.2.2. By Form

                19.8.5.2.3. By Prescription Type

                19.8.5.2.4. By Route of Administration

                19.8.5.2.5. By Treatment

                19.8.5.2.6. By Distribution Channel

        19.8.6. Vietnam Market Analysis

            19.8.6.1. Introduction

            19.8.6.2. Market Analysis and Forecast by Market Taxonomy

                19.8.6.2.1. By Disease Type

                19.8.6.2.2. By Form

                19.8.6.2.3. By Prescription Type

                19.8.6.2.4. By Route of Administration

                19.8.6.2.5. By Treatment

                19.8.6.2.6. By Distribution Channel

20. Oceania Market 2018 to 2022 and Forecast 2023 to 2033

    20.1. Introduction

    20.2. Historical Market Size (US$ Million) Trend Analysis by Market Taxonomy, 2018 to 2022

    20.3. Current and Future Market Size (US$ Million) Analysis and Forecast by Market Taxonomy, 2023 to 2033

        20.3.1. By Country

            20.3.1.1. Australia

            20.3.1.2. New Zealand

        20.3.2. By Disease Type

        20.3.3. By Form

        20.3.4. By Prescription Type

        20.3.5. By Route of Administration

        20.3.6. By Treatment

        20.3.7. By Distribution Channel

    20.4. Market Attractiveness Analysis

        20.4.1. By Country

        20.4.2. By Disease Type

        20.4.3. By Form

        20.4.4. By Prescription Type

        20.4.5. By Route of Administration

        20.4.6. By Treatment

        20.4.7. By Distribution Channel

    20.5. Market Trends

    20.6. Key Market Participants - Intensity Mapping

    20.7. Drivers and Restraints - Impact Analysis

    20.8. Country Level Analysis & Forecast

        20.8.1. Australia Market Analysis

            20.8.1.1. Introduction

            20.8.1.2. Market Analysis and Forecast by Market Taxonomy

                20.8.1.2.1. By Disease Type

                20.8.1.2.2. By Form

                20.8.1.2.3. By Prescription Type

                20.8.1.2.4. By Route of Administration

                20.8.1.2.5. By Treatment

                20.8.1.2.6. By Distribution Channel

        20.8.2. New Zealand Market Analysis

            20.8.2.1. Introduction

            20.8.2.2. Market Analysis and Forecast by Market Taxonomy

                20.8.2.2.1. By Disease Type

                20.8.2.2.2. By Form

                20.8.2.2.3. By Prescription Type

                20.8.2.2.4. By Route of Administration

                20.8.2.2.5. By Treatment

                20.8.2.2.6. By Distribution Channel

21. Middle East and Africa (MEA) Market Analysis 2018 to 2022 and Forecast 2023 to 2033

    21.1. Introduction

    21.2. Historical Market Size (US$ Million) Trend Analysis by Market Taxonomy, 2018 to 2022

    21.3. Current and Future Market Size (US$ Million) Analysis and Forecast by Market Taxonomy, 2023 to 2033

        21.3.1. By Country

            21.3.1.1. GCC Countries

            21.3.1.2. Türkiye

            21.3.1.3. South Africa

            21.3.1.4. Israel

            21.3.1.5. North Africa

            21.3.1.6. Rest of Middle East and Africa

        21.3.2. By Disease Type

        21.3.3. By Form

        21.3.4. By Prescription Type

        21.3.5. By Route of Administration

        21.3.6. By Treatment

        21.3.7. By Distribution Channel

    21.4. Market Attractiveness Analysis

        21.4.1. By Country

        21.4.2. By Disease Type

        21.4.3. By Form

        21.4.4. By Prescription Type

        21.4.5. By Route of Administration

        21.4.6. By Treatment

        21.4.7. By Distribution Channel

    21.5. Market Trends

    21.6. Key Market Participants - Intensity Mapping

    21.7. Drivers and Restraints - Impact Analysis

    21.8. Country Level Analysis & Forecast

        21.8.1. GCC Countries Market Analysis

            21.8.1.1. Introduction

            21.8.1.2. Market Analysis and Forecast by Market Taxonomy

                21.8.1.2.1. By Disease Type

                21.8.1.2.2. By Form

                21.8.1.2.3. By Prescription Type

                21.8.1.2.4. By Route of Administration

                21.8.1.2.5. By Treatment

                21.8.1.2.6. By Distribution Channel

        21.8.2. Türkiye Market Analysis

            21.8.2.1. Introduction

            21.8.2.2. Market Analysis and Forecast by Market Taxonomy

                21.8.2.2.1. By Disease Type

                21.8.2.2.2. By Form

                21.8.2.2.3. By Prescription Type

                21.8.2.2.4. By Route of Administration

                21.8.2.2.5. By Treatment

                21.8.2.2.6. By Distribution Channel

        21.8.3. South Africa Market Analysis

            21.8.3.1. Introduction

            21.8.3.2. Market Analysis and Forecast by Market Taxonomy

                21.8.3.2.1. By Disease Type

                21.8.3.2.2. By Form

                21.8.3.2.3. By Prescription Type

                21.8.3.2.4. By Route of Administration

                21.8.3.2.5. By Treatment

                21.8.3.2.6. By Distribution Channel

        21.8.4. Israel Market Analysis

            21.8.4.1. Introduction

            21.8.4.2. Market Analysis and Forecast by Market Taxonomy

                21.8.4.2.1. By Disease Type

                21.8.4.2.2. By Form

                21.8.4.2.3. By Prescription Type

                21.8.4.2.4. By Route of Administration

                21.8.4.2.5. By Treatment

                21.8.4.2.6. By Distribution Channel

        21.8.5. North Africa Market Analysis

            21.8.5.1. Introduction

            21.8.5.2. Market Analysis and Forecast by Market Taxonomy

                21.8.5.2.1. By Disease Type

                21.8.5.2.2. By Form

                21.8.5.2.3. By Prescription Type

                21.8.5.2.4. By Route of Administration

                21.8.5.2.5. By Treatment

                21.8.5.2.6. By Distribution Channel

22. Market Structure Analysis

    22.1. Market Analysis by Tier of Companies

    22.2. Market Share Analysis of Top Players

    22.3. Market Presence Analysis

23. Competition Analysis

    23.1. Competition Dashboard

    23.2. Key Development Analysis

    23.3. Branding and Promotional Strategies, by Manufacturers

    23.4. Competition Deep Dive

        23.4.1. Merck KGaA

            23.4.1.1. Overview

            23.4.1.2. Product Portfolio

            23.4.1.3. Key Financials

            23.4.1.4. SWOT Analysis

            23.4.1.5. Key Developments

            23.4.1.6. Sales Footprint

            23.4.1.7. Strategy Overview

                23.4.1.7.1. Marketing Strategies

                23.4.1.7.2. Product Strategies

                23.4.1.7.3. Channel Strategies

        23.4.2. Johnson & Johnson

            23.4.2.1. Overview

            23.4.2.2. Product Portfolio

            23.4.2.3. Key Financials

            23.4.2.4. SWOT Analysis

            23.4.2.5. Key Developments

            23.4.2.6. Sales Footprint

            23.4.2.7. Strategy Overview

                23.4.2.7.1. Marketing Strategies

                23.4.2.7.2. Product Strategies

                23.4.2.7.3. Channel Strategies

        23.4.3. Allergopharma

            23.4.3.1. Overview

            23.4.3.2. Product Portfolio

            23.4.3.3. Key Financials

            23.4.3.4. SWOT Analysis

            23.4.3.5. Key Developments

            23.4.3.6. Sales Footprint

            23.4.3.7. Strategy Overview

                23.4.3.7.1. Marketing Strategies

                23.4.3.7.2. Product Strategies

                23.4.3.7.3. Channel Strategies

        23.4.4. Sanofi SA

            23.4.4.1. Overview

            23.4.4.2. Product Portfolio

            23.4.4.3. Key Financials

            23.4.4.4. SWOT Analysis

            23.4.4.5. Key Developments

            23.4.4.6. Sales Footprint

            23.4.4.7. Strategy Overview

                23.4.4.7.1. Marketing Strategies

                23.4.4.7.2. Product Strategies

                23.4.4.7.3. Channel Strategies

        23.4.5. McNeil Consumer Healthcare,

            23.4.5.1. Overview

            23.4.5.2. Product Portfolio

            23.4.5.3. Key Financials

            23.4.5.4. SWOT Analysis

            23.4.5.5. Key Developments

            23.4.5.6. Sales Footprint

            23.4.5.7. Strategy Overview

                23.4.5.7.1. Marketing Strategies

                23.4.5.7.2. Product Strategies

                23.4.5.7.3. Channel Strategies

        23.4.6. Genentech Inc.

            23.4.6.1. Overview

            23.4.6.2. Product Portfolio

            23.4.6.3. Key Financials

            23.4.6.4. SWOT Analysis

            23.4.6.5. Key Developments

            23.4.6.6. Sales Footprint

            23.4.6.7. Strategy Overview

                23.4.6.7.1. Marketing Strategies

                23.4.6.7.2. Product Strategies

                23.4.6.7.3. Channel Strategies

        23.4.7. GlaxoSmithKline PLC

            23.4.7.1. Overview

            23.4.7.2. Product Portfolio

            23.4.7.3. Key Financials

            23.4.7.4. SWOT Analysis

            23.4.7.5. Key Developments

            23.4.7.6. Sales Footprint

            23.4.7.7. Strategy Overview

                23.4.7.7.1. Marketing Strategies

                23.4.7.7.2. Product Strategies

                23.4.7.7.3. Channel Strategies

        23.4.8. Leti Pharma,

            23.4.8.1. Overview

            23.4.8.2. Product Portfolio

            23.4.8.3. Key Financials

            23.4.8.4. SWOT Analysis

            23.4.8.5. Key Developments

            23.4.8.6. Sales Footprint

            23.4.8.7. Strategy Overview

                23.4.8.7.1. Marketing Strategies

                23.4.8.7.2. Product Strategies

                23.4.8.7.3. Channel Strategies

        23.4.9. Alerpharma S.A

            23.4.9.1. Overview

            23.4.9.2. Product Portfolio

            23.4.9.3. Key Financials

            23.4.9.4. SWOT Analysis

            23.4.9.5. Key Developments

            23.4.9.6. Sales Footprint

            23.4.9.7. Strategy Overview

                23.4.9.7.1. Marketing Strategies

                23.4.9.7.2. Product Strategies

                23.4.9.7.3. Channel Strategies

        23.4.10. Allergan, Inc.

            23.4.10.1. Overview

            23.4.10.2. Product Portfolio

            23.4.10.3. Key Financials

            23.4.10.4. SWOT Analysis

            23.4.10.5. Key Developments

            23.4.10.6. Sales Footprint

            23.4.10.7. Strategy Overview

                23.4.10.7.1. Marketing Strategies

                23.4.10.7.2. Product Strategies

                23.4.10.7.3. Channel Strategies

        23.4.11. Meda Pharmaceuticals, Inc

            23.4.11.1. Overview

            23.4.11.2. Product Portfolio

            23.4.11.3. Key Financials

            23.4.11.4. SWOT Analysis

            23.4.11.5. Key Developments

            23.4.11.6. Sales Footprint

            23.4.11.7. Strategy Overview

                23.4.11.7.1. Marketing Strategies

                23.4.11.7.2. Product Strategies

                23.4.11.7.3. Channel Strategies

        23.4.12. Novartis International AG

            23.4.12.1. Overview

            23.4.12.2. Product Portfolio

            23.4.12.3. Key Financials

            23.4.12.4. SWOT Analysis

            23.4.12.5. Key Developments

            23.4.12.6. Sales Footprint

            23.4.12.7. Strategy Overview

                23.4.12.7.1. Marketing Strategies

                23.4.12.7.2. Product Strategies

                23.4.12.7.3. Channel Strategies

        23.4.13. Bausch Health Companies Inc.

            23.4.13.1. Overview

            23.4.13.2. Product Portfolio

            23.4.13.3. Key Financials

            23.4.13.4. SWOT Analysis

            23.4.13.5. Key Developments

            23.4.13.6. Sales Footprint

            23.4.13.7. Strategy Overview

                23.4.13.7.1. Marketing Strategies

                23.4.13.7.2. Product Strategies

                23.4.13.7.3. Channel Strategies

        23.4.14. Allergopharma

            23.4.14.1. Overview

            23.4.14.2. Product Portfolio

            23.4.14.3. Key Financials

            23.4.14.4. SWOT Analysis

            23.4.14.5. Key Developments

            23.4.14.6. Sales Footprint

            23.4.14.7. Strategy Overview

                23.4.14.7.1. Marketing Strategies

                23.4.14.7.2. Product Strategies

                23.4.14.7.3. Channel Strategies

        23.4.15. ALK Abello

            23.4.15.1. Overview

            23.4.15.2. Product Portfolio

            23.4.15.3. Key Financials

            23.4.15.4. SWOT Analysis

            23.4.15.5. Key Developments

            23.4.15.6. Sales Footprint

            23.4.15.7. Strategy Overview

                23.4.15.7.1. Marketing Strategies

                23.4.15.7.2. Product Strategies

                23.4.15.7.3. Channel Strategies

        23.4.16. Stallergenes Greer

            23.4.16.1. Overview

            23.4.16.2. Product Portfolio

            23.4.16.3. Key Financials

            23.4.16.4. SWOT Analysis

            23.4.16.5. Key Developments

            23.4.16.6. Sales Footprint

            23.4.16.7. Strategy Overview

                23.4.16.7.1. Marketing Strategies

                23.4.16.7.2. Product Strategies

                23.4.16.7.3. Channel Strategies

        23.4.17. Allergy Therapeutics

            23.4.17.1. Overview

            23.4.17.2. Product Portfolio

            23.4.17.3. Key Financials

            23.4.17.4. SWOT Analysis

            23.4.17.5. Key Developments

            23.4.17.6. Sales Footprint

            23.4.17.7. Strategy Overview

                23.4.17.7.1. Marketing Strategies

                23.4.17.7.2. Product Strategies

                23.4.17.7.3. Channel Strategies

        23.4.18. Aimmune Therapeutics

            23.4.18.1. Overview

            23.4.18.2. Product Portfolio

            23.4.18.3. Key Financials

            23.4.18.4. SWOT Analysis

            23.4.18.5. Key Developments

            23.4.18.6. Sales Footprint

            23.4.18.7. Strategy Overview

                23.4.18.7.1. Marketing Strategies

                23.4.18.7.2. Product Strategies

                23.4.18.7.3. Channel Strategies

        23.4.19. Biomay AG

            23.4.19.1. Overview

            23.4.19.2. Product Portfolio

            23.4.19.3. Key Financials

            23.4.19.4. SWOT Analysis

            23.4.19.5. Key Developments

            23.4.19.6. Sales Footprint

            23.4.19.7. Strategy Overview

                23.4.19.7.1. Marketing Strategies

                23.4.19.7.2. Product Strategies

                23.4.19.7.3. Channel Strategies

        23.4.20. HAL Allergy Group

            23.4.20.1. Overview

            23.4.20.2. Product Portfolio

            23.4.20.3. Key Financials

            23.4.20.4. SWOT Analysis

            23.4.20.5. Key Developments

            23.4.20.6. Sales Footprint

            23.4.20.7. Strategy Overview

                23.4.20.7.1. Marketing Strategies

                23.4.20.7.2. Product Strategies

                23.4.20.7.3. Channel Strategies

        23.4.21. Bayer

            23.4.21.1. Overview

            23.4.21.2. Product Portfolio

            23.4.21.3. Key Financials

            23.4.21.4. SWOT Analysis

            23.4.21.5. Key Developments

            23.4.21.6. Sales Footprint

            23.4.21.7. Strategy Overview

                23.4.21.7.1. Marketing Strategies

                23.4.21.7.2. Product Strategies

                23.4.21.7.3. Channel Strategies

        23.4.22. AstraZeneca

            23.4.22.1. Overview

            23.4.22.2. Product Portfolio

            23.4.22.3. Key Financials

            23.4.22.4. SWOT Analysis

            23.4.22.5. Key Developments

            23.4.22.6. Sales Footprint

            23.4.22.7. Strategy Overview

                23.4.22.7.1. Marketing Strategies

                23.4.22.7.2. Product Strategies

                23.4.22.7.3. Channel Strategies

24. Assumptions and Acronyms Used

25. Research Methodolog

List of Tables

Table 01: Global Market Value (US$ Million) Analysis 2018 to 2022 and Forecast 2023 to 2033, By Disease Type

Table 02: Global Market Value (US$ Million) Analysis 2018 to 2022 and Forecast 2023 to 2033, By Form

Table 03: Global Market Value (US$ Million) Analysis 2018 to 2022 and Forecast 2023 to 2033, By Prescription Type

Table 04: Global Market Value (US$ Million) Analysis 2018 to 2022 and Forecast 2023 to 2033, By Route of Administration

Table 05: Global Market Value (US$ Million) Analysis 2018 to 2022 and Forecast 2023 to 2033, By Treatment

Table 06: Global Market Value (US$ Million) Analysis 2018 to 2022 and Forecast 2023 to 2033, By Distribution Channel

Table 07: Global Market Value (US$ Million) Analysis 2018 to 2022 and Forecast 2023 to 2033, By Region

Table 08: North America Market Value (US$ Million) Analysis 2018 to 2022 and Forecast 2023 to 2033, By Country

Table 09: North America Market Value (US$ Million) Analysis 2018 to 2022 and Forecast 2023 to 2033, By Disease Type

Table 10: North America Market Value (US$ Million) Analysis 2018 to 2022 and Forecast 2023 to 2033, By Form

Table 11: North America Market Value (US$ Million) Analysis 2018 to 2022 and Forecast 2023 to 2033, By Prescription Type

Table 12: North America Market Value (US$ Million) Analysis 2018 to 2022 and Forecast 2023 to 2033, By Route of Administration

Table 13: North America Market Value (US$ Million) Analysis 2018 to 2022 and Forecast 2023 to 2033, By Treatment

Table 14: North America Market Value (US$ Million) Analysis 2018 to 2022 and Forecast 2023 to 2033, By Distribution Channel

Table 15: Latin America Market Value (US$ Million) Analysis 2018 to 2022 and Forecast 2023 to 2033, By Country

Table 16: Latin America Market Value (US$ Million) Analysis 2018 to 2022 and Forecast 2023 to 2033, By Disease Type

Table 17: Latin America Market Value (US$ Million) Analysis 2018 to 2022 and Forecast 2023 to 2033, By Form

Table 18: Latin America Market Value (US$ Million) Analysis 2018 to 2022 and Forecast 2023 to 2033, By Prescription Type

Table 19: Latin America Market Value (US$ Million) Analysis 2018 to 2022 and Forecast 2023 to 2033, By Route of Administration

Table 20: Latin America Market Value (US$ Million) Analysis 2018 to 2022 and Forecast 2023 to 2033, By Treatment

Table 21: Latin America Market Value (US$ Million) Analysis 2018 to 2022 and Forecast 2023 to 2033, By Distribution Channel

Table 22: Europe Market Value (US$ Million) Analysis 2018 to 2022 and Forecast 2023 to 2033, By Country

Table 23: Europe Market Value (US$ Million) Analysis 2018 to 2022 and Forecast 2023 to 2033, By Disease Type

Table 24: Europe Market Value (US$ Million) Analysis 2018 to 2022 and Forecast 2023 to 2033, By Form

Table 25: Europe Market Value (US$ Million) Analysis 2018 to 2022 and Forecast 2023 to 2033, By Prescription Type

Table 26: Europe Market Value (US$ Million) Analysis 2018 to 2022 and Forecast 2023 to 2033, By Route of Administration

Table 27: Europe Market Value (US$ Million) Analysis 2018 to 2022 and Forecast 2023 to 2033, By Treatment

Table 28: Europe Market Value (US$ Million) Analysis 2018 to 2022 and Forecast 2023 to 2033, By Distribution Channel

Table 29: East Asia Market Value (US$ Million) Analysis 2018 to 2022 and Forecast 2023 to 2033, By Country

Table 30: East Asia Market Value (US$ Million) Analysis 2018 to 2022 and Forecast 2023 to 2033, By Disease Type

Table 31: East Asia Market Value (US$ Million) Analysis 2018 to 2022 and Forecast 2023 to 2033, By Form

Table 32: East Asia Market Value (US$ Million) Analysis 2018 to 2022 and Forecast 2023 to 2033, By Prescription Type

Table 33: East Asia Market Value (US$ Million) Analysis 2018 to 2022 and Forecast 2023 to 2033, By Route of Administration

Table 34: East Asia Market Value (US$ Million) Analysis 2018 to 2022 and Forecast 2023 to 2033, By Treatment

Table 35: East Asia Market Value (US$ Million) Analysis 2018 to 2022 and Forecast 2023 to 2033, By Distribution Channel

Table 36: South Asia Market Value (US$ Million) Analysis 2018 to 2022 and Forecast 2023 to 2033, By Country

Table 37: South Asia Market Value (US$ Million) Analysis 2018 to 2022 and Forecast 2023 to 2033, By Disease Type

Table 38: South Asia Market Value (US$ Million) Analysis 2018 to 2022 and Forecast 2023 to 2033, By Form

Table 39: South Asia Market Value (US$ Million) Analysis 2018 to 2022 and Forecast 2023 to 2033, By Prescription Type

Table 40: South Asia Market Value (US$ Million) Analysis 2018 to 2022 and Forecast 2023 to 2033, By Route of Administration

Table 41: South Asia Market Value (US$ Million) Analysis 2018 to 2022 and Forecast 2023 to 2033, By Treatment

Table 42: South Asia Market Value (US$ Million) Analysis 2018 to 2022 and Forecast 2023 to 2033, By Distribution Channel

Table 43: Oceania Market Value (US$ Million) Analysis 2018 to 2022 and Forecast 2023 to 2033, By Country

Table 44: Oceania Market Value (US$ Million) Analysis 2018 to 2022 and Forecast 2023 to 2033, By Disease Type

Table 45: Oceania Market Value (US$ Million) Analysis 2018 to 2022 and Forecast 2023 to 2033, By Form

Table 46: Oceania Market Value (US$ Million) Analysis 2018 to 2022 and Forecast 2023 to 2033, By Prescription Type

Table 47: Oceania Market Value (US$ Million) Analysis 2018 to 2022 and Forecast 2023 to 2033, By Route of Administration

Table 48: Oceania Market Value (US$ Million) Analysis 2018 to 2022 and Forecast 2023 to 2033, By Treatment

Table 49: Oceania Market Value (US$ Million) Analysis 2018 to 2022 and Forecast 2023 to 2033, By Distribution Channel

Table 50: Middle East & Africa Market Value (US$ Million) Analysis 2018 to 2022 and Forecast 2023 to 2033, By Country

Table 51: Middle East & Africa Market Value (US$ Million) Analysis 2018 to 2022 and Forecast 2023 to 2033, By Disease Type

Table 52: Middle East & Africa Market Value (US$ Million) Analysis 2018 to 2022 and Forecast 2023 to 2033, By Form

Table 53: Middle East & Africa Market Value (US$ Million) Analysis 2018 to 2022 and Forecast 2023 to 2033, By Prescription Type

Table 54: Middle East & Africa Market Value (US$ Million) Analysis 2018 to 2022 and Forecast 2023 to 2033, By Route of Administration

Table 55: Middle East & Africa Market Value (US$ Million) Analysis 2018 to 2022 and Forecast 2023 to 2033, By Treatment

Table 56: Middle East & Africa Market Value (US$ Million) Analysis 2018 to 2022 and Forecast 2023 to 2033, By Distribution Channel

List of Charts

Figure 01: Global Market Value (US$ Million) Analysis, 2018 to 2022

Figure 02: Global Market Forecast & Y-O-Y Growth, 2023 to 2033

Figure 03: Global Market Absolute $ Opportunity (US$ Million) Analysis, 2022 to 2033

Figure 04: Global Market Value Share (%) Analysis 2023 and 2033, By Disease Type

Figure 05: Global Market Y-O-Y Growth (%) Analysis 2022 to 2033, By Disease Type

Figure 06: Global Market Attractiveness Analysis 2023 to 2033, By Disease Type

Figure 07: Global Market Value Share (%) Analysis 2023 and 2033, By Form

Figure 08: Global Market Y-O-Y Growth (%) Analysis 2022 to 2033, By Form

Figure 09: Global Market Attractiveness Analysis 2023 to 2033, By Form

Figure 10: Global Market Value Share (%) Analysis 2023 and 2033, By Prescription Type

Figure 11: Global Market Y-O-Y Growth (%) Analysis 2022 to 2033, By Prescription Type

Figure 12: Global Market Attractiveness Analysis 2023 to 2033, By Prescription Type

Figure 13: Global Market Value Share (%) Analysis 2023 and 2033, By Route of Administration

Figure 14: Global Market Y-O-Y Growth (%) Analysis 2022 to 2033, By Route of Administration

Figure 15: Global Market Attractiveness Analysis 2023 to 2033, By Route of Administration

Figure 16: Global Market Value Share (%) Analysis 2023 and 2033, By Treatment

Figure 17: Global Market Y-O-Y Growth (%) Analysis 2022 to 2033, By Treatment

Figure 18: Global Market Attractiveness Analysis 2023 to 2033, By Treatment

Figure 19: Global Market Value Share (%) Analysis 2023 and 2033, By Distribution Channel

Figure 20: Global Market Y-O-Y Growth (%) Analysis 2022 to 2033, By Distribution Channel

Figure 21: Global Market Attractiveness Analysis 2023 to 2033, By Distribution Channel

Figure 22: Global Market Value Share (%) Analysis 2023 and 2033, By Region

Figure 23: Global Market Y-O-Y Growth (%) Analysis 2022 to 2033, By Region

Figure 24: Global Market Attractiveness Analysis 2023 to 2033, By Region

Figure 25: North America Market Value (US$ Million) Analysis, 2018 to 2022

Figure 26: North America Market Value (US$ Million) Forecast, 2023 to 2033

Figure 27: North America Market Value Share (US$ Million), By Disease Type (2023 E)

Figure 28: North America Market Value Share (US$ Million), By Form (2023 E)

Figure 29: North America Market Value Share (US$ Million), By Prescription Type (2023 E)

Figure 30: North America Market Value Share (US$ Million), By Route of Administration (2023 E)

Figure 31: North America Market Value Share (US$ Million), By Treatment (2023 E)

Figure 32: North America Market Value Share (US$ Million), By Distribution Channel (2023 E)

Figure 33: North America Market Value Share (US$ Million), By Country (2023 E)

Figure 34: North America Market Attractiveness Analysis By Disease Type, 2023 to 2033

Figure 35: North America Market Attractiveness Analysis By Form, 2023 to 2033

Figure 36: North America Market Attractiveness Analysis By Prescription Type, 2023 to 2033

Figure 37: North America Market Attractiveness Analysis By Route of Administration, 2023 to 2033

Figure 38: North America Market Attractiveness Analysis By Treatment, 2023 to 2033

Figure 39: North America Market Attractiveness Analysis By Distribution Channel, 2023 to 2033

Figure 40: North America Market Attractiveness Analysis By Country, 2023 to 2033

Figure 41: USA Market Value Proportion Analysis, 2022

Figure 42: Global Vs. USA Growth Comparison

Figure 43: USA Market Share Analysis (%) By Disease Type, 2022 & 2033

Figure 44: USA Market Share Analysis (%) By Form, 2022 & 2033

Figure 45: USA Market Share Analysis (%) By Prescription Type, 2022 & 2033

Figure 46: USA Market Share Analysis (%) By Route of Administration, 2022 & 2033

Figure 47: USA Market Share Analysis (%) By Treatment, 2022 & 2033

Figure 48: USA Market Share Analysis (%) By Distribution Channel, 2022 & 2033

Figure 49: Canada Market Value Proportion Analysis, 2022

Figure 50: Global Vs. Canada. Growth Comparison

Figure 51: Canada Market Share Analysis (%) By Disease Type, 2022 & 2033

Figure 52: Canada Market Share Analysis (%) By Form, 2022 & 2033

Figure 53: Canada Market Share Analysis (%) By Prescription Type, 2022 & 2033

Figure 54: Canada Market Share Analysis (%) By Route of Administration, 2022 & 2033

Figure 55: Canada Market Share Analysis (%) By Treatment, 2022 & 2033

Figure 56: Canada Market Share Analysis (%) By Distribution Channel, 2022 & 2033

Figure 57: Latin America Market Value (US$ Million) Analysis, 2018 to 2022

Figure 58: Latin America Market Value (US$ Million) Forecast, 2023 to 2033

Figure 59: Latin America Market Value Share (US$ Million), By Disease Type (2023 E)

Figure 60: Latin America Market Value Share (US$ Million), By Form (2023 E)

Figure 61: Latin America Market Value Share (US$ Million), By Prescription Type (2023 E)

Figure 62: Latin America Market Value Share (US$ Million), By Route of Administration (2023 E)

Figure 63: Latin America Market Value Share (US$ Million), By Treatment (2023 E)

Figure 64: Latin America Market Value Share (US$ Million), By Distribution Channel (2023 E)

Figure 65: Latin America Market Value Share (US$ Million), By Country (2023 E)

Figure 66: Latin America Market Attractiveness Analysis By Disease Type, 2023 to 2033

Figure 67: Latin America Market Attractiveness Analysis By Form, 2023 to 2033

Figure 68: Latin America Market Attractiveness Analysis By Prescription Type, 2023 to 2033

Figure 69: Latin America Market Attractiveness Analysis By Route of Administration, 2023 to 2033

Figure 70: Latin America Market Attractiveness Analysis By Treatment, 2023 to 2033

Figure 71: Latin America Market Attractiveness Analysis By Distribution Channel, 2023 to 2033

Figure 72: Latin America Market Attractiveness Analysis By Country, 2023 to 2033

Figure 73: Mexico Market Value Proportion Analysis, 2022

Figure 74: Global Vs Mexico Growth Comparison

Figure 75: Mexico Market Share Analysis (%) By Disease Type, 2022 & 2033

Figure 76: Mexico Market Share Analysis (%) By Form, 2022 & 2033

Figure 77: Mexico Market Share Analysis (%) By Prescription Type, 2022 & 2033

Figure 78: Mexico Market Share Analysis (%) By Route of Administration, 2022 & 2033

Figure 79: Mexico Market Share Analysis (%) By Treatment, 2022 & 2033

Figure 80: Mexico Market Share Analysis (%) By Distribution Channel, 2022 & 2033

Figure 81: Brazil Market Value Proportion Analysis, 2022

Figure 82: Global Vs. Brazil. Growth Comparison

Figure 83: Brazil Market Share Analysis (%) By Disease Type, 2022 & 2033

Figure 84: Brazil Market Share Analysis (%) By Form, 2022 & 2033

Figure 85: Brazil Market Share Analysis (%) By Prescription Type, 2022 & 2033

Figure 86: Brazil Market Share Analysis (%) By Route of Administration, 2022 & 2033

Figure 87: Brazil Market Share Analysis (%) By Treatment, 2022 & 2033

Figure 88: Brazil Market Share Analysis (%) By Distribution Channel, 2022 & 2033

Figure 89: Argentina Market Value Proportion Analysis, 2022

Figure 90: Global Vs Argentina Growth Comparison

Figure 91: Argentina Market Share Analysis (%) By Disease Type, 2022 & 2033

Figure 92: Argentina Market Share Analysis (%) By Form, 2022 & 2033

Figure 93: Argentina Market Share Analysis (%) By Prescription Type, 2022 & 2033

Figure 94: Argentina Market Share Analysis (%) By Route of Administration, 2022 & 2033

Figure 95: Argentina Market Share Analysis (%) By Treatment, 2022 & 2033

Figure 96: Argentina Market Share Analysis (%) By Distribution Channel, 2022 & 2033

Figure 97: Europe Market Value (US$ Million) Analysis, 2018 to 2022

Figure 98: Europe Market Value (US$ Million) Forecast, 2023 to 2033

Figure 99: Europe Market Value Share (US$ Million), By Disease Type (2023 E)

Figure 100: Europe Market Value Share (US$ Million), By Form (2023 E)

Figure 101: Europe Market Value Share (US$ Million), By Prescription Type (2023 E)

Figure 102: Europe Market Value Share (US$ Million), By Route of Administration (2023 E)

Figure 103: Europe Market Value Share (US$ Million), By Treatment (2023 E)

Figure 104: Europe Market Value Share (US$ Million), By Distribution Channel (2023 E)

Figure 105: Europe Market Value Share (US$ Million), By Country (2023 E)

Figure 106: Europe Market Attractiveness Analysis By Disease Type, 2023 to 2033

Figure 107: Europe Market Attractiveness Analysis By Form, 2023 to 2033

Figure 108: Europe Market Attractiveness Analysis By Prescription Type, 2023 to 2033

Figure 109: Europe Market Attractiveness Analysis By Route of Administration, 2023 to 2033

Figure 110: Europe Market Attractiveness Analysis By Treatment, 2023 to 2033

Figure 111: Europe Market Attractiveness Analysis By Distribution Channel, 2023 to 2033

Figure 112: Europe Market Attractiveness Analysis By Country, 2023 to 2033

Figure 113: United kingdom Market Value Proportion Analysis, 2022

Figure 114: Global Vs. United kingdom Growth Comparison

Figure 115: United kingdom Market Share Analysis (%) By Disease Type, 2022 & 2033

Figure 116: United kingdom Market Share Analysis (%) By Form, 2022 & 2033

Figure 117: United kingdom Market Share Analysis (%) By Prescription Type, 2022 & 2033

Figure 118: United kingdom Market Share Analysis (%) By Route of Administration, 2022 & 2033

Figure 119: United kingdom Market Share Analysis (%) By Treatment, 2022 & 2033

Figure 120: United kingdom Market Share Analysis (%) By Distribution Channel, 2022 & 2033

Figure 121: Germany Market Value Proportion Analysis, 2022

Figure 122: Global Vs. Germany Growth Comparison

Figure 123: Germany Market Share Analysis (%) By Disease Type, 2022 & 2033

Figure 124: Germany Market Share Analysis (%) By Form, 2022 & 2033

Figure 125: Germany Market Share Analysis (%) By Prescription Type, 2022 & 2033

Figure 126: Germany Market Share Analysis (%) By Route of Administration, 2022 & 2033

Figure 127: Germany Market Share Analysis (%) By Treatment, 2022 & 2033

Figure 128: Germany Market Share Analysis (%) By Distribution Channel, 2022 & 2033

Figure 129: Italy Market Value Proportion Analysis, 2022

Figure 130: Global Vs. Italy Growth Comparison

Figure 131: Italy Market Share Analysis (%) By Disease Type, 2022 & 2033

Figure 132: Italy Market Share Analysis (%) By Form, 2022 & 2033

Figure 133: Italy Market Share Analysis (%) By Prescription Type, 2022 & 2033

Figure 134: Italy Market Share Analysis (%) By Route of Administration, 2022 & 2033

Figure 135: Italy Market Share Analysis (%) By Treatment, 2022 & 2033

Figure 136: Italy Market Share Analysis (%) By Distribution Channel, 2022 & 2033

Figure 137: France Market Value Proportion Analysis, 2022

Figure 138: Global Vs France Growth Comparison

Figure 139: France Market Share Analysis (%) By Disease Type, 2022 & 2033

Figure 140: France Market Share Analysis (%) By Form, 2022 & 2033

Figure 141: France Market Share Analysis (%) By Prescription Type, 2022 & 2033

Figure 142: France Market Share Analysis (%) By Route of Administration, 2022 & 2033

Figure 143: France Market Share Analysis (%) By Treatment, 2022 & 2033

Figure 144: France Market Share Analysis (%) By Distribution Channel, 2022 & 2033

Figure 145: Spain Market Value Proportion Analysis, 2022

Figure 146: Global Vs Spain Growth Comparison

Figure 147: Spain Market Share Analysis (%) By Disease Type, 2022 & 2033

Figure 148: Spain Market Share Analysis (%) By Form, 2022 & 2033

Figure 149: Spain Market Share Analysis (%) By Prescription Type, 2022 & 2033

Figure 150: Spain Market Share Analysis (%) By Route of Administration, 2022 & 2033

Figure 151: Spain Market Share Analysis (%) By Treatment, 2022 & 2033

Figure 152: Spain Market Share Analysis (%) By Distribution Channel, 2022 & 2033

Figure 153: Russia Market Value Proportion Analysis, 2022

Figure 154: Global Vs Russia Growth Comparison

Figure 155: Russia Market Share Analysis (%) By Disease Type, 2022 & 2033

Figure 156: Russia Market Share Analysis (%) By Form, 2022 & 2033

Figure 157: Russia Market Share Analysis (%) By Prescription Type, 2022 & 2033

Figure 158: Russia Market Share Analysis (%) By Route of Administration, 2022 & 2033

Figure 159: Russia Market Share Analysis (%) By Treatment, 2022 & 2033

Figure 160: Russia Market Share Analysis (%) By Distribution Channel, 2022 & 2033

Figure 161: BENELUX Market Value Proportion Analysis, 2022

Figure 162: Global Vs BENELUX Growth Comparison

Figure 163: BENELUX Market Share Analysis (%) By Disease Type, 2022 & 2033

Figure 164: BENELUX Market Share Analysis (%) By Form, 2022 & 2033

Figure 165: BENELUX Market Share Analysis (%) By Prescription Type, 2022 & 2033

Figure 166: BENELUX Market Share Analysis (%) By Route of Administration, 2022 & 2033

Figure 167: BENELUX Market Share Analysis (%) By Treatment, 2022 & 2033

Figure 168: BENELUX Market Share Analysis (%) By Distribution Channel, 2022 & 2033

Figure 169: Nordics Market Value Proportion Analysis, 2022

Figure 170: Global Vs Nordics Growth Comparison

Figure 171: Nordics Market Share Analysis (%) By Disease Type, 2022 & 2033

Figure 172: Nordics Market Share Analysis (%) By Form, 2022 & 2033

Figure 173: Nordics Market Share Analysis (%) By Prescription Type, 2022 & 2033

Figure 174: Nordics Market Share Analysis (%) By Route of Administration, 2022 & 2033

Figure 175: Nordics Market Share Analysis (%) By Treatment, 2022 & 2033

Figure 176: Nordics Market Share Analysis (%) By Distribution Channel, 2022 & 2033

Figure 177: East Asia Market Value (US$ Million) Analysis, 2018 to 2022

Figure 178: East Asia Market Value (US$ Million) Forecast, 2023 to 2033

Figure 179: East Asia Market Value Share (US$ Million), By Disease Type (2023 E)

Figure 180: East Asia Market Value Share (US$ Million), By Form (2023 E)

Figure 181: East Asia Market Value Share (US$ Million), By Prescription Type (2023 E)

Figure 182: East Asia Market Value Share (US$ Million), By Route of Administration (2023 E)

Figure 183: East Asia Market Value Share (US$ Million), By Treatment (2023 E)

Figure 184: East Asia Market Value Share (US$ Million), By Distribution Channel (2023 E)

Figure 185: East Asia Market Value Share (US$ Million), By Country (2023 E)

Figure 186: East Asia Market Attractiveness Analysis By Disease Type, 2023 to 2033

Figure 187: East Asia Market Attractiveness Analysis By Form, 2023 to 2033

Figure 188: East Asia Market Attractiveness Analysis By Prescription Type, 2023 to 2033

Figure 189: East Asia Market Attractiveness Analysis By Route of Administration, 2023 to 2033

Figure 190: East Asia Market Attractiveness Analysis By Treatment, 2023 to 2033

Figure 191: East Asia Market Attractiveness Analysis By Distribution Channel, 2023 to 2033

Figure 192: East Asia Market Attractiveness Analysis By Country, 2023 to 2033

Figure 193: China Market Value Proportion Analysis, 2022

Figure 194: Global Vs. China Growth Comparison

Figure 195: China Market Share Analysis (%) By Disease Type, 2022 & 2033

Figure 196: China Market Share Analysis (%) By Form, 2022 & 2033

Figure 197: China Market Share Analysis (%) By Prescription Type, 2022 & 2033

Figure 198: China Market Share Analysis (%) By Route of Administration, 2022 & 2033

Figure 199: China Market Share Analysis (%) By Treatment, 2022 & 2033

Figure 200: China Market Share Analysis (%) By Distribution Channel, 2022 & 2033

Figure 201: Japan Market Value Proportion Analysis, 2022

Figure 202: Global Vs. Japan Growth Comparison

Figure 203: Japan Market Share Analysis (%) By Disease Type, 2022 & 2033

Figure 204: Japan Market Share Analysis (%) By Form, 2022 & 2033

Figure 205: Japan Market Share Analysis (%) By Prescription Type, 2022 & 2033

Figure 206: Japan Market Share Analysis (%) By Route of Administration, 2022 & 2033

Figure 207: Japan Market Share Analysis (%) By Treatment, 2022 & 2033

Figure 208: Japan Market Share Analysis (%) By Distribution Channel, 2022 & 2033

Figure 209: South Korea Market Value Proportion Analysis, 2022

Figure 210: Global Vs South Korea Growth Comparison

Figure 211: South Korea Market Share Analysis (%) By Disease Type, 2022 & 2033

Figure 212: South Korea Market Share Analysis (%) By Form, 2022 & 2033

Figure 213: South Korea Market Share Analysis (%) By Prescription Type, 2022 & 2033

Figure 214: South Korea Market Share Analysis (%) By Route of Administration, 2022 & 2033

Figure 215: South Korea Market Share Analysis (%) By Treatment, 2022 & 2033

Figure 216: South Korea Market Share Analysis (%) By Distribution Channel, 2022 & 2033

Figure 217: South Asia Market Value (US$ Million) Analysis, 2018 to 2022

Figure 218: South Asia Market Value (US$ Million) Forecast, 2023 to 2033

Figure 219: South Asia Market Value Share (US$ Million), By Disease Type (2023 E)

Figure 220: South Asia Market Value Share (US$ Million), By Form (2023 E)

Figure 221: South Asia Market Value Share (US$ Million), By Prescription Type (2023 E)

Figure 222: South Asia Market Value Share (US$ Million), By Route of Administration (2023 E)

Figure 223: South Asia Market Value Share (US$ Million), By Treatment (2023 E)

Figure 224: South Asia Market Value Share (US$ Million), By Distribution Channel (2023 E)

Figure 225: South Asia Market Value Share (US$ Million), By Country (2023 E)

Figure 226: South Asia Market Attractiveness Analysis By Disease Type, 2023 to 2033

Figure 227: South Asia Market Attractiveness Analysis By Form, 2023 to 2033

Figure 228: South Asia Market Attractiveness Analysis By Prescription Type, 2023 to 2033

Figure 229: South Asia Market Attractiveness Analysis By Route of Administration, 2023 to 2033

Figure 230: South Asia Market Attractiveness Analysis By Treatment, 2023 to 2033

Figure 231: South Asia Market Attractiveness Analysis By Distribution Channel, 2023 to 2033

Figure 232: South Asia Market Attractiveness Analysis By Country, 2023 to 2033

Figure 233: India Market Value Proportion Analysis, 2022

Figure 234: Global Vs. India Growth Comparison

Figure 235: India Market Share Analysis (%) By Disease Type, 2022 & 2033

Figure 236: India Market Share Analysis (%) By Form, 2022 & 2033

Figure 237: India Market Share Analysis (%) By Prescription Type, 2022 & 2033

Figure 238: India Market Share Analysis (%) By Route of Administration, 2022 & 2033

Figure 239: India Market Share Analysis (%) By Treatment, 2022 & 2033

Figure 240: India Market Share Analysis (%) By Distribution Channel, 2022 & 2033

Figure 241: Indonesia Market Value Proportion Analysis, 2022

Figure 242: Global Vs. Indonesia Growth Comparison

Figure 243: Indonesia Market Share Analysis (%) By Disease Type, 2022 & 2033

Figure 244: Indonesia Market Share Analysis (%) By Form, 2022 & 2033

Figure 245: Indonesia Market Share Analysis (%) By Prescription Type, 2022 & 2033

Figure 246: Indonesia Market Share Analysis (%) By Route of Administration, 2022 & 2033

Figure 247: Indonesia Market Share Analysis (%) By Treatment, 2022 & 2033

Figure 248: Indonesia Market Share Analysis (%) By Distribution Channel, 2022 & 2033

Figure 249: Malaysia Market Value Proportion Analysis, 2022

Figure 250: Global Vs. Malaysia Growth Comparison

Figure 251: Malaysia Market Share Analysis (%) By Disease Type, 2022 & 2033

Figure 252: Malaysia Market Share Analysis (%) By Form, 2022 & 2033

Figure 253: Malaysia Market Share Analysis (%) By Prescription Type, 2022 & 2033

Figure 254: Malaysia Market Share Analysis (%) By Route of Administration, 2022 & 2033

Figure 255: Malaysia Market Share Analysis (%) By Treatment, 2022 & 2033

Figure 256: Malaysia Market Share Analysis (%) By Distribution Channel, 2022 & 2033

Figure 257: Thailand Market Value Proportion Analysis, 2022

Figure 258: Global Vs. Thailand Growth Comparison

Figure 259: Thailand Market Share Analysis (%) By Disease Type, 2022 & 2033

Figure 260: Thailand Market Share Analysis (%) By Form, 2022 & 2033

Figure 261: Thailand Market Share Analysis (%) By Prescription Type, 2022 & 2033

Figure 262: Thailand Market Share Analysis (%) By Route of Administration, 2022 & 2033

Figure 263: Thailand Market Share Analysis (%) By Treatment, 2022 & 2033

Figure 264: Thailand Market Share Analysis (%) By Distribution Channel, 2022 & 2033

Figure 265: Vietnam Market Value Proportion Analysis, 2022

Figure 266: Global Vs. Vietnam Growth Comparison

Figure 267: Vietnam Market Share Analysis (%) By Disease Type, 2022 & 2033

Figure 268: Vietnam Market Share Analysis (%) By Form, 2022 & 2033

Figure 269: Vietnam Market Share Analysis (%) By Prescription Type, 2022 & 2033

Figure 270: Vietnam Market Share Analysis (%) By Route of Administration, 2022 & 2033

Figure 271: Vietnam Market Share Analysis (%) By Treatment, 2022 & 2033

Figure 272: Vietnam Market Share Analysis (%) By Distribution Channel, 2022 & 2033

Figure 273: Philippines Market Value Proportion Analysis, 2022

Figure 274: Global Vs. Philippines Growth Comparison

Figure 275: Philippines Market Share Analysis (%) By Disease Type, 2022 & 2033

Figure 276: Philippines Market Share Analysis (%) By Form, 2022 & 2033

Figure 277: Philippines Market Share Analysis (%) By Prescription Type, 2022 & 2033

Figure 278: Philippines Market Share Analysis (%) By Route of Administration, 2022 & 2033

Figure 279: Philippines Market Share Analysis (%) By Treatment, 2022 & 2033

Figure 280: Philippines Market Share Analysis (%) By Distribution Channel, 2022 & 2033

Figure 281: Oceania Market Value (US$ Million) Analysis, 2018 to 2022

Figure 282: Oceania Market Value (US$ Million) Forecast, 2023 to 2033

Figure 283: Oceania Market Value Share (US$ Million), By Disease Type (2023 E)

Figure 284: Oceania Market Value Share (US$ Million), By Form (2023 E)

Figure 285: Oceania Market Value Share (US$ Million), By Prescription Type (2023 E)

Figure 286: Oceania Market Value Share (US$ Million), By Route of Administration (2023 E)

Figure 287: Oceania Market Value Share (US$ Million), By Treatment (2023 E)

Figure 288: Oceania Market Value Share (US$ Million), By Distribution Channel (2023 E)

Figure 289: Oceania Market Value Share (US$ Million), By Country (2023 E)

Figure 290: Oceania Market Attractiveness Analysis By Disease Type, 2023 to 2033

Figure 291: Oceania Market Attractiveness Analysis By Form, 2023 to 2033

Figure 292: Oceania Market Attractiveness Analysis By Prescription Type, 2023 to 2033

Figure 293: Oceania Market Attractiveness Analysis By Route of Administration, 2023 to 2033

Figure 294: Oceania Market Attractiveness Analysis By Treatment, 2023 to 2033

Figure 295: Oceania Market Attractiveness Analysis By Distribution Channel, 2023 to 2033

Figure 296: Oceania Market Attractiveness Analysis By Country, 2023 to 2033

Figure 297: Australia Market Value Proportion Analysis, 2022

Figure 298: Global Vs. Australia Growth Comparison

Figure 299: Australia Market Share Analysis (%) By Disease Type, 2022 & 2033

Figure 300: Australia Market Share Analysis (%) By Form, 2022 & 2033

Figure 301: Australia Market Share Analysis (%) By Prescription Type, 2022 & 2033

Figure 302: Australia Market Share Analysis (%) By Route of Administration, 2022 & 2033

Figure 303: Australia Market Share Analysis (%) By Treatment, 2022 & 2033

Figure 304: Australia Market Share Analysis (%) By Distribution Channel, 2022 & 2033

Figure 305: New Zealand Market Value Proportion Analysis, 2022

Figure 306: Global Vs New Zealand Growth Comparison

Figure 307: New Zealand Market Share Analysis (%) By Disease Type, 2022 & 2033

Figure 308: New Zealand Market Share Analysis (%) By Form, 2022 & 2033

Figure 309: New Zealand Market Share Analysis (%) By Prescription Type, 2022 & 2033

Figure 310: New Zealand Market Share Analysis (%) By Route of Administration, 2022 & 2033

Figure 311: New Zealand Market Share Analysis (%) By Treatment, 2022 & 2033

Figure 312: New Zealand Market Share Analysis (%) By Distribution Channel, 2022 & 2033

Figure 313: Middle East & Africa Market Value (US$ Million) Analysis, 2018 to 2022

Figure 314: Middle East & Africa Market Value (US$ Million) Forecast, 2023 to 2033

Figure 315: Middle East & Africa Market Value Share (US$ Million), By Disease Type (2023 E)

Figure 316: Middle East & Africa Market Value Share (US$ Million), By Form (2023 E)

Figure 317: Middle East & Africa Market Value Share (US$ Million), By Prescription Type (2023 E)

Figure 318: Middle East & Africa Market Value Share (US$ Million), By Route of Administration (2023 E)

Figure 319: Middle East & Africa Market Value Share (US$ Million), By Treatment (2023 E)

Figure 320: Middle East & Africa Market Value Share (US$ Million), By Distribution Channel (2023 E)

Figure 321: Middle East & Africa Market Value Share (US$ Million), By Country (2023 E)

Figure 322: Middle East & Africa Market Attractiveness Analysis By Disease Type, 2023 to 2033

Figure 323: Middle East & Africa Market Attractiveness Analysis By Form, 2023 to 2033

Figure 324: Middle East & Africa Market Attractiveness Analysis By Prescription Type, 2023 to 2033

Figure 325: Middle East & Africa Market Attractiveness Analysis By Route of Administration, 2023 to 2033

Figure 326: Middle East & Africa Market Attractiveness Analysis By Treatment, 2023 to 2033

Figure 327: Middle East & Africa Market Attractiveness Analysis By Distribution Channel, 2023 to 2033

Figure 328: Middle East & Africa Market Attractiveness Analysis By Country, 2023 to 2033

Figure 329: GCC Countries Market Value Proportion Analysis, 2022

Figure 330: Global Vs GCC Countries Growth Comparison

Figure 331: GCC Countries Market Share Analysis (%) By Disease Type, 2022 & 2033

Figure 332: GCC Countries Market Share Analysis (%) By Form, 2022 & 2033

Figure 333: GCC Countries Market Share Analysis (%) By Prescription Type, 2022 & 2033

Figure 334: GCC Countries Market Share Analysis (%) By Route of Administration, 2022 & 2033

Figure 335: GCC Countries Market Share Analysis (%) By Treatment, 2022 & 2033

Figure 336: GCC Countries Market Share Analysis (%) By Distribution Channel, 2022 & 2033

Figure 337: Türkiye Market Value Proportion Analysis, 2022

Figure 338: Global Vs. Türkiye Growth Comparison

Figure 339: Türkiye Market Share Analysis (%) By Disease Type, 2022 & 2033

Figure 340: Türkiye Market Share Analysis (%) By Form, 2022 & 2033

Figure 341: Türkiye Market Share Analysis (%) By Prescription Type, 2022 & 2033

Figure 342: Türkiye Market Share Analysis (%) By Route of Administration, 2022 & 2033

Figure 343: Türkiye Market Share Analysis (%) By Treatment, 2022 & 2033

Figure 344: Türkiye Market Share Analysis (%) By Distribution Channel, 2022 & 2033

Figure 345: South Africa Market Value Proportion Analysis, 2022

Figure 346: Global Vs. South Africa Growth Comparison

Figure 347: South Africa Market Share Analysis (%) By Disease Type, 2022 & 2033

Figure 348: South Africa Market Share Analysis (%) By Form, 2022 & 2033

Figure 349: South Africa Market Share Analysis (%) By Prescription Type, 2022 & 2033

Figure 350: South Africa Market Share Analysis (%) By Route of Administration, 2022 & 2033

Figure 351: South Africa Market Share Analysis (%) By Treatment, 2022 & 2033

Figure 352: South Africa Market Share Analysis (%) By Distribution Channel, 2022 & 2033

Figure 353: North Africa Market Value Proportion Analysis, 2022

Figure 354: Global Vs North Africa Growth Comparison

Figure 355: North Africa Market Share Analysis (%) By Disease Type, 2022 & 2033

Figure 356: North Africa Market Share Analysis (%) By Form, 2022 & 2033

Figure 357: North Africa Market Share Analysis (%) By Prescription Type, 2022 & 2033

Figure 358: North Africa Market Share Analysis (%) By Route of Administration, 2022 & 2033

Figure 359: North Africa Market Share Analysis (%) By Treatment, 2022 & 2033

Figure 360: North Africa Market Share Analysis (%) By Distribution Channel, 2022 & 2033

Figure 361: Israel Market Value Proportion Analysis, 2022

Figure 362: Global Vs Israel Growth Comparison

Figure 363: Israel Market Share Analysis (%) By Disease Type, 2022 & 2033

Figure 364: Israel Market Share Analysis (%) By Form, 2022 & 2033

Figure 365: Israel Market Share Analysis (%) By Prescription Type, 2022 & 2033

Figure 366: Israel Market Share Analysis (%) By Route of Administration, 2022 & 2033

Figure 367: Israel Market Share Analysis (%) By Treatment, 2022 & 2033

Figure 368: Israel Market Share Analysis (%) By Distribution Channel, 2022 & 2033

Recommendations

Healthcare

Allergy Diagnostics Market

Published : December 2022

Healthcare

Inhalation And Nasal Spray Generic Drugs Market

Published : November 2022

Explore Healthcare Insights

View Reports

Nasal Allergy Treatment Market