The global Nasal Polyposis Treatment Market is expected to witness significant growth from 2025 to 2035, Driven by new advances in treatment options and greater awareness of nose health, nasal polyposis is likely to become increasingly prevalent from 2025 to 2035. A condition where the nasal passages become benignly inflamed over time, the nasal polyposis are typically treated by pharmacological therapies and surgical intervention as well as, increasingly, with biological therapies.
The market is getting a lift from increasing expenditure in research and development, and a growing need for non-invasive treatment. The market is projected to surpass USD 9,557.225 Million by 2035, growing at a CAGR of 6.2% during the forecast period.
Key Market Metrics
| Metric | Value |
|---|---|
| Market Size in 2025 | USD 5,237.049 Million |
| Projected Market Size in 2035 | USD 9,557.225 Million |
| CAGR (2025 to 2035) | 6.2% |
The market in North America is the leading nasal polyposis treatment market due to the high prevalence of chronic rhinosinusitis with nasal polyps (CRSwNP), strong health infrastructure, well-funded R&D. From advanced biologics to the increasing adoption of minimally invasive surgical techniques, market expansion is helped by the continuous availability and faster application in recent years.
Europe is a key market for nasal polyposis treatment, driven by growing public awareness, rising diagnostic levels and increasing healthcare investment. Germany, France and England are all devoting funds to novel therapeutic methods at a biologic level and increasingly advanced surgical techniques.
Europe stands out as the world's leading growth region for endoscopic sinus operations. New treatment modalities based on scientific data are supported by the regulatory authorities, thereby expanding markets in this area as more approvals come on-stream every year.
The Asia-Pacific region is expected to achieve the fastest growth, based on a burgeoning population of patients, improved health care facilities and access to higher levels of treatment. Alongside a market increase for pharmaceutical and surgical intervention at every stage, new cases of nasal polyps are exploding in countries such as China, India and Japan.
High Treatment Costs
The high cost of advanced medical schemes like biologics and operations golds in market trenches Nasal Polyposis Treatment Market. Fighting financially, many patients cannot get proper treatment.
Limited Awareness and Diagnosis
On account of ignorance about the illness too many cases of nasal polyposis are left untreated. Patients often confuse their symptoms with garden variety sinusitis, causing ameliorated treatment and aggravated injuries.
Rising Prevalence of Chronic Rhinosinusitis with Nasal Polyps (CRSwNP)
An increased prevalence of chronic rhinosinusitis with nasal polyps means a new market is opening up for caring medical help. It is expected that the wider use of diagnostic techniques and better public knowledge will boost this market.
Advancements in Biologic Therapies
As biologic drugs target nasal polyposis, the treatment world is being completely revolutionized. Unlike traditional treatments, these therapies afford patients long-term relief from their ills--and they therefore present significant development opportunities for the future.
Coming to the market after 2025, it is expected that long-term R&D will continue and better medical services will be made available. At the same time, a variety of treatment methods with lower prices-certainly no one can deny such an increasing preference for non-invasive therapies as this. Meanwhile, as if to drive further trolling for the Personalized Drugs pie, demand for this kind of individual health care will grow ever stronger.
Market Shifts: A Comparative Analysis 2020 to 2024 vs. 2025 to 2035
| Market Shift | 2020 to 2024 Trends |
|---|---|
| Regulatory Landscape | Increasing FDA and EMA approvals for biologics |
| Market Demand | Rising for biologics and corticosteroids |
| Industry Adoption | Focus on surgical interventions and steroids |
| Supply Chain and Sourcing | High dependence on pharmaceutical companies |
| Market Competition | Dominated by key pharma players |
| Market Growth Drivers | Increased awareness and improved diagnostics |
| Sustainability and Energy Efficiency | Limited focus on eco-friendly production |
| Integration of Digital Innovations | Telemedicine and remote consultations |
| Advancements in Product Design | Traditional corticosteroids and surgeries |
| Market Shift | 2025 to 2035 Projections |
|---|---|
| Regulatory Landscape | Expansion of global regulatory standards for nasal polyposis treatments |
| Market Demand | Growth in demand for targeted and personalized therapies |
| Industry Adoption | Wider adoption of biologics and non-invasive therapies |
| Supply Chain and Sourcing | Increased production of generics and cost-effective alternatives |
| Market Competition | Entry of new biotech firms with innovative solutions |
| Market Growth Drivers | Technological advancements and growing patient preference for biologics |
| Sustainability and Energy Efficiency | Development of sustainable and cost-effective biologic treatments |
| Integration of Digital Innovations | AI-driven diagnostic tools and personalized treatment plans |
| Advancements in Product Design | Next-gen biologics with enhanced efficacy and reduced side effects |

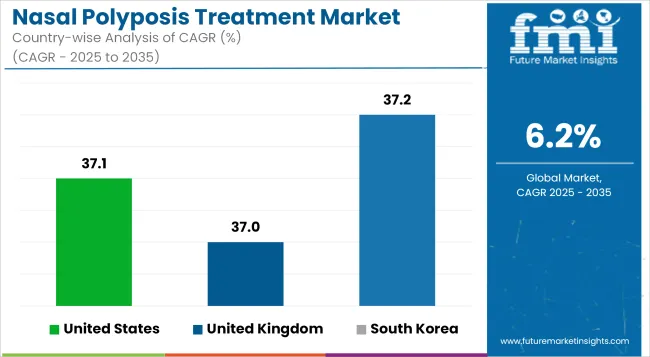
Non-volatile dual in-line memory module (NVDIMM) markets in the United States are currently expanding, Increasing corporate demand for high-performance servers, data storage and enterprise storage solutions. Relentless waves of data pouring in from across the world are continually raising demand for quicker processing, more reliable storage and ever greater efficiency in memory resources.
| Country | CAGR (2025 to 2035) |
|---|---|
| United States | 37.1% |
The United Kingdom's NVDIMM market has been expanding from the effect growing prevalence of advanced compute infrastructure within financial services sector national healthcare and central government departments. Companies desire low-latency, high-efficiency memory solutions--therefore something more than DRAMs.
| Country | CAGR (2025 to 2035) |
|---|---|
| United Kingdom | 37.0% |
European Union's NVDIMM markets are growing at a fast pace. This results from advanced AI, cloud computing, and big data analytics more common throughout society. Germany, France and the Netherlands have seen this trend and prepared to meet it by developing their next generation infrastructure with speed and energy efficient Non-volatile memory modules. Unbending adherence to extremely high data security regulations likewise pushes up the rate of NVDIMM deployment.
| Region | CAGR (2025 to 2035) |
|---|---|
| European Union | 37.3% |
South Korea s NVDIMM market is expanding rapidly due to the strong hormonal influence of a local semiconductor giant and sudden surge in investment-driven AI applications. The country's advanced electronics and telecommunications industries help to fuel the widespread demand for non-volatile memory solutions, with a DRAM-NAND hybrid future already taking shape as the next phase of data storage development unfolds in front of us.
| Country | CAGR (2025 to 2035) |
|---|---|
| South Korea | 37.2% |

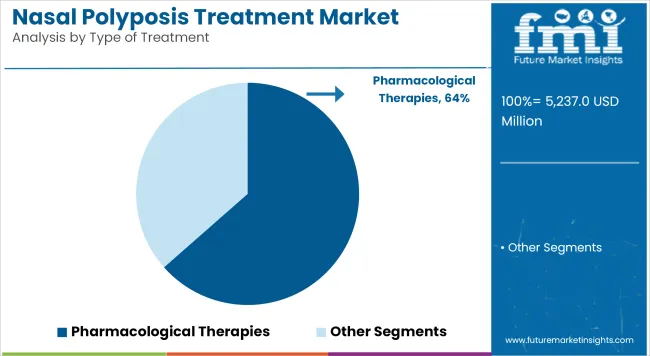
| Type of Treatment | Market Share (2025) |
|---|---|
| Pharmacological Therapies | 63.5% |
Pharmacological treatments are also expected to take 63.5% of market share in 2025. Among them corticosteroids are still the first-line therapy to help reduce inflammation and shrink polyps. Demands for intranasal corticosteroid sprays, oral steroids and new biologics such as monoclonal antibodies are on the rise.
This is particularly true in cases where patients have had recurrent bouts or a severe attack. Antibiotics and leukotriene inhibitors act as supplemental treatments for controlling infections and inflammation. The pharmacological segment has been further enhanced due to the fact that attention is concentrating increasingly on tailored therapy.
Biologic drugs like dupilumab and omalizumab and mepolizumab have all contributed to the faith put in this type of treatment. These biologics have great potential for people with severe or steroid-resistant nasal polyp formation.

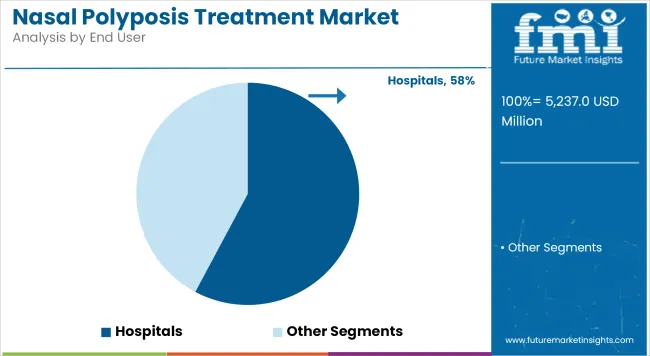
| End User | Market Share (2025) |
|---|---|
| Hospitals | 57.8% |
As many as 57.8% of the total market is expected to come under the hospitals segment of Nasal Polyposis Treatment Market in 2025. Hospitals are frequently the first referral and main centers for diagnosis and treatment of nasal polyps and experienced specialists offer advanced medical care as well as diagnosis. Many patients with severe cases go to a hospital.
There are multidisciplinary teams including ENT doctors, allergists and pulmonologists. Also, hospitals treat all its patients with comprehensive programs, from pharmacological management to surgical interventions with procedures such as polypectomy and functional endoscopic sinus surgery (FESS). The number of minimally invasive surgeries techniques in practice has increased.
Additionally, with the introduction of advanced endoscopic procedures the outcome post-operation has improved. Moreover, the rise of specialty hospitals and well-equipped otolaryngology departments in both developed and developing countries has fostered market growth.
And the availability of insurance cover and national or regional policies for hospital treatment keep people looking to hospitals treatment. As chronic sinusitis disorders continue to grow in incidence and severity, hospitals are expected to maintain their advantage over other nasal polyposis treatment market segments.
The growing number of chronic rhinosinusitis with nasal polyposis (CRSwNP) patients helped propel the nasal polyposis treatment market on a steady growth path. On the other hand, a large number of biologic therapies have appeared along with revolutionary new corticosteroids. At the same time, people have begun to realize that there are truly effective treatments available; as such media interest has increased again.
Pharmaceutical companies are increasing investment in research and development. Their aim is to continue introducing innovative biologics, corticosteroids and minimally invasive surgical techniques. The market is witnessing heightened competition: in order to hold, or gain market share, key players are expanding product lines and entering strategic partnerships.
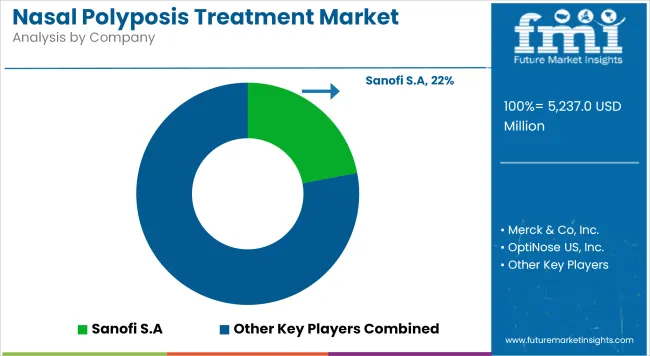
Market Share Analysis by Company

| Company Name | Estimated Market Share (%) |
|---|---|
| Sanofi S.A. | 18-22% |
| Regeneron Pharmaceuticals | 15-20% |
| GlaxoSmithKline (GSK) | 12-16% |
| Novartis AG | 10-14% |
| AstraZeneca | 7-11% |
| Other Companies (combined) | 30-40% |
| Company Name | Key Offerings/Activities |
|---|---|
| Sanofi S.A. | In February 2024, expanded Dupixent ® ( dupilumab ) approvals for nasal polyposis treatment in Asia. In January 2025, launched new clinical trials for next-generation biologics targeting nasal inflammation. |
| Regeneron Pharmaceuticals | In March 2024, collaborated with healthcare providers to expand the accessibility of Dupixent ® for nasal polyposis patients. In February 2025, introduced AI-driven diagnostic tools for better patient screening. |
| GlaxoSmithKline (GSK) | In April 2024, launched a nasal corticosteroid spray with enhanced delivery mechanisms. In January 2025, announced R&D investments in monoclonal antibody therapies for nasal polyps. |
| Novartis AG | In May 2024, introduced a Phase 3 clinical trial for an anti-IL-33 biologic for nasal polyposis. In February 2025, expanded its biologics division to include targeted nasal inflammation treatments. |
| AstraZeneca | In August 2024, developed a combination therapy using corticosteroids and immunomodulatory for severe nasal polyposis. In March 2025, acquired a biotech firm specializing in chronic sinusitis therapies. |
Key Company Insights
Sanofi S.A. (18-22%)
Sanofi, as the market leader in biologic therapies, is further expanding the availability of Dupixent and investing in next-generation anti-inflammatory treatments for nasal polyps.
Regeneron Pharmaceuticals (15-20%)
Regeneron is a major force in the nasal polyp area, and by working with Sanofi will be able to put Dupixent directly into patients’ hands. They are also providing visualization tools based on AI that allow you to see more clearly exactly where the inflammation is.
GlaxoSmithKline (GSK) (12-16%)
In this field GSK focuses on nasal corticosteroid treatments and strives to develop advanced biologics for managing chronic nasal polyp problems even more effectively.
Novartis AG (10-14%)
In the field of IL-targeted biologics, Novartis is an innovator. This company is currently experimenting with clinical trials for better nasal polyp treatments.
AstraZeneca (7-11%)
AstraZeneca will expand its respiratory and immunology portfolio with increased effectiveness by producing combination treatments and buying companies that specialize in developing solutions for chronic sinusitis.
Other Key Players (30-40% Combined)
The overall market size for Nasal Polyposis Treatments market was USD 5,237.049 Million in 2025.
The Nasal Polyposis Treatments market is expected to reach USD 9,557.225 Million in 2035.
The demand for nasal polyposis treatments will be driven by rising prevalence of chronic sinusitis, increasing adoption of minimally invasive surgeries, advancements in corticosteroid therapies, and growing patient preference for effective pharmacological treatments in hospitals and specialty clinics.
The top 5 countries which drives the development of Nasal Polyposis Treatments market are USA, European Union, Japan, South Korea and UK.
Pharmacological Therapies demand supplier to command significant share over the assessment period.
Table 1: Global Market Value (US$ Million) Forecast by Region, 2018 to 2033
Table 2: Global Market Value (US$ Million) Forecast by Type of Treatment, 2018 to 2033
Table 3: Global Market Value (US$ Million) Forecast by End User, 2018 to 2033
Table 4: North America Market Value (US$ Million) Forecast by Country, 2018 to 2033
Table 5: North America Market Value (US$ Million) Forecast by Type of Treatment, 2018 to 2033
Table 6: North America Market Value (US$ Million) Forecast by End User, 2018 to 2033
Table 7: Latin America Market Value (US$ Million) Forecast by Country, 2018 to 2033
Table 8: Latin America Market Value (US$ Million) Forecast by Type of Treatment, 2018 to 2033
Table 9: Latin America Market Value (US$ Million) Forecast by End User, 2018 to 2033
Table 10: Europe Market Value (US$ Million) Forecast by Country, 2018 to 2033
Table 11: Europe Market Value (US$ Million) Forecast by Type of Treatment, 2018 to 2033
Table 12: Europe Market Value (US$ Million) Forecast by End User, 2018 to 2033
Table 13: Asia Pacific Market Value (US$ Million) Forecast by Country, 2018 to 2033
Table 14: Asia Pacific Market Value (US$ Million) Forecast by Type of Treatment, 2018 to 2033
Table 15: Asia Pacific Market Value (US$ Million) Forecast by End User, 2018 to 2033
Table 16: Middle East and Africa Market Value (US$ Million) Forecast by Country, 2018 to 2033
Table 17: Middle East and Africa Market Value (US$ Million) Forecast by Type of Treatment, 2018 to 2033
Table 18: Middle East and Africa Market Value (US$ Million) Forecast by End User, 2018 to 2033
Figure 1: Global Market Value (US$ Million) by Type of Treatment, 2023 to 2033
Figure 2: Global Market Value (US$ Million) by End User, 2023 to 2033
Figure 3: Global Market Value (US$ Million) by Region, 2023 to 2033
Figure 4: Global Market Value (US$ Million) Analysis by Region, 2018 to 2033
Figure 5: Global Market Value Share (%) and BPS Analysis by Region, 2023 to 2033
Figure 6: Global Market Y-o-Y Growth (%) Projections by Region, 2023 to 2033
Figure 7: Global Market Value (US$ Million) Analysis by Type of Treatment, 2018 to 2033
Figure 8: Global Market Value Share (%) and BPS Analysis by Type of Treatment, 2023 to 2033
Figure 9: Global Market Y-o-Y Growth (%) Projections by Type of Treatment, 2023 to 2033
Figure 10: Global Market Value (US$ Million) Analysis by End User, 2018 to 2033
Figure 11: Global Market Value Share (%) and BPS Analysis by End User, 2023 to 2033
Figure 12: Global Market Y-o-Y Growth (%) Projections by End User, 2023 to 2033
Figure 13: Global Market Attractiveness by Type of Treatment, 2023 to 2033
Figure 14: Global Market Attractiveness by End User, 2023 to 2033
Figure 15: Global Market Attractiveness by Region, 2023 to 2033
Figure 16: North America Market Value (US$ Million) by Type of Treatment, 2023 to 2033
Figure 17: North America Market Value (US$ Million) by End User, 2023 to 2033
Figure 18: North America Market Value (US$ Million) by Country, 2023 to 2033
Figure 19: North America Market Value (US$ Million) Analysis by Country, 2018 to 2033
Figure 20: North America Market Value Share (%) and BPS Analysis by Country, 2023 to 2033
Figure 21: North America Market Y-o-Y Growth (%) Projections by Country, 2023 to 2033
Figure 22: North America Market Value (US$ Million) Analysis by Type of Treatment, 2018 to 2033
Figure 23: North America Market Value Share (%) and BPS Analysis by Type of Treatment, 2023 to 2033
Figure 24: North America Market Y-o-Y Growth (%) Projections by Type of Treatment, 2023 to 2033
Figure 25: North America Market Value (US$ Million) Analysis by End User, 2018 to 2033
Figure 26: North America Market Value Share (%) and BPS Analysis by End User, 2023 to 2033
Figure 27: North America Market Y-o-Y Growth (%) Projections by End User, 2023 to 2033
Figure 28: North America Market Attractiveness by Type of Treatment, 2023 to 2033
Figure 29: North America Market Attractiveness by End User, 2023 to 2033
Figure 30: North America Market Attractiveness by Country, 2023 to 2033
Figure 31: Latin America Market Value (US$ Million) by Type of Treatment, 2023 to 2033
Figure 32: Latin America Market Value (US$ Million) by End User, 2023 to 2033
Figure 33: Latin America Market Value (US$ Million) by Country, 2023 to 2033
Figure 34: Latin America Market Value (US$ Million) Analysis by Country, 2018 to 2033
Figure 35: Latin America Market Value Share (%) and BPS Analysis by Country, 2023 to 2033
Figure 36: Latin America Market Y-o-Y Growth (%) Projections by Country, 2023 to 2033
Figure 37: Latin America Market Value (US$ Million) Analysis by Type of Treatment, 2018 to 2033
Figure 38: Latin America Market Value Share (%) and BPS Analysis by Type of Treatment, 2023 to 2033
Figure 39: Latin America Market Y-o-Y Growth (%) Projections by Type of Treatment, 2023 to 2033
Figure 40: Latin America Market Value (US$ Million) Analysis by End User, 2018 to 2033
Figure 41: Latin America Market Value Share (%) and BPS Analysis by End User, 2023 to 2033
Figure 42: Latin America Market Y-o-Y Growth (%) Projections by End User, 2023 to 2033
Figure 43: Latin America Market Attractiveness by Type of Treatment, 2023 to 2033
Figure 44: Latin America Market Attractiveness by End User, 2023 to 2033
Figure 45: Latin America Market Attractiveness by Country, 2023 to 2033
Figure 46: Europe Market Value (US$ Million) by Type of Treatment, 2023 to 2033
Figure 47: Europe Market Value (US$ Million) by End User, 2023 to 2033
Figure 48: Europe Market Value (US$ Million) by Country, 2023 to 2033
Figure 49: Europe Market Value (US$ Million) Analysis by Country, 2018 to 2033
Figure 50: Europe Market Value Share (%) and BPS Analysis by Country, 2023 to 2033
Figure 51: Europe Market Y-o-Y Growth (%) Projections by Country, 2023 to 2033
Figure 52: Europe Market Value (US$ Million) Analysis by Type of Treatment, 2018 to 2033
Figure 53: Europe Market Value Share (%) and BPS Analysis by Type of Treatment, 2023 to 2033
Figure 54: Europe Market Y-o-Y Growth (%) Projections by Type of Treatment, 2023 to 2033
Figure 55: Europe Market Value (US$ Million) Analysis by End User, 2018 to 2033
Figure 56: Europe Market Value Share (%) and BPS Analysis by End User, 2023 to 2033
Figure 57: Europe Market Y-o-Y Growth (%) Projections by End User, 2023 to 2033
Figure 58: Europe Market Attractiveness by Type of Treatment, 2023 to 2033
Figure 59: Europe Market Attractiveness by End User, 2023 to 2033
Figure 60: Europe Market Attractiveness by Country, 2023 to 2033
Figure 61: Asia Pacific Market Value (US$ Million) by Type of Treatment, 2023 to 2033
Figure 62: Asia Pacific Market Value (US$ Million) by End User, 2023 to 2033
Figure 63: Asia Pacific Market Value (US$ Million) by Country, 2023 to 2033
Figure 64: Asia Pacific Market Value (US$ Million) Analysis by Country, 2018 to 2033
Figure 65: Asia Pacific Market Value Share (%) and BPS Analysis by Country, 2023 to 2033
Figure 66: Asia Pacific Market Y-o-Y Growth (%) Projections by Country, 2023 to 2033
Figure 67: Asia Pacific Market Value (US$ Million) Analysis by Type of Treatment, 2018 to 2033
Figure 68: Asia Pacific Market Value Share (%) and BPS Analysis by Type of Treatment, 2023 to 2033
Figure 69: Asia Pacific Market Y-o-Y Growth (%) Projections by Type of Treatment, 2023 to 2033
Figure 70: Asia Pacific Market Value (US$ Million) Analysis by End User, 2018 to 2033
Figure 71: Asia Pacific Market Value Share (%) and BPS Analysis by End User, 2023 to 2033
Figure 72: Asia Pacific Market Y-o-Y Growth (%) Projections by End User, 2023 to 2033
Figure 73: Asia Pacific Market Attractiveness by Type of Treatment, 2023 to 2033
Figure 74: Asia Pacific Market Attractiveness by End User, 2023 to 2033
Figure 75: Asia Pacific Market Attractiveness by Country, 2023 to 2033
Figure 76: Middle East and Africa Market Value (US$ Million) by Type of Treatment, 2023 to 2033
Figure 77: Middle East and Africa Market Value (US$ Million) by End User, 2023 to 2033
Figure 78: Middle East and Africa Market Value (US$ Million) by Country, 2023 to 2033
Figure 79: Middle East and Africa Market Value (US$ Million) Analysis by Country, 2018 to 2033
Figure 80: Middle East and Africa Market Value Share (%) and BPS Analysis by Country, 2023 to 2033
Figure 81: Middle East and Africa Market Y-o-Y Growth (%) Projections by Country, 2023 to 2033
Figure 82: Middle East and Africa Market Value (US$ Million) Analysis by Type of Treatment, 2018 to 2033
Figure 83: Middle East and Africa Market Value Share (%) and BPS Analysis by Type of Treatment, 2023 to 2033
Figure 84: Middle East and Africa Market Y-o-Y Growth (%) Projections by Type of Treatment, 2023 to 2033
Figure 85: Middle East and Africa Market Value (US$ Million) Analysis by End User, 2018 to 2033
Figure 86: Middle East and Africa Market Value Share (%) and BPS Analysis by End User, 2023 to 2033
Figure 87: Middle East and Africa Market Y-o-Y Growth (%) Projections by End User, 2023 to 2033
Figure 88: Middle East and Africa Market Attractiveness by Type of Treatment, 2023 to 2033
Figure 89: Middle East and Africa Market Attractiveness by End User, 2023 to 2033
Figure 90: Middle East and Africa Market Attractiveness by Country, 2023 to 2033


Full Research Suite comprises of:
Market outlook & trends analysis
Interviews & case studies
Strategic recommendations
Vendor profiles & capabilities analysis
5-year forecasts
8 regions and 60+ country-level data splits
Market segment data splits
12 months of continuous data updates
DELIVERED AS:
PDF EXCEL ONLINE
Nasal Implant Market Size and Share Forecast Outlook 2025 to 2035
Nasal Sprays Market Analysis - Size, Share, and Forecast 2025 to 2035
Nasal Packing Devices Market Size and Share Forecast Outlook 2025 to 2035
Nasal Antihistamines Market – Growth & Forecast 2025 to 2035
Nasal vaccines Market
Nasal Sampling Lines Market
Nasal Oxygen Cannula Market
Nasal Allergy Treatment Market Size and Share Forecast Outlook 2025 to 2035
Nasal Congestion Treatment Devices Market Analysis Size and Share Forecast Outlook 2025 to 2035
Intranasal Corticosteroids Market Analysis – Growth & Demand Forecast 2025 to 2035
Migraine Nasal Spray Market Outlook – Trends, Growth & Forecast 2025 to 2035
High Flow Nasal Cannula Market – Innovations & Forecast 2024-2034
Pediatric Nasal Cannula Market
Electronic Nasal Spray Devices Market Size and Share Forecast Outlook 2025 to 2035
Fragmentable Nasal and Ear Dressing Market Size and Share Forecast Outlook 2025 to 2035
Steroid-Free Nasal Sprays Market Insights - Trends & Forecast 2025 to 2035
Inhalation And Nasal Spray Generic Drugs Market Size and Share Forecast Outlook 2025 to 2035
Treatment-Resistant Hypertension Management Market Size and Share Forecast Outlook 2025 to 2035
Treatment-Resistant Depression Treatment Market Size and Share Forecast Outlook 2025 to 2035
Treatment Pumps Market Insights Growth & Demand Forecast 2025 to 2035

Thank you!
You will receive an email from our Business Development Manager. Please be sure to check your SPAM/JUNK folder too.
Chat With
MaRIA