Nasal Packing Devices Market
Expand and Expedite: Unlocking Value in the Nasal Packing Devices Market
Nasal Packing Devices Market by Product, by Type& Region - Forecast 2022 - 2032
Nasal Packing Devices Market Outlook (2022-2032)
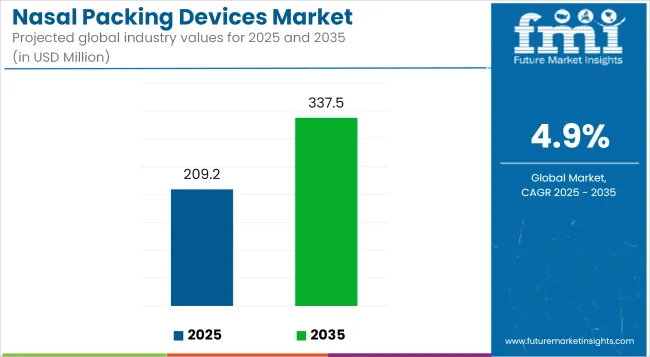
[342 Pages Report] The global nasal packing devices market is expected to reach a market valuation of US$ 182.03 Million by the year 2022, accelerating with a moderate CAGR of 5.1% by 2022-2032. Nasal Packing Devices market size is anticipated to be valued at about US$ 299.35 Million by 2032 end.
The demand for nasal packing devices is growing due in large part to the rising incidence of epistaxis. Epistaxis affected more than 12% of the world's population in 2021, with 75% of those affected needing medical intervention, according to the International Journal of Otolaryngology.
Hypertension is thought to be the major cause of epistaxis, a frequent clinical disease characterised by bleeding from the nostrils. The nasal packing devices market is benefiting from hypertension's rising prevalence. Pregnancy causes nosebleeds because the blood vessels expand and more blood flows through them.
Consequently, the nasal packing devices market is being driven by an increase in the number of pregnant women with hypertension illnesses. The demand for nasal packing devices is also being driven by the rising incidence of nasal malignancies.
Despite this, the demand for nasal packing devices is hampered by consequences such mucosal lacerations, which can increase bleeding, create infectious complications, and result in toxic shock syndrome (TSS). As a result, the nasal packing devices market is expected to contract because of this factor. The adoption of nasal packing devices, however, is being driven by an increase in the number of products being introduced and a persistent emphasis on technological advancements.
Attributes |
Value |
Nasal Packing Devices Market Size (2022) |
US$ 182.03 Million |
Nasal Packing Devices Market Projected Size (2032) |
US$ 299.35 Million |
Nasal Packing Devices Market Value CAGR (2022-2032) |
5.1% |
Let us know your requirement to get
100% FREE customization
What are the Drivers and Restraints Impacting the Global Nasal Packing Devices Demand?
Rising incidence of epistaxis will fuel demand for nasal packing devices
According to a study published in the International Journal of Otolaryngology in 2015, epistaxis affects between 10 and 12 percent of the global population, with 80 percent of those affected requiring medical attention because the condition does not improve without treatment. The nasal packaging device market is projected to expand as a result of an increasing number of nosebleed cases.
The American Pregnancy Association states that a woman's circulatory system enlarges during pregnancy. Due to the increase in blood production and circulation, pregnant women may experience more frequent nosebleeds and other complications. Growth of the global nasal packing devices market is therefore anticipated to be driven by the rising prevalence of hypertension illnesses among pregnant women throughout the forecast period. The demand for nasal packing devices is additionally bolstered by the rising incidence of nasal tumours, both benign and malignant.
Growth of the market in the pandemic
During the COVID-19 pandemic, the number of people using nasal packing devices rose dramatically. During the pandemic, the ongoing possibility of the virus's spread was a major concern for those working in healthcare. As a result, patients with epistaxis may be sent home from the hospital after receiving nasal packing that they could replenish and remove themselves with minimal instruction.
Comparative View of Adjacent Nasal Packing Devices Market
Nasal Packing Devices Market:
Attributes |
Nasal Packing Devices Market |
CAGR (2022 to 2032) |
5.1% |
Market Value (2022) |
US$ 182.03 Million |
Growth Factor |
Increasing rates of epistaxis, or nosebleeds, are a major contributor to the expansion of the nasal packing devices market. |
Future Opportunities |
Development of more cutting-edge medical equipment. |
Market Trends |
Gels and sprays are two examples of the newer forms of nasal packing that have gained popularity. |
Pharmaceutical Drug Delivery Market:
Attributes |
Pharmaceutical Drug Delivery Market |
CAGR (2022 to 2032) |
15% |
Market Value (2022) |
US$ 1656.9 Billion |
Growth Factor |
Rising prevalence of chronic diseases, and the growing biologics market are driving the market. |
Future Opportunities |
Opportunities for expansion abound for market leaders thanks to the growing interest in biosimilars and biologics as well as self-administration and home care. |
Market Trends |
The demand for preclinical services among life science businesses is being fueled by rising R&D spending on early-stage development and an increase in the number of prospective medications in the preclinical phase. |
Pharmaceutical Packaging Market:
Attributes |
Pharmaceutical Packaging Market |
CAGR (2022 to 2032) |
14.5% |
Market Value (2022) |
US$ 99.9 Billion |
Growth Factor |
The market for pharmaceutical packaging is being propelled by increasing healthcare costs and consumer awareness of the need of leading a healthier lifestyle. |
Future Opportunities |
Developed nations including the United States, the United Kingdom, Japan, Germany, and others have a growing appetite for technologically advanced solutions like self-administered drug delivery devices. |
Market Trends |
The market will grow in the next five years thanks to improved government policies and the strong enforcement of laws. |
A combination of factors, including a rising elderly population and advances in healthcare technology, have resulted in the emergence of a new market for nasal packing devices in the Asia Pacific region. The United Nations Population Fund reports that the Asia-Pacific area is in the forefront of the global phenomenon of population ageing due to its rapid increase in the number of persons aged 60 and up.
Predictions show that by 2050, one in four persons in Asia and the Pacific will be 60 or older. The demand for nasal packaging devices will expand rapidly in the Asia Pacific region due to the region's rapidly growing elderly population. This population is expected to more than quadruple between 2010 and 2050, reaching over 1.3 billion people.
Find your sweet spots for generating winning opportunities in this market.
Talk to AnalystCategory-wise Insights for Global Nasal Packing Devices Market
By Type
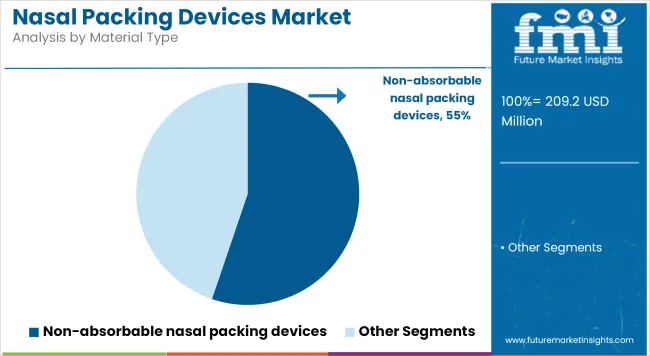
About 55% of the revenue in 2021 came from the non-absorbable nasal packing devices market category. Non-absorbable nasal packing devices have been around longer, are doctors' first choice, and cost less than their bioresorbable counterparts.
Due to technical developments and the launch of novel brands, the bioresorbable category is expected to grow at the quickest rate over the forecast period. For patients, the reduced discomfort and additional benefits of bioresorbable nasal packing devices make them preferable.
By Product
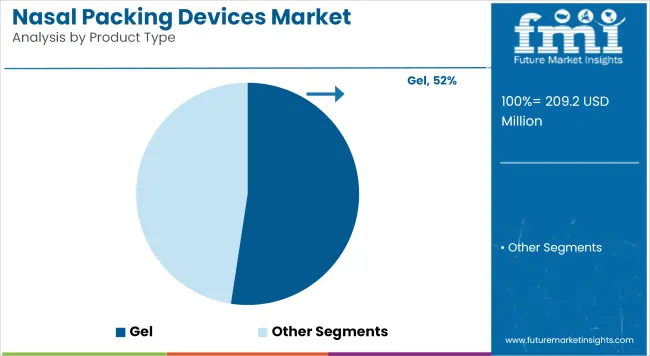
In terms of nasal packing devices revenue share in 2021, the spray segment was well ahead of the competition at roughly 30.0%. An emerging product, spray nasal packing, can be sprayed either directly into the nose or onto cotton balls and then inserted into the nose. A variety of nasal sprays, including saline and decongestant varieties, are on the nasal packing devices market.
Over the projected time frame, the gel packaging nasal packing devices market is expected to expand at a rate higher than any other. Gel's excellent patient comfort and its hemostatic capabilities are projected to help to the nasal packing devices segment's expansion, as are new advances and the efficacy of gel production.
Most people who suffer from nosebleeds turn to gel and bandages as their first line of defense. There is a wide selection of dressings from which to choose. MeroGel, made by Medtronic, is a well-liked nasal dressing. Postoperative nasal packing with injectable material is recommended to prevent central turbinate lateralization and nasal adhesions.
Regional Analysis of the Nasal Packing Devices Market
What is the leading region in the Nasal Packing Devices Market?
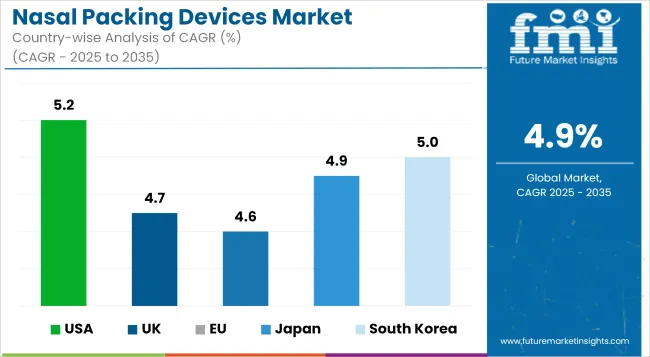
With more and more people in the region suffering from epistaxis and more and more companies entering the market, nasal packing devices in North America were the most popular and generated the most revenue in 2021. The demand for nasal packing devices was already high before the rise in COVID-19 cases in the region.
What is the Performance of Nasal Packing Devices Market in Asia Pacific Region?
From 2022 to 2032, the Asia-Pacific region is expected to post the highest nasal packing devices market growth rate worldwide. High unmet requirements, a thriving economy, and an overall improvement in healthcare facilities, particularly in developing countries like China and India, are mostly responsible for this expansion. Additionally, the expansion of the nasal packing devices market is due to the rising level of public understanding of nasal packing devices and the roles they play.

A unified Market Research Subscription Platform, built for today's disparate research needs.
Competitive Landscape for the Nasal Packing Devices Market
Nasal packing devices market participants are continuously encouraged to invest and focus substantially on research and development operations to produce new and creative products in response to the rapidly growing technology and demand for nasal packing goods. The nasal packing devices market is expanding thanks, in part, to the proliferation of manufacturers providing products with cutting-edge capabilities. Nasal packing devices manufacturers are expected to increase their market share through product launches, mergers, and acquisitions over the forecast period.
August 2021 saw the announcement of a definitive deal between Medtronic and Intersect ENT, whereby Medtronic will acquire all outstanding shares of Intersect ENT for USD 28.25 per share in cash, for a total purchase price of USD 1.1 billion.
Startup Ecosystem in the Global Nasal Packing Devices Market
New nasal packing devices market participants are involved in research and development for technological advancements and nasal packaging device innovation. Smith & Nephew introduced a line of nasal packaging devices featuring RAPID RHINO technology, a carboxymethylcellulose (CMC) blend with self-lubricating properties that provides gentle and even compression to the nasal area and aids in the rapid re-conformation of the nasal anatomy. Similar technological advancements and strategic implementations by emerging and established market players are expected to drive the global nasal packaging device market forward.
Emerging Innovations in the Nasal Packing Devices Market
Rise in the Adoption of Bioresorbable Nasal Packing
Nasal packing is used after sinus surgery to help stop bleeding and support the area's separated tissues and structures. The bioresorbable nasal packing aids in healing by reducing the risk of adhesion formation between the nasal mucosa and the underlying nasal bone. And because it dissolves slowly and is cleared naturally, you won't have to go through the discomfort of having your nasal packing removed.
For a stress-free recovery of patients, a variety of bioresorbable nasal packing products in a range of sizes, fragmentation times, compression strengths, and hemostatic properties are offered. nasal packing devices come in a variety of compression strengths to ensure proper blood clotting, structural support, and adhesion avoidance. Dissolvable nasal packing products allow for mucosal drainage. In addition, you can save time during surgery because no additional preparation, such as mixing, moistening, or using injection syringes, is required.
Medtronic’s Advent Into The Industry
After receiving FDA clearance in October, Medtronic ($MDT) introduced NovaShield Injectable Nasal Packing and Stent for functional endoscopic sinus surgery (FESS). After sinus or nasal surgery, a chitosan gel is inserted into the affected area. Patient discomfort is reduced because the entire NovaShield does not need to be removed at once, as is the case with traditional sponge or gauze packing.
Polymer chitosan is extracted from chitin, a component of the external shell of shellfish with properties that improve bleeding control. In patients taking antiplatelet or anticoagulant medications, which make hemostasis more difficult, the use of this first chitosan-based packing from Medtronic is associated with rapid hemostasis and fewer adhesions.
Absorbable Biomaterials: A New Way Forward
After endoscopic sinus surgery, absorbable biomaterials are frequently used for hemostasis and wound healing purposes. Removable nasal packing is the standard treatment for stopping bleeding and regulating wound healing, but it causes patients discomfort and has its own set of risks. In animal and human trials, absorbable agents currently on the market have been shown to provoke an inflammatory response, which slows the wound healing process. The rapid clearance profiles and novel chemical composition of modern agents provide significant benefits. Surgeon preference and case details should guide the choice of packing material for a given sinus procedure.
Global Nasal Packing Devices Market Key Players
- Summit Health
- Smith & Nephew
- Stryker Corporation
- Medtronic plc.
- Network medical products ltd.
- Olympus
- Lohmann & Rauscher
- Meril Life Sciences Pvt Ltd.
- FABCO
Nasal Packing Devices Market by Segmentation
By Product:
- Injectable
- Gel
- Spray
- Dressings
By Type:
- Bio-resorbable
- Non-absorbable
By Region:
- North America
- Latin America
- Europe
- East Asia
- South Asia
- Oceania
- Middle East and Africa
Frequently Asked Questions
The nasal packing devices market is expected to grow at 5.1% CAGR over 2022-2032.
The nasal packing devices market is estimated to be around US$ 182.03 Million in 2022.
The nasal packing devices market is anticipated to reach a valuation of US$ 299.35 Million by 2032.
In terms of revenue share, the spray category accounted for over 30.0% of the nasal packing devices market in 2021.
North America is the fastest growing region for the nasal packing devices market.
Table of Content
1. Executive Summary
1.1. Global Market Outlook
1.2. Demand-side Trends
1.3. Supply-side Trends
1.4. Technology Roadmap Analysis
1.5. Analysis and Recommendations
2. Market Overview
2.1. Market Coverage / Taxonomy
2.2. Market Definition / Scope / Limitations
3. Market Background
3.1. Market Dynamics
3.1.1. Drivers
3.1.2. Restraints
3.1.3. Opportunity
3.1.4. Trends
3.2. Scenario Forecast
3.2.1. Demand in Optimistic Scenario
3.2.2. Demand in Likely Scenario
3.2.3. Demand in Conservative Scenario
3.3. Opportunity Map Analysis
3.4. Product Life Cycle Analysis
3.5. Supply Chain Analysis
3.5.1. Supply Side Participants and their Roles
3.5.1.1. Producers
3.5.1.2. Mid-Level Participants (Traders/ Agents/ Brokers)
3.5.1.3. Wholesalers and Distributors
3.5.2. Value Added and Value Created at Node in the Supply Chain
3.5.3. List of Raw Material Suppliers
3.5.4. List of Existing and Potential Buyer’s
3.6. Investment Feasibility Matrix
3.7. Value Chain Analysis
3.7.1. Profit Margin Analysis
3.7.2. Wholesalers and Distributors
3.7.3. Retailers
3.8. PESTLE and Porter’s Analysis
3.9. Regulatory Landscape
3.9.1. By Key Regions
3.9.2. By Key Countries
3.10. Regional Parent Market Outlook
3.11. Production and Consumption Statistics
3.12. Import and Export Statistics
4. Global Market Analysis 2017-2021 and Forecast, 2022-2032
4.1. Historical Market Size Value (US$ Mn) & Volume (Units) Analysis, 2017-2021
4.2. Current and Future Market Size Value (US$ Mn) & Volume (Units) Projections, 2022-2032
4.2.1. Y-o-Y Growth Trend Analysis
4.2.2. Absolute $ Opportunity Analysis
5. Global Market Analysis 2017-2021 and Forecast 2022-2032, By Product
5.1. Introduction / Key Findings
5.2. Historical Market Size Value (US$ Mn) & Volume (Units) Analysis By Product, 2017-2021
5.3. Current and Future Market Size Value (US$ Mn) & Volume (Units) Analysis and Forecast By Product, 2022-2032
5.3.1. Injectable
5.3.2. Gel
5.3.3. Spray
5.3.4. Dressings
5.4. Y-o-Y Growth Trend Analysis By Product, 2017-2021
5.5. Absolute $ Opportunity Analysis By Product, 2022-2032
6. Global Market Analysis 2017-2021 and Forecast 2022-2032, By Type
6.1. Introduction / Key Findings
6.2. Historical Market Size Value (US$ Mn) & Volume (Units) Analysis By Type, 2017-2021
6.3. Current and Future Market Size Value (US$ Mn) & Volume (Units) Analysis and Forecast By Type, 2022-2032
6.3.1. Bio-resorbable
6.3.2. Non-absorbable
6.4. Y-o-Y Growth Trend Analysis By Type, 2017-2021
6.5. Absolute $ Opportunity Analysis By Type, 2022-2032
7. Global Market Analysis 2017-2021 and Forecast 2022-2032, By Region
7.1. Introduction
7.2. Historical Market Size Value (US$ Mn) & Volume (Units) Analysis By Region, 2017-2021
7.3. Current Market Size Value (US$ Mn) & Volume (Units) Analysis and Forecast By Region, 2022-2032
7.3.1. North America
7.3.2. Latin America
7.3.3. Europe
7.3.4. Asia Pacific
7.3.5. MEA
7.4. Market Attractiveness Analysis By Region
8. North America Market Analysis 2017-2021 and Forecast 2022-2032, By Country
8.1. Historical Market Size Value (US$ Mn) & Volume (Units) Trend Analysis By Market Taxonomy, 2017-2021
8.2. Market Size Value (US$ Mn) & Volume (Units) Forecast By Market Taxonomy, 2022-2032
8.2.1. By Country
8.2.1.1. U.S.
8.2.1.2. Canada
8.2.2. By Product
8.2.3. By Type
8.3. Market Attractiveness Analysis
8.3.1. By Country
8.3.2. By Product
8.3.3. By Type
8.4. Key Takeaways
9. Latin America Market Analysis 2017-2021 and Forecast 2022-2032, By Country
9.1. Historical Market Size Value (US$ Mn) & Volume (Units) Trend Analysis By Market Taxonomy, 2017-2021
9.2. Market Size Value (US$ Mn) & Volume (Units) Forecast By Market Taxonomy, 2022-2032
9.2.1. By Country
9.2.1.1. Brazil
9.2.1.2. Mexico
9.2.1.3. Rest of Latin America
9.2.2. By Product
9.2.3. By Type
9.3. Market Attractiveness Analysis
9.3.1. By Country
9.3.2. By Product
9.3.3. By Type
9.4. Key Takeaways
10. Europe Market Analysis 2017-2021 and Forecast 2022-2032, By Country
10.1. Historical Market Size Value (US$ Mn) & Volume (Units) Trend Analysis By Market Taxonomy, 2017-2021
10.2. Market Size Value (US$ Mn) & Volume (Units) Forecast By Market Taxonomy, 2022-2032
10.2.1. By Country
10.2.1.1. Germany
10.2.1.2. U.K.
10.2.1.3. France
10.2.1.4. Spain
10.2.1.5. Italy
10.2.1.6. Rest of Europe
10.2.2. By Product
10.2.3. By Type
10.3. Market Attractiveness Analysis
10.3.1. By Country
10.3.2. By Product
10.3.3. By Type
10.4. Key Takeaways
11. Asia Pacific Market Analysis 2017-2021 and Forecast 2022-2032, By Country
11.1. Historical Market Size Value (US$ Mn) & Volume (Units) Trend Analysis By Market Taxonomy, 2017-2021
11.2. Market Size Value (US$ Mn) & Volume (Units) Forecast By Market Taxonomy, 2022-2032
11.2.1. By Country
11.2.1.1. China
11.2.1.2. Japan
11.2.1.3. South Korea
11.2.1.4. Malaysia
11.2.1.5. Singapore
11.2.1.6. Australia
11.2.1.7. New Zealand
11.2.1.8. Rest of APAC
11.2.2. By Product
11.2.3. By Type
11.3. Market Attractiveness Analysis
11.3.1. By Country
11.3.2. By Product
11.3.3. By Type
11.4. Key Takeaways
12. MEA Market Analysis 2017-2021 and Forecast 2022-2032, By Country
12.1. Historical Market Size Value (US$ Mn) & Volume (Units) Trend Analysis By Market Taxonomy, 2017-2021
12.2. Market Size Value (US$ Mn) & Volume (Units) Forecast By Market Taxonomy, 2022-2032
12.2.1. By Country
12.2.1.1. GCC Countries
12.2.1.2. South Africa
12.2.1.3. Israel
12.2.1.4. Rest of MEA
12.2.2. By Product
12.2.3. By Type
12.3. Market Attractiveness Analysis
12.3.1. By Country
12.3.2. By Product
12.3.3. By Type
12.4. Key Takeaways
13. Key Countries Market Analysis
13.1. U.S.
13.1.1. Pricing Analysis
13.1.2. Market Share Analysis, 2021
13.1.2.1. By Product
13.1.2.2. By Type
13.2. Canada
13.2.1. Pricing Analysis
13.2.2. Market Share Analysis, 2021
13.2.2.1. By Product
13.2.2.2. By Type
13.3. Brazil
13.3.1. Pricing Analysis
13.3.2. Market Share Analysis, 2021
13.3.2.1. By Product
13.3.2.2. By Type
13.4. Mexico
13.4.1. Pricing Analysis
13.4.2. Market Share Analysis, 2021
13.4.2.1. By Product
13.4.2.2. By Type
13.5. Germany
13.5.1. Pricing Analysis
13.5.2. Market Share Analysis, 2021
13.5.2.1. By Product
13.5.2.2. By Type
13.6. U.K.
13.6.1. Pricing Analysis
13.6.2. Market Share Analysis, 2021
13.6.2.1. By Product
13.6.2.2. By Type
13.7. France
13.7.1. Pricing Analysis
13.7.2. Market Share Analysis, 2021
13.7.2.1. By Product
13.7.2.2. By Type
13.8. Spain
13.8.1. Pricing Analysis
13.8.2. Market Share Analysis, 2021
13.8.2.1. By Product
13.8.2.2. By Type
13.9. Italy
13.9.1. Pricing Analysis
13.9.2. Market Share Analysis, 2021
13.9.2.1. By Product
13.9.2.2. By Type
13.10. China
13.10.1. Pricing Analysis
13.10.2. Market Share Analysis, 2021
13.10.2.1. By Product
13.10.2.2. By Type
13.11. Japan
13.11.1. Pricing Analysis
13.11.2. Market Share Analysis, 2021
13.11.2.1. By Product
13.11.2.2. By Type
13.12. South Korea
13.12.1. Pricing Analysis
13.12.2. Market Share Analysis, 2021
13.12.2.1. By Product
13.12.2.2. By Type
13.13. Malaysia
13.13.1. Pricing Analysis
13.13.2. Market Share Analysis, 2021
13.13.2.1. By Product
13.13.2.2. By Type
13.14. Singapore
13.14.1. Pricing Analysis
13.14.2. Market Share Analysis, 2021
13.14.2.1. By Product
13.14.2.2. By Type
13.15. Australia
13.15.1. Pricing Analysis
13.15.2. Market Share Analysis, 2021
13.15.2.1. By Product
13.15.2.2. By Type
13.16. New Zealand
13.16.1. Pricing Analysis
13.16.2. Market Share Analysis, 2021
13.16.2.1. By Product
13.16.2.2. By Type
13.17. GCC Countries
13.17.1. Pricing Analysis
13.17.2. Market Share Analysis, 2021
13.17.2.1. By Product
13.17.2.2. By Type
13.18. South Africa
13.18.1. Pricing Analysis
13.18.2. Market Share Analysis, 2021
13.18.2.1. By Product
13.18.2.2. By Type
13.19. Israel
13.19.1. Pricing Analysis
13.19.2. Market Share Analysis, 2021
13.19.2.1. By Product
13.19.2.2. By Type
14. Market Structure Analysis
14.1. Competition Dashboard
14.2. Competition Benchmarking
14.3. Market Share Analysis of Top Players
14.3.1. By Regional
14.3.2. By Product
14.3.3. By Type
15. Competition Analysis
15.1. Competition Deep Dive
15.1.1. Summit Health
15.1.1.1. Overview
15.1.1.2. Product Portfolio
15.1.1.3. Profitability by Market Segments
15.1.1.4. Sales Footprint
15.1.1.5. Strategy Overview
15.1.1.5.1. Marketing Strategy
15.1.1.5.2. Product Strategy
15.1.1.5.3. Channel Strategy
15.1.2. Smith & Nephew
15.1.2.1. Overview
15.1.2.2. Product Portfolio
15.1.2.3. Profitability by Market Segments
15.1.2.4. Sales Footprint
15.1.2.5. Strategy Overview
15.1.2.5.1. Marketing Strategy
15.1.2.5.2. Product Strategy
15.1.2.5.3. Channel Strategy
15.1.3. Stryker Corporation
15.1.3.1. Overview
15.1.3.2. Product Portfolio
15.1.3.3. Profitability by Market Segments
15.1.3.4. Sales Footprint
15.1.3.5. Strategy Overview
15.1.3.5.1. Marketing Strategy
15.1.3.5.2. Product Strategy
15.1.3.5.3. Channel Strategy
15.1.4. Medtronic plc.
15.1.4.1. Overview
15.1.4.2. Product Portfolio
15.1.4.3. Profitability by Market Segments
15.1.4.4. Sales Footprint
15.1.4.5. Strategy Overview
15.1.4.5.1. Marketing Strategy
15.1.4.5.2. Product Strategy
15.1.4.5.3. Channel Strategy
15.1.5. Network medical products ltd.
15.1.5.1. Overview
15.1.5.2. Product Portfolio
15.1.5.3. Profitability by Market Segments
15.1.5.4. Sales Footprint
15.1.5.5. Strategy Overview
15.1.5.5.1. Marketing Strategy
15.1.5.5.2. Product Strategy
15.1.5.5.3. Channel Strategy
15.1.6. Olympus
15.1.6.1. Overview
15.1.6.2. Product Portfolio
15.1.6.3. Profitability by Market Segments
15.1.6.4. Sales Footprint
15.1.6.5. Strategy Overview
15.1.6.5.1. Marketing Strategy
15.1.6.5.2. Product Strategy
15.1.6.5.3. Channel Strategy
15.1.7. Lohmann & Rauscher
15.1.7.1. Overview
15.1.7.2. Product Portfolio
15.1.7.3. Profitability by Market Segments
15.1.7.4. Sales Footprint
15.1.7.5. Strategy Overview
15.1.7.5.1. Marketing Strategy
15.1.7.5.2. Product Strategy
15.1.7.5.3. Channel Strategy
15.1.8. Seraph Life Sciences Pvt Ltd
15.1.8.1. Overview
15.1.8.2. Product Portfolio
15.1.8.3. Profitability by Market Segments
15.1.8.4. Sales Footprint
15.1.8.5. Strategy Overview
15.1.8.5.1. Marketing Strategy
15.1.8.5.2. Product Strategy
15.1.8.5.3. Channel Strategy
15.1.9. FABCO
15.1.9.1. Overview
15.1.9.2. Product Portfolio
15.1.9.3. Profitability by Market Segments
15.1.9.4. Sales Footprint
15.1.9.5. Strategy Overview
15.1.9.5.1. Marketing Strategy
15.1.9.5.2. Product Strategy
15.1.9.5.3. Channel Strategy
15.1.10. Aegis Lifesciences
15.1.10.1. Overview
15.1.10.2. Product Portfolio
15.1.10.3. Profitability by Market Segments
15.1.10.4. Sales Footprint
15.1.10.5. Strategy Overview
15.1.10.5.1. Marketing Strategy
15.1.10.5.2. Product Strategy
15.1.10.5.3. Channel Strategy
16. Assumptions & Acronyms Used
17. Research Methodology
Let us know your requirement to get
100% FREE customization
List of Tables
Table 1: Global Market Value (US$ Mn) Forecast by Region, 2017-2032
Table 2: Global Market Volume (Units) Forecast by Region, 2017-2032
Table 3: Global Market Value (US$ Mn) Forecast by Product, 2017-2032
Table 4: Global Market Volume (Units) Forecast by Product, 2017-2032
Table 5: Global Market Value (US$ Mn) Forecast by Type, 2017-2032
Table 6: Global Market Volume (Units) Forecast by Type, 2017-2032
Table 7: North America Market Value (US$ Mn) Forecast by Country, 2017-2032
Table 8: North America Market Volume (Units) Forecast by Country, 2017-2032
Table 9: North America Market Value (US$ Mn) Forecast by Product, 2017-2032
Table 10: North America Market Volume (Units) Forecast by Product, 2017-2032
Table 11: North America Market Value (US$ Mn) Forecast by Type, 2017-2032
Table 12: North America Market Volume (Units) Forecast by Type, 2017-2032
Table 13: Latin America Market Value (US$ Mn) Forecast by Country, 2017-2032
Table 14: Latin America Market Volume (Units) Forecast by Country, 2017-2032
Table 15: Latin America Market Value (US$ Mn) Forecast by Product, 2017-2032
Table 16: Latin America Market Volume (Units) Forecast by Product, 2017-2032
Table 17: Latin America Market Value (US$ Mn) Forecast by Type, 2017-2032
Table 18: Latin America Market Volume (Units) Forecast by Type, 2017-2032
Table 19: Europe Market Value (US$ Mn) Forecast by Country, 2017-2032
Table 20: Europe Market Volume (Units) Forecast by Country, 2017-2032
Table 21: Europe Market Value (US$ Mn) Forecast by Product, 2017-2032
Table 22: Europe Market Volume (Units) Forecast by Product, 2017-2032
Table 23: Europe Market Value (US$ Mn) Forecast by Type, 2017-2032
Table 24: Europe Market Volume (Units) Forecast by Type, 2017-2032
Table 25: Asia Pacific Market Value (US$ Mn) Forecast by Country, 2017-2032
Table 26: Asia Pacific Market Volume (Units) Forecast by Country, 2017-2032
Table 27: Asia Pacific Market Value (US$ Mn) Forecast by Product, 2017-2032
Table 28: Asia Pacific Market Volume (Units) Forecast by Product, 2017-2032
Table 29: Asia Pacific Market Value (US$ Mn) Forecast by Type, 2017-2032
Table 30: Asia Pacific Market Volume (Units) Forecast by Type, 2017-2032
Table 31: MEA Market Value (US$ Mn) Forecast by Country, 2017-2032
Table 32: MEA Market Volume (Units) Forecast by Country, 2017-2032
Table 33: MEA Market Value (US$ Mn) Forecast by Product, 2017-2032
Table 34: MEA Market Volume (Units) Forecast by Product, 2017-2032
Table 35: MEA Market Value (US$ Mn) Forecast by Type, 2017-2032
Table 36: MEA Market Volume (Units) Forecast by Type, 2017-2032
Find your sweet spots for generating winning opportunities in this market.
Talk to AnalystList of Charts
Figure 1: Global Market Value (US$ Mn) by Product, 2022-2032
Figure 2: Global Market Value (US$ Mn) by Type, 2022-2032
Figure 3: Global Market Value (US$ Mn) by Region, 2022-2032
Figure 4: Global Market Value (US$ Mn) Analysis by Region, 2017-2032
Figure 5: Global Market Volume (Units) Analysis by Region, 2017-2032
Figure 6: Global Market Value Share (%) and BPS Analysis by Region, 2022-2032
Figure 7: Global Market Y-o-Y Growth (%) Projections by Region, 2022-2032
Figure 8: Global Market Value (US$ Mn) Analysis by Product, 2017-2032
Figure 9: Global Market Volume (Units) Analysis by Product, 2017-2032
Figure 10: Global Market Value Share (%) and BPS Analysis by Product, 2022-2032
Figure 11: Global Market Y-o-Y Growth (%) Projections by Product, 2022-2032
Figure 12: Global Market Value (US$ Mn) Analysis by Type, 2017-2032
Figure 13: Global Market Volume (Units) Analysis by Type, 2017-2032
Figure 14: Global Market Value Share (%) and BPS Analysis by Type, 2022-2032
Figure 15: Global Market Y-o-Y Growth (%) Projections by Type, 2022-2032
Figure 16: Global Market Attractiveness by Product, 2022-2032
Figure 17: Global Market Attractiveness by Type, 2022-2032
Figure 18: Global Market Attractiveness by Region, 2022-2032
Figure 19: North America Market Value (US$ Mn) by Product, 2022-2032
Figure 20: North America Market Value (US$ Mn) by Type, 2022-2032
Figure 21: North America Market Value (US$ Mn) by Country, 2022-2032
Figure 22: North America Market Value (US$ Mn) Analysis by Country, 2017-2032
Figure 23: North America Market Volume (Units) Analysis by Country, 2017-2032
Figure 24: North America Market Value Share (%) and BPS Analysis by Country, 2022-2032
Figure 25: North America Market Y-o-Y Growth (%) Projections by Country, 2022-2032
Figure 26: North America Market Value (US$ Mn) Analysis by Product, 2017-2032
Figure 27: North America Market Volume (Units) Analysis by Product, 2017-2032
Figure 28: North America Market Value Share (%) and BPS Analysis by Product, 2022-2032
Figure 29: North America Market Y-o-Y Growth (%) Projections by Product, 2022-2032
Figure 30: North America Market Value (US$ Mn) Analysis by Type, 2017-2032
Figure 31: North America Market Volume (Units) Analysis by Type, 2017-2032
Figure 32: North America Market Value Share (%) and BPS Analysis by Type, 2022-2032
Figure 33: North America Market Y-o-Y Growth (%) Projections by Type, 2022-2032
Figure 34: North America Market Attractiveness by Product, 2022-2032
Figure 35: North America Market Attractiveness by Type, 2022-2032
Figure 36: North America Market Attractiveness by Country, 2022-2032
Figure 37: Latin America Market Value (US$ Mn) by Product, 2022-2032
Figure 38: Latin America Market Value (US$ Mn) by Type, 2022-2032
Figure 39: Latin America Market Value (US$ Mn) by Country, 2022-2032
Figure 40: Latin America Market Value (US$ Mn) Analysis by Country, 2017-2032
Figure 41: Latin America Market Volume (Units) Analysis by Country, 2017-2032
Figure 42: Latin America Market Value Share (%) and BPS Analysis by Country, 2022-2032
Figure 43: Latin America Market Y-o-Y Growth (%) Projections by Country, 2022-2032
Figure 44: Latin America Market Value (US$ Mn) Analysis by Product, 2017-2032
Figure 45: Latin America Market Volume (Units) Analysis by Product, 2017-2032
Figure 46: Latin America Market Value Share (%) and BPS Analysis by Product, 2022-2032
Figure 47: Latin America Market Y-o-Y Growth (%) Projections by Product, 2022-2032
Figure 48: Latin America Market Value (US$ Mn) Analysis by Type, 2017-2032
Figure 49: Latin America Market Volume (Units) Analysis by Type, 2017-2032
Figure 50: Latin America Market Value Share (%) and BPS Analysis by Type, 2022-2032
Figure 51: Latin America Market Y-o-Y Growth (%) Projections by Type, 2022-2032
Figure 52: Latin America Market Attractiveness by Product, 2022-2032
Figure 53: Latin America Market Attractiveness by Type, 2022-2032
Figure 54: Latin America Market Attractiveness by Country, 2022-2032
Figure 55: Europe Market Value (US$ Mn) by Product, 2022-2032
Figure 56: Europe Market Value (US$ Mn) by Type, 2022-2032
Figure 57: Europe Market Value (US$ Mn) by Country, 2022-2032
Figure 58: Europe Market Value (US$ Mn) Analysis by Country, 2017-2032
Figure 59: Europe Market Volume (Units) Analysis by Country, 2017-2032
Figure 60: Europe Market Value Share (%) and BPS Analysis by Country, 2022-2032
Figure 61: Europe Market Y-o-Y Growth (%) Projections by Country, 2022-2032
Figure 62: Europe Market Value (US$ Mn) Analysis by Product, 2017-2032
Figure 63: Europe Market Volume (Units) Analysis by Product, 2017-2032
Figure 64: Europe Market Value Share (%) and BPS Analysis by Product, 2022-2032
Figure 65: Europe Market Y-o-Y Growth (%) Projections by Product, 2022-2032
Figure 66: Europe Market Value (US$ Mn) Analysis by Type, 2017-2032
Figure 67: Europe Market Volume (Units) Analysis by Type, 2017-2032
Figure 68: Europe Market Value Share (%) and BPS Analysis by Type, 2022-2032
Figure 69: Europe Market Y-o-Y Growth (%) Projections by Type, 2022-2032
Figure 70: Europe Market Attractiveness by Product, 2022-2032
Figure 71: Europe Market Attractiveness by Type, 2022-2032
Figure 72: Europe Market Attractiveness by Country, 2022-2032
Figure 73: Asia Pacific Market Value (US$ Mn) by Product, 2022-2032
Figure 74: Asia Pacific Market Value (US$ Mn) by Type, 2022-2032
Figure 75: Asia Pacific Market Value (US$ Mn) by Country, 2022-2032
Figure 76: Asia Pacific Market Value (US$ Mn) Analysis by Country, 2017-2032
Figure 77: Asia Pacific Market Volume (Units) Analysis by Country, 2017-2032
Figure 78: Asia Pacific Market Value Share (%) and BPS Analysis by Country, 2022-2032
Figure 79: Asia Pacific Market Y-o-Y Growth (%) Projections by Country, 2022-2032
Figure 80: Asia Pacific Market Value (US$ Mn) Analysis by Product, 2017-2032
Figure 81: Asia Pacific Market Volume (Units) Analysis by Product, 2017-2032
Figure 82: Asia Pacific Market Value Share (%) and BPS Analysis by Product, 2022-2032
Figure 83: Asia Pacific Market Y-o-Y Growth (%) Projections by Product, 2022-2032
Figure 84: Asia Pacific Market Value (US$ Mn) Analysis by Type, 2017-2032
Figure 85: Asia Pacific Market Volume (Units) Analysis by Type, 2017-2032
Figure 86: Asia Pacific Market Value Share (%) and BPS Analysis by Type, 2022-2032
Figure 87: Asia Pacific Market Y-o-Y Growth (%) Projections by Type, 2022-2032
Figure 88: Asia Pacific Market Attractiveness by Product, 2022-2032
Figure 89: Asia Pacific Market Attractiveness by Type, 2022-2032
Figure 90: Asia Pacific Market Attractiveness by Country, 2022-2032
Figure 91: MEA Market Value (US$ Mn) by Product, 2022-2032
Figure 92: MEA Market Value (US$ Mn) by Type, 2022-2032
Figure 93: MEA Market Value (US$ Mn) by Country, 2022-2032
Figure 94: MEA Market Value (US$ Mn) Analysis by Country, 2017-2032
Figure 95: MEA Market Volume (Units) Analysis by Country, 2017-2032
Figure 96: MEA Market Value Share (%) and BPS Analysis by Country, 2022-2032
Figure 97: MEA Market Y-o-Y Growth (%) Projections by Country, 2022-2032
Figure 98: MEA Market Value (US$ Mn) Analysis by Product, 2017-2032
Figure 99: MEA Market Volume (Units) Analysis by Product, 2017-2032
Figure 100: MEA Market Value Share (%) and BPS Analysis by Product, 2022-2032
Figure 101: MEA Market Y-o-Y Growth (%) Projections by Product, 2022-2032
Figure 102: MEA Market Value (US$ Mn) Analysis by Type, 2017-2032
Figure 103: MEA Market Volume (Units) Analysis by Type, 2017-2032
Figure 104: MEA Market Value Share (%) and BPS Analysis by Type, 2022-2032
Figure 105: MEA Market Y-o-Y Growth (%) Projections by Type, 2022-2032
Figure 106: MEA Market Attractiveness by Product, 2022-2032
Figure 107: MEA Market Attractiveness by Type, 2022-2032
Figure 108: MEA Market Attractiveness by Country, 2022-2032
Need specific information?
Request CustomizationExplore Healthcare Insights
View Reports