Reports

- Global Locations -

Headquarters

Future Market Insights, Inc.

Christiana Corporate, 200
Continental Drive, Suite 401,
Newark, Delaware - 19713,
United States

T: +1-845-579-5705

Americas

Future Market Insights, Inc.

616 Corporate Way, Suite 2-9018,
Valley Cottage, NY 10989, United States

T: +1-347-918-3531

MEA

Future Market Insights

1602-6 Jumeirah Bay X2 Tower, Plot No: JLT-PH2-X2A,
Jumeirah Lakes Towers, Dubai,
United Arab Emirates

Europe

Future Market Insights

3rd Floor, 207 Regent Street,
W1B 3HH London
United Kingdom

T: + 44 (0) 20 8123 9659
D: +44 (0) 20 3287 4268

Asia Pacific

Future Market Insights

IndiaLand Global Tech Park, Unit UG-1, Behind Grand HighStreet, Phase 1, Hinjawadi, MH, Pune – 411057, India

Packing Paper Market Outlook (2022-2032)

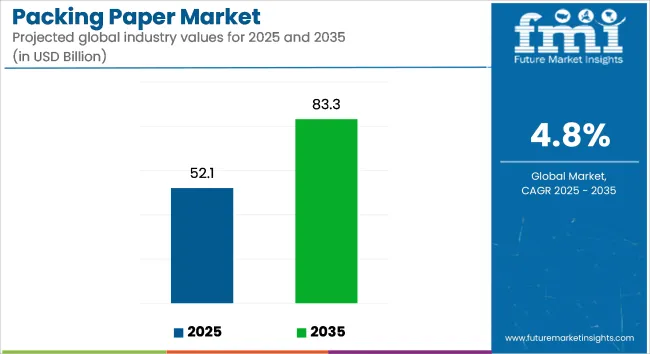
[314 Pages Report] The packing paper market is anticipated to have an effective CAGR of 4.8% during the period of 2022 to 2032.

The packing paper market is expected to expand from US$ 45.3 Billion in 2022 to US$ 72.4 Billion in 2032. Previously, the market grew at a faster rate of 4.3% from 2015 to 2021, culminating in a market of US$ 41.50 Billion in 2021.

Attributes Details
Packing Paper Market CAGR (2022-2032) 4.8%
Packing Paper Market Size (2022) US$ 45.3 Billion
Packing Paper Market Size (2032) US$ 72.4 Billion

A growing retail and e-commerce industry, as well as a growth in demand for environmentally friendly packaging products, represent the key drivers of the market at present.

Significant growth in the number of online shopping platforms has driven an increase in the demand for secondary and tertiary packaging products. Furthermore, changing consumer attitudes regarding sustainable packaging and the implementation of favourable government policies are stimulating the packing paper market growth.

The governments of many developed and developing nations are encouraging people to use paper-based products as an alternative to plastic in order to help reduce pollution and toxin levels in the environment.

Another significant growth factor will come from the rapidly expanding food and beverage industry around the world. The food industry is moving towards adopting food-grade paper packaging products to hold on to the nutrients and preserve the quality of the foods. The paper packaging market is also expected to grow in the coming years due to innovations to enhance the efficiency of the product as well as to produce visually appealing versions of the product

Don't pay for what you don't need

Customize your report by selecting specific countries or regions and save 30%!

How Covid-19 opens up new Opportunities in the Packing Paper Market?

Businesses and manufacturing industries around the world have been adversely affected by the rapidly spreading Coronavirus. As a result of extended lockdowns and disrupted supply chains, the packing paper market has been significantly affected.

During the COVID-19 outbreak, there has been a decrease in packaging paper production, which presents a challenge to manufacturers. There are several opportunities for market players to deal with these challenges in the packaging paper market. While the ongoing pandemic is affecting the economy, market players are effortlessly setting up their businesses to keep things running.

Strategic strategies are generating lucrative revenue opportunities for manufacturing companies in the packaging paper markets. In addition, packaging paper has been gaining popularity due to its attractive properties such as durability, lightweight, and low cost.

Furthermore, packaging paper is becoming increasingly applicable in various end-use industries, contributing to market growth. As the packaging paper market continues to grow, market players have extended their production capacity to gain a competitive advantage.

What is limiting the Growth of the Packing Paper Market?

The growth of the packing paper market has been hampered by fierce competition from flexible plastic packaging.

Plastic packaging that can bend provides a major advantage to manufacturers and retailers regarding shipping and warehousing costs. This can reduce the overall weight of packaging, thereby enabling manufacturers and retailers to create more space. With retort pouches, consumers can enjoy convenient features such as convenient single-serve portions, easy-to-open, and easy-peel formats. In addition, food tastes better in retort pouches than in traditional tin cans.

The overall packaging cost of flexible packaging is 40% less than rigid packaging. This results in a 50% reduction in landfill waste and a 62% reduction in greenhouse gas (GHG) emissions. Consequently, many product packaging manufacturers and package converters are opting for flexible packaging materials because of their ease of use, portability, cost savings, and health benefits.

Increasingly, modern shoppers are considering convenience and portability as top priorities, so packaging design has shifted toward flexible, easy-to-handle packaging. The gusseted flexible pouch is now the packaging of choice for snacks that were once packaged in jars and tins. In addition to food producers and nutraceutical packagers, flexible pouches are also well-suited to gels and liquids.

A company has already closed its wood yard and pulp mill in Port Hudson, LA. This was due to concerns around the environment, which included depleting forests, which certainly was not required. This has been one of the factors limiting the development of the paper packaging market.

Ismail Sutaria
Ismail Sutaria

Principal Consultant

Talk to Analyst

Find your sweet spots for generating winning opportunities in this market.

What are the Current Opportunities in the Packing Paper Market?

Market Opportunities in the Packaging Paper Market are associated with the replacement of plastic packaging for food applications in developing countries.

Globally, India and China have the fastest-growing economies. Developmentally, developing countries still use a great deal of plastic packaging compared to the developed nations of the west. Since plastic is cost-effective and convenient for consumers, it is the perfect material for packaging.

Companies are slowly moving towards providing paper and carton packaging solutions in light of increasing environmental concerns and stringent government policies. A great deal of effort has been put into innovation in order to develop cost-efficient products with similar utility and added benefits to the consumer.

A paper packaging coating that involves bioactive materials has been developed by researchers at the Fraunhofer-Gesellschaft as part of the BioActiveMaterials project. Not only does this coating reduce plastic use, but the coating of plant-based proteins and waxes also increases the shelf life of the food.

After use, the packaging can be placed in the waste paper recycling bin for disposal. In the BioActiveMaterials project, researchers use paper as the base material for producing typical and functional packaging materials: resealable bags or wrapping paper. The paper is provided with a special coating using standard processes.

What is the Segmentation Analysis of the Packing Paper Market?

Paper packaging gains momentum with a ban on lightweight plastic bags" Comparatively to other materials such as metals and plastics, paper packaging materials can be reused and recycled. As a result, paper packaging is among the most environmentally friendly and economical packaging options.

As consumers become more aware of plastic's harmful effects on the environment, the global paper packaging market is experiencing a rising demand for flexible paper packaging. The ban on lightweight plastic bags in some countries during the forecast period is expected to drive demand for paper packaging. Corrugated boxes and cartons are expected to experience continuous growth in demand in the coming years.

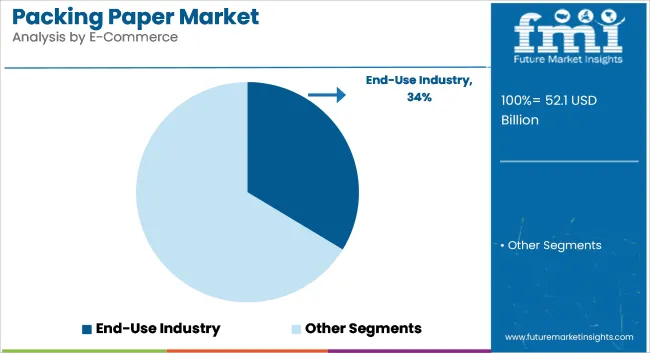
Due to the growing demand for packaging in key end-use industries such as food & beverage, electrical & electronics, and e-commerce, there is expected to be significant growth in the demand for corrugated boxes and cartons during the forecast period.

The cost-effectiveness and optimum protection characteristics of corrugated boxes and cartons are key factors driving the global paper packaging market. There is widespread use of paper packaging as a secondary and tertiary packaging solution for products in a variety of industries.

As online shopping becomes increasingly popular in developed and developing countries like Germany, the U.S., India, and China, paper packaging demand is expected to grow significantly over the next four to five years.

Moreover, with the rise in online shopping platforms, other flexible paper packaging solutions, such as corrugated boxes, folding cartons, and other paper-based packaging products that offer optimal protection during shipping and handling, will also gain a strong foothold in the global paper packaging market.

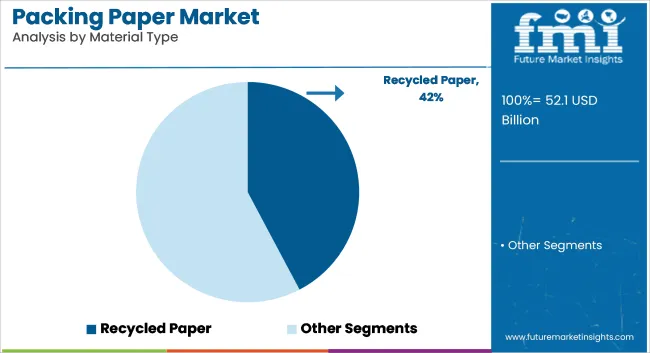
Packaging made from paper can be recycled easily and does not pose a threat to the environment. With the global push for recycling in the paper packaging industry, recycling businesses across the globe will have enormous opportunities. In addition, recycled paper packaging offers distinct cost advantages for the production of corrugated boxes, cartons, and other paper packaging solutions. Declining hardwood pulp and lumber production markets in the US have led to decreased demand for boxboard, hardwood pulp derivatives, and other goods made of hardwood pulp.

Get the data you need at a Fraction of the cost

Personalize your report by choosing insights you need
and save 40%!

What is the Regional Outlook of the Packing Paper Market?

The paper packaging materials market in North America and Europe has experienced significant growth due to increased paper packaging use. North America and Europe accounted for over half the global demand for paper packaging materials. Because of the growth in the overall packing industry in the region, the Asia Pacific market will continue to show the fastest growth for paper packaging in the coming years.

A significant share of the market is expected to be gained by the roW during the forecast period due to the emerging packaging industry in these regions and increased per capita spending by consumers. Further growth in demand and consumption for consumer goods will drive the need for more paper packaging market throughout the world.  

In addition to China, Japan, South Korea, and the Rest of East Asia, the paper packaging market in East Asia provides a country-level analysis. Among the paper packaging markets in East Asia, East Asia holds the largest share in terms of value. Paper packaging in East Asia is expected to grow at a CAGR of 4.2% during the forecast period.

The North American and European market is steady, as they are considering switching to 100% paper to avoid deforestation. Africa could still boast of dense forests. The paper packaging thing hasn’t reached its full potential yet.

What is the Competitive Outlook for the Packing Paper Market?

India and China have the fastest-growing economies. Developmentally, developing countries still use a great deal of plastic packaging compared to the developed nations of the west. Since plastic is cost-effective and convenient for consumers, it is the perfect material for packaging.

Companies are slowly moving towards providing paper and carton packaging solutions in light of increasing environmental concerns and stringent government policies. A great deal of effort has been put into innovation in order to develop cost-efficient products with similar utility and added benefits to the consumer. 

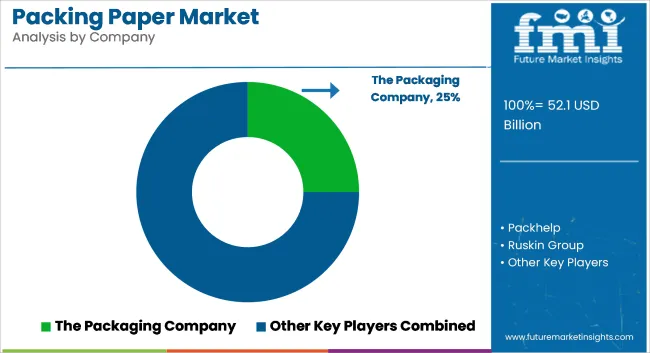
Georgia Pacific announced recently that it is leaving its paper business and will shut down all its paper machines permanently. Another company has already closed its wood yard and pulp mill in Port Hudson, LA. This was due to concerns around the environment, which includes depleting forests. A number of notable players are operating in the global cardiac reconstruction devices market, including The Packaging Company, Packhelp, Ruskin Group, Purple Co, Moraya Packaging, Pratt Industries, Inc., Mondi Group plc, WestRock Company, Oji Holdings Corporation, DS Smith Packaging Limited, Tat Seng Packaging Group.

Recent Developments in the Packing Paper Market
  • Compared to previous years, there has been a decline in demand for boxboard and liquid paper packaging. In the past 10 years, all of these factors have contributed to a 25% decline in hardwood fiber demand. For example, Georgia Pacific announced recently that it is leaving its paper business and will shut down all its paper machines permanently.
  • A company has already closed its wood yard and pulp mill in Port Hudson, LA. This was due to concerns around the environment, which includes depleting forests.
  • Further driving demand for paper packaging will be technological breakthroughs in the food industry, such as the development of laminated and coated papers to prevent leakage. It is expected that the paper packaging market will be the fastest-growing segment because it is efficient, versatile, innovative, and sustainable, adding value to food and other products.

Key players

  • The Packaging Company
  • Packhelp
  • Ruskin Group
  • Purple Co
  • Moraya Packaging
  • Pratt Industries, Inc.
  • Mondi Group plc
  • WestRock Company
  • Oji Holdings Corporation
  • DS Smith Packaging Limited
  • Tat Seng Packaging Group

Key segments

By Material Type:

  • Corrugated Board
  • Specialty Paper
  • Box-board/Carton Board
  • Kraft Papers
  • Other

By End-use Industry:

  • Food & Beverage
  • Healthcare
  • Personal Care & Cosmetics
  • Homecare & Toiletries
  • E-Commerce
  • Chemicals & Fertilizers
  • Others       

By Packing Type:

  • Corrugated Boxes
  • Cartons
  • Wrapping Paper
  • Cups & Tray
  • Others

By Region:

  • North America
  • Latin America
  • Europe
  • East Asia
  • South Asia
  • Oceania
  • Middle East & Africa

Frequently Asked Questions

What is the CAGR of the Packing Paper Market?

The packing paper market is projected to have a CAGR of 4.8% during the forecast period.

Which is the Leading Region in the Packing Paper Market?

The U.S. is the leading region, with an anticipated CAGR of % through 2032.

Which Segment Leads in the Packing Paper Market by End-Use Industry?

The cosmetic segment leads the market with the projected CAGR of 4.4% through 2032.

What is the Growth Estimated for the Packing Paper Market by 2032?

The packing paper market is predicted to grow to US$ 72.4 Billion by 2032.

Table of Content

1. Executive Summary

    1.1. Global Market Outlook

    1.2. Demand-side Trends

    1.3. Supply-side Trends

    1.4. Technology Roadmap Analysis

    1.5. Analysis and Recommendations

2. Market Overview

    2.1. Market Coverage / Taxonomy

    2.2. Market Definition / Scope / Limitations

3. Market Background

    3.1. Market Dynamics

        3.1.1. Drivers

        3.1.2. Restraints

        3.1.3. Opportunity 

        3.1.4. Trends

    3.2. Scenario Forecast

        3.2.1. Demand in Optimistic Scenario

        3.2.2. Demand in Likely Scenario

        3.2.3. Demand in Conservative Scenario

    3.3. Supply Chain Analysis

    3.4. Value Chain Analysis

        3.4.1. Profit Margin Analysis

        3.4.2. Wholesalers and Distributors

        3.4.3. Retailers

    3.5. PESTLE and Porter’s Analysis

4. Global Market Analysis 2017-2021 and Forecast, 2022-2032

    4.1. Historical Market Size Value (US$ Mn) & Volume (Tons) Analysis, 2017-2021

    4.2. Current and Future Market Size Value (US$ Mn) & Volume (Tons) Projections, 2022-2032

        4.2.1. Y-o-Y Growth Trend Analysis

        4.2.2. Absolute $ Opportunity Analysis

5. Global Market Analysis 2017-2021 and Forecast 2022-2032, By Material Type

    5.1. Introduction / Key Findings

    5.2. Historical Market Size Value (US$ Mn) & Volume (Tons) Analysis By Material Type, 2017-2021

    5.3. Current and Future Market Size Value (US$ Mn) & Volume (Tons) Analysis and Forecast By Material Type, 2022-2032

        5.3.1. Corrugated Board

        5.3.2. Specialty Paper

        5.3.3. Box Board/Carton Board

        5.3.4. Kraft Board

        5.3.5. Others

    5.4. Y-o-Y Growth Trend Analysis By Material Type, 2017-2021

    5.5. Absolute $ Opportunity Analysis By Material Type, 2022-2032

6. Global Market Analysis 2017-2021 and Forecast 2022-2032, By Package Type

    6.1. Introduction / Key Findings

    6.2. Historical Market Size Value (US$ Mn) & Volume (Tons) Analysis By Package Type, 2017-2021

    6.3. Current and Future Market Size Value (US$ Mn) & Volume (Tons) Analysis and Forecast By Package Type, 2022-2032

        6.3.1. Corrugated Boxes

        6.3.2. Cartons

        6.3.3. Wrapping Paper

        6.3.4. Cups & Tray

        6.3.5. Others

    6.4. Y-o-Y Growth Trend Analysis By Package Type, 2017-2021

    6.5. Absolute $ Opportunity Analysis By Package Type, 2022-2032

7. Global Market Analysis 2017-2021 and Forecast 2022-2032, By End-Use Industry

    7.1. Introduction / Key Findings

    7.2. Historical Market Size Value (US$ Mn) & Volume (Tons) Analysis By End-Use Industry, 2017-2021

    7.3. Current and Future Market Size Value (US$ Mn) & Volume (Tons) Analysis and Forecast By End-Use Industry, 2022-2032

        7.3.1. Food and Beverage

        7.3.2. Healthcare

        7.3.3. Personal Care & Cosmetics

        7.3.4. Homecare & Toileteries

        7.3.5. E-Commerce

        7.3.6. Chemical & Fertilizers

        7.3.7. Others

    7.4. Y-o-Y Growth Trend Analysis By End-Use Industry, 2017-2021

    7.5. Absolute $ Opportunity Analysis By End-Use Industry, 2022-2032

8. Global Market Analysis 2017-2021 and Forecast 2022-2032, By Region

    8.1. Introduction

    8.2. Historical Market Size Value (US$ Mn) & Volume (Tons) Analysis By Region, 2017-2021

    8.3. Current Market Size Value (US$ Mn) & Volume (Tons) Analysis and Forecast By Region, 2022-2032

        8.3.1. North America

        8.3.2. Latin America

        8.3.3. Europe

        8.3.4. East Asia

        8.3.5. South Asia

        8.3.6. Oceania

        8.3.7. MEA

    8.4. Market Attractiveness Analysis By Region

9. North America Market Analysis 2017-2021 and Forecast 2022-2032, By Country

    9.1. Historical Market Size Value (US$ Mn) & Volume (Tons) Trend Analysis By Market Taxonomy, 2017-2021

    9.2. Market Size Value (US$ Mn) & Volume (Tons) Forecast By Market Taxonomy, 2022-2032

        9.2.1. By Country

            9.2.1.1. U.S.

            9.2.1.2. Canada

        9.2.2. By Material Type

        9.2.3. By Package Type

        9.2.4. By End-Use Industry

    9.3. Market Attractiveness Analysis

        9.3.1. By Country

        9.3.2. By Material Type

        9.3.3. By Package Type

        9.3.4. By End-Use Industry

    9.4. Key Takeaways

10. Latin America Market Analysis 2017-2021 and Forecast 2022-2032, By Country

    10.1. Historical Market Size Value (US$ Mn) & Volume (Tons) Trend Analysis By Market Taxonomy, 2017-2021

    10.2. Market Size Value (US$ Mn) & Volume (Tons) Forecast By Market Taxonomy, 2022-2032

        10.2.1. By Country

            10.2.1.1. Brazil

            10.2.1.2. Mexico

            10.2.1.3. Rest of Latin America

        10.2.2. By Material Type

        10.2.3. By Package Type

        10.2.4. By End-Use Industry

    10.3. Market Attractiveness Analysis

        10.3.1. By Country

        10.3.2. By Material Type

        10.3.3. By Package Type

        10.3.4. By End-Use Industry

    10.4. Key Takeaways

11. Europe Market Analysis 2017-2021 and Forecast 2022-2032, By Country

    11.1. Historical Market Size Value (US$ Mn) & Volume (Tons) Trend Analysis By Market Taxonomy, 2017-2021

    11.2. Market Size Value (US$ Mn) & Volume (Tons) Forecast By Market Taxonomy, 2022-2032

        11.2.1. By Country

            11.2.1.1. Germany

            11.2.1.2. Italy

            11.2.1.3. France

            11.2.1.4. U.K.

            11.2.1.5. Spain

            11.2.1.6. Rest of Europe

        11.2.2. By Material Type

        11.2.3. By Package Type

        11.2.4. By End-Use Industry

    11.3. Market Attractiveness Analysis

        11.3.1. By Country

        11.3.2. By Material Type

        11.3.3. By Package Type

        11.3.4. By End-Use Industry

    11.4. Key Takeaways

12. East Asia Market Analysis 2017-2021 and Forecast 2022-2032, By Country

    12.1. Historical Market Size Value (US$ Mn) & Volume (Tons) Trend Analysis By Market Taxonomy, 2017-2021

    12.2. Market Size Value (US$ Mn) & Volume (Tons) Forecast By Market Taxonomy, 2022-2032

        12.2.1. By Country

            12.2.1.1. China

            12.2.1.2. Japan

            12.2.1.3. South Korea

        12.2.2. By Material Type

        12.2.3. By Package Type

        12.2.4. By End-Use Industry

    12.3. Market Attractiveness Analysis

        12.3.1. By Country

        12.3.2. By Material Type

        12.3.3. By Package Type

        12.3.4. By End-Use Industry

    12.4. Key Takeaways

13. South Asia Market Analysis 2017-2021 and Forecast 2022-2032, By Country

    13.1. Historical Market Size Value (US$ Mn) & Volume (Tons) Trend Analysis By Market Taxonomy, 2017-2021

    13.2. Market Size Value (US$ Mn) & Volume (Tons) Forecast By Market Taxonomy, 2022-2032

        13.2.1. By Country

            13.2.1.1. India

            13.2.1.2. Thailand

            13.2.1.3. Malaysia

            13.2.1.4. Indonesia

            13.2.1.5. Rest of South Asia

        13.2.2. By Material Type

        13.2.3. By Package Type

        13.2.4. By End-Use Industry

    13.3. Market Attractiveness Analysis

        13.3.1. By Country

        13.3.2. By Material Type

        13.3.3. By Package Type

        13.3.4. By End-Use Industry

    13.4. Key Takeaways

14. Oceania Market Analysis 2017-2021 and Forecast 2022-2032, By Country

    14.1. Historical Market Size Value (US$ Mn) & Volume (Tons) Trend Analysis By Market Taxonomy, 2017-2021

    14.2. Market Size Value (US$ Mn) & Volume (Tons) Forecast By Market Taxonomy, 2022-2032

        14.2.1. By Country

            14.2.1.1. Australia

            14.2.1.2. New Zealand

        14.2.2. By Material Type

        14.2.3. By Package Type

        14.2.4. By End-Use Industry

    14.3. Market Attractiveness Analysis

        14.3.1. By Country

        14.3.2. By Material Type

        14.3.3. By Package Type

        14.3.4. By End-Use Industry

    14.4. Key Takeaways

15. MEA Market Analysis 2017-2021 and Forecast 2022-2032, By Country

    15.1. Historical Market Size Value (US$ Mn) & Volume (Tons) Trend Analysis By Market Taxonomy, 2017-2021

    15.2. Market Size Value (US$ Mn) & Volume (Tons) Forecast By Market Taxonomy, 2022-2032

        15.2.1. By Country

            15.2.1.1. GCC

            15.2.1.2. South Africa

            15.2.1.3. North Africa

            15.2.1.4. Rest of MEA

        15.2.2. By Material Type

        15.2.3. By Package Type

        15.2.4. By End-Use Industry

    15.3. Market Attractiveness Analysis

        15.3.1. By Country

        15.3.2. By Material Type

        15.3.3. By Package Type

        15.3.4. By End-Use Industry

    15.4. Key Takeaways

16. Key Countries Market Analysis

    16.1. U.S

        16.1.1. Pricing Analysis

        16.1.2. Market Share Analysis, 2021

            16.1.2.1. By Material Type

            16.1.2.2. By Package Type

            16.1.2.3. By End-Use Industry

    16.2. Canada

        16.2.1. Pricing Analysis

        16.2.2. Market Share Analysis, 2021

            16.2.2.1. By Material Type

            16.2.2.2. By Package Type

            16.2.2.3. By End-Use Industry

    16.3. Brazil

        16.3.1. Pricing Analysis

        16.3.2. Market Share Analysis, 2021

            16.3.2.1. By Material Type

            16.3.2.2. By Package Type

            16.3.2.3. By End-Use Industry

    16.4. Mexico

        16.4.1. Pricing Analysis

        16.4.2. Market Share Analysis, 2021

            16.4.2.1. By Material Type

            16.4.2.2. By Package Type

            16.4.2.3. By End-Use Industry

    16.5. Germany

        16.5.1. Pricing Analysis

        16.5.2. Market Share Analysis, 2021

            16.5.2.1. By Material Type

            16.5.2.2. By Package Type

            16.5.2.3. By End-Use Industry

    16.6. Italy

        16.6.1. Pricing Analysis

        16.6.2. Market Share Analysis, 2021

            16.6.2.1. By Material Type

            16.6.2.2. By Package Type

            16.6.2.3. By End-Use Industry

    16.7. France

        16.7.1. Pricing Analysis

        16.7.2. Market Share Analysis, 2021

            16.7.2.1. By Material Type

            16.7.2.2. By Package Type

            16.7.2.3. By End-Use Industry

    16.8. U.K.

        16.8.1. Pricing Analysis

        16.8.2. Market Share Analysis, 2021

            16.8.2.1. By Material Type

            16.8.2.2. By Package Type

            16.8.2.3. By End-Use Industry

    16.9. Spain

        16.9.1. Pricing Analysis

        16.9.2. Market Share Analysis, 2021

            16.9.2.1. By Material Type

            16.9.2.2. By Package Type

            16.9.2.3. By End-Use Industry

    16.10. Rest of Europe

        16.10.1. Pricing Analysis

        16.10.2. Market Share Analysis, 2021

            16.10.2.1. By Material Type

            16.10.2.2. By Package Type

            16.10.2.3. By End-Use Industry

    16.11. China

        16.11.1. Pricing Analysis

        16.11.2. Market Share Analysis, 2021

            16.11.2.1. By Material Type

            16.11.2.2. By Package Type

            16.11.2.3. By End-Use Industry

    16.12. Japan

        16.12.1. Pricing Analysis

        16.12.2. Market Share Analysis, 2021

            16.12.2.1. By Material Type

            16.12.2.2. By Package Type

            16.12.2.3. By End-Use Industry

    16.13. South Korea

        16.13.1. Pricing Analysis

        16.13.2. Market Share Analysis, 2021

            16.13.2.1. By Material Type

            16.13.2.2. By Package Type

            16.13.2.3. By End-Use Industry

    16.14. India

        16.14.1. Pricing Analysis

        16.14.2. Market Share Analysis, 2021

            16.14.2.1. By Material Type

            16.14.2.2. By Package Type

            16.14.2.3. By End-Use Industry

    16.15. Australia

        16.15.1. Pricing Analysis

        16.15.2. Market Share Analysis, 2021

            16.15.2.1. By Material Type

            16.15.2.2. By Package Type

            16.15.2.3. By End-Use Industry

17. Market Structure Analysis

    17.1. Competition Dashboard

    17.2. Competition Benchmarking

    17.3. Market Share Analysis of Top Players

        17.3.1. By Regional

        17.3.2. By Material Type

        17.3.3. By Package Type

        17.3.4. By End-Use Industry

18. Competition Analysis

    18.1. Competition Deep Dive

        18.1.1. The Packaging Company

            18.1.1.1. Overview

            18.1.1.2. Product Portfolio

            18.1.1.3. Sales Footprint

            18.1.1.4. Strategy Overview

                18.1.1.4.1. Marketing Strategy

                18.1.1.4.2. Product Strategy

                18.1.1.4.3. Channel Strategy

        18.1.2. Pack Health

            18.1.2.1. Overview

            18.1.2.2. Product Portfolio

            18.1.2.3. Sales Footprint

            18.1.2.4. Strategy Overview

                18.1.2.4.1. Marketing Strategy

                18.1.2.4.2. Product Strategy

                18.1.2.4.3. Channel Strategy

        18.1.3. Ruskin Group

            18.1.3.1. Overview

            18.1.3.2. Product Portfolio

            18.1.3.3. Sales Footprint

            18.1.3.4. Strategy Overview

                18.1.3.4.1. Marketing Strategy

                18.1.3.4.2. Product Strategy

                18.1.3.4.3. Channel Strategy

        18.1.4. Purple Co.

            18.1.4.1. Overview

            18.1.4.2. Product Portfolio

            18.1.4.3. Sales Footprint

            18.1.4.4. Strategy Overview

                18.1.4.4.1. Marketing Strategy

                18.1.4.4.2. Product Strategy

                18.1.4.4.3. Channel Strategy

        18.1.5. Morya Packaging

            18.1.5.1. Overview

            18.1.5.2. Product Portfolio

            18.1.5.3. Sales Footprint

            18.1.5.4. Strategy Overview

                18.1.5.4.1. Marketing Strategy

                18.1.5.4.2. Product Strategy

                18.1.5.4.3. Channel Strategy

        18.1.6. Pratt Industries Inc

            18.1.6.1. Overview

            18.1.6.2. Product Portfolio

            18.1.6.3. Sales Footprint

            18.1.6.4. Strategy Overview

                18.1.6.4.1. Marketing Strategy

                18.1.6.4.2. Product Strategy

                18.1.6.4.3. Channel Strategy

        18.1.7. Mondi Group Plc

            18.1.7.1. Overview

            18.1.7.2. Product Portfolio

            18.1.7.3. Sales Footprint

            18.1.7.4. Strategy Overview

                18.1.7.4.1. Marketing Strategy

                18.1.7.4.2. Product Strategy

                18.1.7.4.3. Channel Strategy

        18.1.8. Westlock Company

            18.1.8.1. Overview

            18.1.8.2. Product Portfolio

            18.1.8.3. Sales Footprint

            18.1.8.4. Strategy Overview

                18.1.8.4.1. Marketing Strategy

                18.1.8.4.2. Product Strategy

                18.1.8.4.3. Channel Strategy

        18.1.9. Oji Holdings Corporation

            18.1.9.1. Overview

            18.1.9.2. Product Portfolio

            18.1.9.3. Sales Footprint

            18.1.9.4. Strategy Overview

                18.1.9.4.1. Marketing Strategy

                18.1.9.4.2. Product Strategy

                18.1.9.4.3. Channel Strategy

        18.1.10. DS Smith Packaging Ltd.

            18.1.10.1. Overview

            18.1.10.2. Product Portfolio

            18.1.10.3. Sales Footprint

            18.1.10.4. Strategy Overview

                18.1.10.4.1. Marketing Strategy

                18.1.10.4.2. Product Strategy

                18.1.10.4.3. Channel Strategy

        18.1.11. Tat Seng Packaging Group

            18.1.11.1. Overview

            18.1.11.2. Product Portfolio

            18.1.11.3. Sales Footprint

            18.1.11.4. Strategy Overview

                18.1.11.4.1. Marketing Strategy

                18.1.11.4.2. Product Strategy

                18.1.11.4.3. Channel Strategy

19. Assumptions & Acronyms Used

20. Research Methodology

Don't pay for what you don't need

Customize your report by selecting specific countries or regions and save 30%!

List of Tables

Table 1: Global Market Value (US$ Mn) Forecast by Region, 2017-2032

Table 2: Global Market Volume (Tons) Forecast by Region, 2017-2032

Table 3: Global Market Value (US$ Mn) Forecast by Material Type, 2017-2032

Table 4: Global Market Volume (Tons) Forecast by Material Type, 2017-2032

Table 5: Global Market Value (US$ Mn) Forecast by Package Type, 2017-2032

Table 6: Global Market Volume (Tons) Forecast by Package Type, 2017-2032

Table 7: Global Market Value (US$ Mn) Forecast by End-Use Industry, 2017-2032

Table 8: Global Market Volume (Tons) Forecast by End-Use Industry, 2017-2032

Table 9: North America Market Value (US$ Mn) Forecast by Country, 2017-2032

Table 10: North America Market Volume (Tons) Forecast by Country, 2017-2032

Table 11: North America Market Value (US$ Mn) Forecast by Material Type, 2017-2032

Table 12: North America Market Volume (Tons) Forecast by Material Type, 2017-2032

Table 13: North America Market Value (US$ Mn) Forecast by Package Type, 2017-2032

Table 14: North America Market Volume (Tons) Forecast by Package Type, 2017-2032

Table 15: North America Market Value (US$ Mn) Forecast by End-Use Industry, 2017-2032

Table 16: North America Market Volume (Tons) Forecast by End-Use Industry, 2017-2032

Table 17: Latin America Market Value (US$ Mn) Forecast by Country, 2017-2032

Table 18: Latin America Market Volume (Tons) Forecast by Country, 2017-2032

Table 19: Latin America Market Value (US$ Mn) Forecast by Material Type, 2017-2032

Table 20: Latin America Market Volume (Tons) Forecast by Material Type, 2017-2032

Table 21: Latin America Market Value (US$ Mn) Forecast by Package Type, 2017-2032

Table 22: Latin America Market Volume (Tons) Forecast by Package Type, 2017-2032

Table 23: Latin America Market Value (US$ Mn) Forecast by End-Use Industry, 2017-2032

Table 24: Latin America Market Volume (Tons) Forecast by End-Use Industry, 2017-2032

Table 25: Europe Market Value (US$ Mn) Forecast by Country, 2017-2032

Table 26: Europe Market Volume (Tons) Forecast by Country, 2017-2032

Table 27: Europe Market Value (US$ Mn) Forecast by Material Type, 2017-2032

Table 28: Europe Market Volume (Tons) Forecast by Material Type, 2017-2032

Table 29: Europe Market Value (US$ Mn) Forecast by Package Type, 2017-2032

Table 30: Europe Market Volume (Tons) Forecast by Package Type, 2017-2032

Table 31: Europe Market Value (US$ Mn) Forecast by End-Use Industry, 2017-2032

Table 32: Europe Market Volume (Tons) Forecast by End-Use Industry, 2017-2032

Table 33: East Asia Market Value (US$ Mn) Forecast by Country, 2017-2032

Table 34: East Asia Market Volume (Tons) Forecast by Country, 2017-2032

Table 35: East Asia Market Value (US$ Mn) Forecast by Material Type, 2017-2032

Table 36: East Asia Market Volume (Tons) Forecast by Material Type, 2017-2032

Table 37: East Asia Market Value (US$ Mn) Forecast by Package Type, 2017-2032

Table 38: East Asia Market Volume (Tons) Forecast by Package Type, 2017-2032

Table 39: East Asia Market Value (US$ Mn) Forecast by End-Use Industry, 2017-2032

Table 40: East Asia Market Volume (Tons) Forecast by End-Use Industry, 2017-2032

Table 41: South Asia Market Value (US$ Mn) Forecast by Country, 2017-2032

Table 42: South Asia Market Volume (Tons) Forecast by Country, 2017-2032

Table 43: South Asia Market Value (US$ Mn) Forecast by Material Type, 2017-2032

Table 44: South Asia Market Volume (Tons) Forecast by Material Type, 2017-2032

Table 45: South Asia Market Value (US$ Mn) Forecast by Package Type, 2017-2032

Table 46: South Asia Market Volume (Tons) Forecast by Package Type, 2017-2032

Table 47: South Asia Market Value (US$ Mn) Forecast by End-Use Industry, 2017-2032

Table 48: South Asia Market Volume (Tons) Forecast by End-Use Industry, 2017-2032

Table 49: Oceania Market Value (US$ Mn) Forecast by Country, 2017-2032

Table 50: Oceania Market Volume (Tons) Forecast by Country, 2017-2032

Table 51: Oceania Market Value (US$ Mn) Forecast by Material Type, 2017-2032

Table 52: Oceania Market Volume (Tons) Forecast by Material Type, 2017-2032

Table 53: Oceania Market Value (US$ Mn) Forecast by Package Type, 2017-2032

Table 54: Oceania Market Volume (Tons) Forecast by Package Type, 2017-2032

Table 55: Oceania Market Value (US$ Mn) Forecast by End-Use Industry, 2017-2032

Table 56: Oceania Market Volume (Tons) Forecast by End-Use Industry, 2017-2032

Table 57: MEA Market Value (US$ Mn) Forecast by Country, 2017-2032

Table 58: MEA Market Volume (Tons) Forecast by Country, 2017-2032

Table 59: MEA Market Value (US$ Mn) Forecast by Material Type, 2017-2032

Table 60: MEA Market Volume (Tons) Forecast by Material Type, 2017-2032

Table 61: MEA Market Value (US$ Mn) Forecast by Package Type, 2017-2032

Table 62: MEA Market Volume (Tons) Forecast by Package Type, 2017-2032

Table 63: MEA Market Value (US$ Mn) Forecast by End-Use Industry, 2017-2032

Table 64: MEA Market Volume (Tons) Forecast by End-Use Industry, 2017-2032
Ismail Sutaria
Ismail Sutaria

Principal Consultant

Talk to Analyst

Find your sweet spots for generating winning opportunities in this market.

List of Charts

Figure 1: Global Market Value (US$ Mn) by Material Type, 2022-2032

Figure 2: Global Market Value (US$ Mn) by Package Type, 2022-2032

Figure 3: Global Market Value (US$ Mn) by End-Use Industry, 2022-2032

Figure 4: Global Market Value (US$ Mn) by Region, 2022-2032

Figure 5: Global Market Value (US$ Mn) Analysis by Region, 2017-2032

Figure 6: Global Market Volume (Tons) Analysis by Region, 2017-2032

Figure 7: Global Market Value Share (%) and BPS Analysis by Region, 2022-2032

Figure 8: Global Market Y-o-Y Growth (%) Projections by Region, 2022-2032

Figure 9: Global Market Value (US$ Mn) Analysis by Material Type, 2017-2032

Figure 10: Global Market Volume (Tons) Analysis by Material Type, 2017-2032

Figure 11: Global Market Value Share (%) and BPS Analysis by Material Type, 2022-2032

Figure 12: Global Market Y-o-Y Growth (%) Projections by Material Type, 2022-2032

Figure 13: Global Market Value (US$ Mn) Analysis by Package Type, 2017-2032

Figure 14: Global Market Volume (Tons) Analysis by Package Type, 2017-2032

Figure 15: Global Market Value Share (%) and BPS Analysis by Package Type, 2022-2032

Figure 16: Global Market Y-o-Y Growth (%) Projections by Package Type, 2022-2032

Figure 17: Global Market Value (US$ Mn) Analysis by End-Use Industry, 2017-2032

Figure 18: Global Market Volume (Tons) Analysis by End-Use Industry, 2017-2032

Figure 19: Global Market Value Share (%) and BPS Analysis by End-Use Industry, 2022-2032

Figure 20: Global Market Y-o-Y Growth (%) Projections by End-Use Industry, 2022-2032

Figure 21: Global Market Attractiveness by Material Type, 2022-2032

Figure 22: Global Market Attractiveness by Package Type, 2022-2032

Figure 23: Global Market Attractiveness by End-Use Industry, 2022-2032

Figure 24: Global Market Attractiveness by Region, 2022-2032

Figure 25: North America Market Value (US$ Mn) by Material Type, 2022-2032

Figure 26: North America Market Value (US$ Mn) by Package Type, 2022-2032

Figure 27: North America Market Value (US$ Mn) by End-Use Industry, 2022-2032

Figure 28: North America Market Value (US$ Mn) by Country, 2022-2032

Figure 29: North America Market Value (US$ Mn) Analysis by Country, 2017-2032

Figure 30: North America Market Volume (Tons) Analysis by Country, 2017-2032

Figure 31: North America Market Value Share (%) and BPS Analysis by Country, 2022-2032

Figure 32: North America Market Y-o-Y Growth (%) Projections by Country, 2022-2032

Figure 33: North America Market Value (US$ Mn) Analysis by Material Type, 2017-2032

Figure 34: North America Market Volume (Tons) Analysis by Material Type, 2017-2032

Figure 35: North America Market Value Share (%) and BPS Analysis by Material Type, 2022-2032

Figure 36: North America Market Y-o-Y Growth (%) Projections by Material Type, 2022-2032

Figure 37: North America Market Value (US$ Mn) Analysis by Package Type, 2017-2032

Figure 38: North America Market Volume (Tons) Analysis by Package Type, 2017-2032

Figure 39: North America Market Value Share (%) and BPS Analysis by Package Type, 2022-2032

Figure 40: North America Market Y-o-Y Growth (%) Projections by Package Type, 2022-2032

Figure 41: North America Market Value (US$ Mn) Analysis by End-Use Industry, 2017-2032

Figure 42: North America Market Volume (Tons) Analysis by End-Use Industry, 2017-2032

Figure 43: North America Market Value Share (%) and BPS Analysis by End-Use Industry, 2022-2032

Figure 44: North America Market Y-o-Y Growth (%) Projections by End-Use Industry, 2022-2032

Figure 45: North America Market Attractiveness by Material Type, 2022-2032

Figure 46: North America Market Attractiveness by Package Type, 2022-2032

Figure 47: North America Market Attractiveness by End-Use Industry, 2022-2032

Figure 48: North America Market Attractiveness by Country, 2022-2032

Figure 49: Latin America Market Value (US$ Mn) by Material Type, 2022-2032

Figure 50: Latin America Market Value (US$ Mn) by Package Type, 2022-2032

Figure 51: Latin America Market Value (US$ Mn) by End-Use Industry, 2022-2032

Figure 52: Latin America Market Value (US$ Mn) by Country, 2022-2032

Figure 53: Latin America Market Value (US$ Mn) Analysis by Country, 2017-2032

Figure 54: Latin America Market Volume (Tons) Analysis by Country, 2017-2032

Figure 55: Latin America Market Value Share (%) and BPS Analysis by Country, 2022-2032

Figure 56: Latin America Market Y-o-Y Growth (%) Projections by Country, 2022-2032

Figure 57: Latin America Market Value (US$ Mn) Analysis by Material Type, 2017-2032

Figure 58: Latin America Market Volume (Tons) Analysis by Material Type, 2017-2032

Figure 59: Latin America Market Value Share (%) and BPS Analysis by Material Type, 2022-2032

Figure 60: Latin America Market Y-o-Y Growth (%) Projections by Material Type, 2022-2032

Figure 61: Latin America Market Value (US$ Mn) Analysis by Package Type, 2017-2032

Figure 62: Latin America Market Volume (Tons) Analysis by Package Type, 2017-2032

Figure 63: Latin America Market Value Share (%) and BPS Analysis by Package Type, 2022-2032

Figure 64: Latin America Market Y-o-Y Growth (%) Projections by Package Type, 2022-2032

Figure 65: Latin America Market Value (US$ Mn) Analysis by End-Use Industry, 2017-2032

Figure 66: Latin America Market Volume (Tons) Analysis by End-Use Industry, 2017-2032

Figure 67: Latin America Market Value Share (%) and BPS Analysis by End-Use Industry, 2022-2032

Figure 68: Latin America Market Y-o-Y Growth (%) Projections by End-Use Industry, 2022-2032

Figure 69: Latin America Market Attractiveness by Material Type, 2022-2032

Figure 70: Latin America Market Attractiveness by Package Type, 2022-2032

Figure 71: Latin America Market Attractiveness by End-Use Industry, 2022-2032

Figure 72: Latin America Market Attractiveness by Country, 2022-2032

Figure 73: Europe Market Value (US$ Mn) by Material Type, 2022-2032

Figure 74: Europe Market Value (US$ Mn) by Package Type, 2022-2032

Figure 75: Europe Market Value (US$ Mn) by End-Use Industry, 2022-2032

Figure 76: Europe Market Value (US$ Mn) by Country, 2022-2032

Figure 77: Europe Market Value (US$ Mn) Analysis by Country, 2017-2032

Figure 78: Europe Market Volume (Tons) Analysis by Country, 2017-2032

Figure 79: Europe Market Value Share (%) and BPS Analysis by Country, 2022-2032

Figure 80: Europe Market Y-o-Y Growth (%) Projections by Country, 2022-2032

Figure 81: Europe Market Value (US$ Mn) Analysis by Material Type, 2017-2032

Figure 82: Europe Market Volume (Tons) Analysis by Material Type, 2017-2032

Figure 83: Europe Market Value Share (%) and BPS Analysis by Material Type, 2022-2032

Figure 84: Europe Market Y-o-Y Growth (%) Projections by Material Type, 2022-2032

Figure 85: Europe Market Value (US$ Mn) Analysis by Package Type, 2017-2032

Figure 86: Europe Market Volume (Tons) Analysis by Package Type, 2017-2032

Figure 87: Europe Market Value Share (%) and BPS Analysis by Package Type, 2022-2032

Figure 88: Europe Market Y-o-Y Growth (%) Projections by Package Type, 2022-2032

Figure 89: Europe Market Value (US$ Mn) Analysis by End-Use Industry, 2017-2032

Figure 90: Europe Market Volume (Tons) Analysis by End-Use Industry, 2017-2032

Figure 91: Europe Market Value Share (%) and BPS Analysis by End-Use Industry, 2022-2032

Figure 92: Europe Market Y-o-Y Growth (%) Projections by End-Use Industry, 2022-2032

Figure 93: Europe Market Attractiveness by Material Type, 2022-2032

Figure 94: Europe Market Attractiveness by Package Type, 2022-2032

Figure 95: Europe Market Attractiveness by End-Use Industry, 2022-2032

Figure 96: Europe Market Attractiveness by Country, 2022-2032

Figure 97: East Asia Market Value (US$ Mn) by Material Type, 2022-2032

Figure 98: East Asia Market Value (US$ Mn) by Package Type, 2022-2032

Figure 99: East Asia Market Value (US$ Mn) by End-Use Industry, 2022-2032

Figure 100: East Asia Market Value (US$ Mn) by Country, 2022-2032

Figure 101: East Asia Market Value (US$ Mn) Analysis by Country, 2017-2032

Figure 102: East Asia Market Volume (Tons) Analysis by Country, 2017-2032

Figure 103: East Asia Market Value Share (%) and BPS Analysis by Country, 2022-2032

Figure 104: East Asia Market Y-o-Y Growth (%) Projections by Country, 2022-2032

Figure 105: East Asia Market Value (US$ Mn) Analysis by Material Type, 2017-2032

Figure 106: East Asia Market Volume (Tons) Analysis by Material Type, 2017-2032

Figure 107: East Asia Market Value Share (%) and BPS Analysis by Material Type, 2022-2032

Figure 108: East Asia Market Y-o-Y Growth (%) Projections by Material Type, 2022-2032

Figure 109: East Asia Market Value (US$ Mn) Analysis by Package Type, 2017-2032

Figure 110: East Asia Market Volume (Tons) Analysis by Package Type, 2017-2032

Figure 111: East Asia Market Value Share (%) and BPS Analysis by Package Type, 2022-2032

Figure 112: East Asia Market Y-o-Y Growth (%) Projections by Package Type, 2022-2032

Figure 113: East Asia Market Value (US$ Mn) Analysis by End-Use Industry, 2017-2032

Figure 114: East Asia Market Volume (Tons) Analysis by End-Use Industry, 2017-2032

Figure 115: East Asia Market Value Share (%) and BPS Analysis by End-Use Industry, 2022-2032

Figure 116: East Asia Market Y-o-Y Growth (%) Projections by End-Use Industry, 2022-2032

Figure 117: East Asia Market Attractiveness by Material Type, 2022-2032

Figure 118: East Asia Market Attractiveness by Package Type, 2022-2032

Figure 119: East Asia Market Attractiveness by End-Use Industry, 2022-2032

Figure 120: East Asia Market Attractiveness by Country, 2022-2032

Figure 121: South Asia Market Value (US$ Mn) by Material Type, 2022-2032

Figure 122: South Asia Market Value (US$ Mn) by Package Type, 2022-2032

Figure 123: South Asia Market Value (US$ Mn) by End-Use Industry, 2022-2032

Figure 124: South Asia Market Value (US$ Mn) by Country, 2022-2032

Figure 125: South Asia Market Value (US$ Mn) Analysis by Country, 2017-2032

Figure 126: South Asia Market Volume (Tons) Analysis by Country, 2017-2032

Figure 127: South Asia Market Value Share (%) and BPS Analysis by Country, 2022-2032

Figure 128: South Asia Market Y-o-Y Growth (%) Projections by Country, 2022-2032

Figure 129: South Asia Market Value (US$ Mn) Analysis by Material Type, 2017-2032

Figure 130: South Asia Market Volume (Tons) Analysis by Material Type, 2017-2032

Figure 131: South Asia Market Value Share (%) and BPS Analysis by Material Type, 2022-2032

Figure 132: South Asia Market Y-o-Y Growth (%) Projections by Material Type, 2022-2032

Figure 133: South Asia Market Value (US$ Mn) Analysis by Package Type, 2017-2032

Figure 134: South Asia Market Volume (Tons) Analysis by Package Type, 2017-2032

Figure 135: South Asia Market Value Share (%) and BPS Analysis by Package Type, 2022-2032

Figure 136: South Asia Market Y-o-Y Growth (%) Projections by Package Type, 2022-2032

Figure 137: South Asia Market Value (US$ Mn) Analysis by End-Use Industry, 2017-2032

Figure 138: South Asia Market Volume (Tons) Analysis by End-Use Industry, 2017-2032

Figure 139: South Asia Market Value Share (%) and BPS Analysis by End-Use Industry, 2022-2032

Figure 140: South Asia Market Y-o-Y Growth (%) Projections by End-Use Industry, 2022-2032

Figure 141: South Asia Market Attractiveness by Material Type, 2022-2032

Figure 142: South Asia Market Attractiveness by Package Type, 2022-2032

Figure 143: South Asia Market Attractiveness by End-Use Industry, 2022-2032

Figure 144: South Asia Market Attractiveness by Country, 2022-2032

Figure 145: Oceania Market Value (US$ Mn) by Material Type, 2022-2032

Figure 146: Oceania Market Value (US$ Mn) by Package Type, 2022-2032

Figure 147: Oceania Market Value (US$ Mn) by End-Use Industry, 2022-2032

Figure 148: Oceania Market Value (US$ Mn) by Country, 2022-2032

Figure 149: Oceania Market Value (US$ Mn) Analysis by Country, 2017-2032

Figure 150: Oceania Market Volume (Tons) Analysis by Country, 2017-2032

Figure 151: Oceania Market Value Share (%) and BPS Analysis by Country, 2022-2032

Figure 152: Oceania Market Y-o-Y Growth (%) Projections by Country, 2022-2032

Figure 153: Oceania Market Value (US$ Mn) Analysis by Material Type, 2017-2032

Figure 154: Oceania Market Volume (Tons) Analysis by Material Type, 2017-2032

Figure 155: Oceania Market Value Share (%) and BPS Analysis by Material Type, 2022-2032

Figure 156: Oceania Market Y-o-Y Growth (%) Projections by Material Type, 2022-2032

Figure 157: Oceania Market Value (US$ Mn) Analysis by Package Type, 2017-2032

Figure 158: Oceania Market Volume (Tons) Analysis by Package Type, 2017-2032

Figure 159: Oceania Market Value Share (%) and BPS Analysis by Package Type, 2022-2032

Figure 160: Oceania Market Y-o-Y Growth (%) Projections by Package Type, 2022-2032

Figure 161: Oceania Market Value (US$ Mn) Analysis by End-Use Industry, 2017-2032

Figure 162: Oceania Market Volume (Tons) Analysis by End-Use Industry, 2017-2032

Figure 163: Oceania Market Value Share (%) and BPS Analysis by End-Use Industry, 2022-2032

Figure 164: Oceania Market Y-o-Y Growth (%) Projections by End-Use Industry, 2022-2032

Figure 165: Oceania Market Attractiveness by Material Type, 2022-2032

Figure 166: Oceania Market Attractiveness by Package Type, 2022-2032

Figure 167: Oceania Market Attractiveness by End-Use Industry, 2022-2032

Figure 168: Oceania Market Attractiveness by Country, 2022-2032

Figure 169: MEA Market Value (US$ Mn) by Material Type, 2022-2032

Figure 170: MEA Market Value (US$ Mn) by Package Type, 2022-2032

Figure 171: MEA Market Value (US$ Mn) by End-Use Industry, 2022-2032

Figure 172: MEA Market Value (US$ Mn) by Country, 2022-2032

Figure 173: MEA Market Value (US$ Mn) Analysis by Country, 2017-2032

Figure 174: MEA Market Volume (Tons) Analysis by Country, 2017-2032

Figure 175: MEA Market Value Share (%) and BPS Analysis by Country, 2022-2032

Figure 176: MEA Market Y-o-Y Growth (%) Projections by Country, 2022-2032

Figure 177: MEA Market Value (US$ Mn) Analysis by Material Type, 2017-2032

Figure 178: MEA Market Volume (Tons) Analysis by Material Type, 2017-2032

Figure 179: MEA Market Value Share (%) and BPS Analysis by Material Type, 2022-2032

Figure 180: MEA Market Y-o-Y Growth (%) Projections by Material Type, 2022-2032

Figure 181: MEA Market Value (US$ Mn) Analysis by Package Type, 2017-2032

Figure 182: MEA Market Volume (Tons) Analysis by Package Type, 2017-2032

Figure 183: MEA Market Value Share (%) and BPS Analysis by Package Type, 2022-2032

Figure 184: MEA Market Y-o-Y Growth (%) Projections by Package Type, 2022-2032

Figure 185: MEA Market Value (US$ Mn) Analysis by End-Use Industry, 2017-2032

Figure 186: MEA Market Volume (Tons) Analysis by End-Use Industry, 2017-2032

Figure 187: MEA Market Value Share (%) and BPS Analysis by End-Use Industry, 2022-2032

Figure 188: MEA Market Y-o-Y Growth (%) Projections by End-Use Industry, 2022-2032

Figure 189: MEA Market Attractiveness by Material Type, 2022-2032

Figure 190: MEA Market Attractiveness by Package Type, 2022-2032

Figure 191: MEA Market Attractiveness by End-Use Industry, 2022-2032

Figure 192: MEA Market Attractiveness by Country, 2022-2032

Recommendations

Packaging

Flexible Packaging Paper Market

Published : March 2024

Packaging

Specialty Paper Market

Published : February 2023

Packaging

Billing Paper Market

Published : February 2023

Explore Packaging Insights

View Reports