Oil Packing Machine Market
Market Insights on Oil Packing Machine covering sales outlook, demand forecast & up-to-date key trends
Oil Packing Machine Market by Automation, Orientation, End Use & Region- Forecast to 2022-2032
Oil Packing Machine Market Outlook (2022-2032)
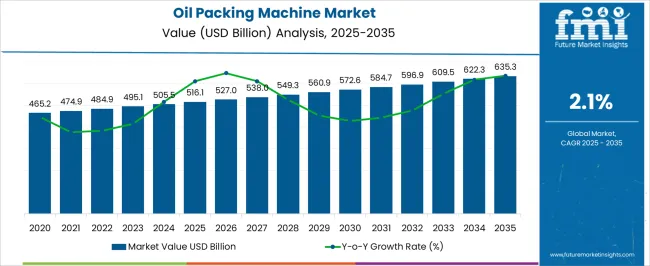
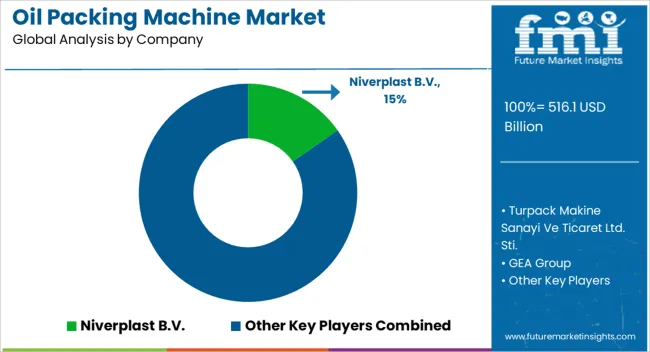
[201 Pages Report] According to Future Market Insights research, during the projected period, the global oil packing machine market is set to enjoy a market valuation of US$ 225.6 Mn in 2022, and register a CAGR of 4.3% to reach US$ 344.6 Mn by 2032. The oil packing machine market revenues are expected to fuel with the top 5 companies estimated to hold 20-25% of the global oil packing machine market by the end of 2022.
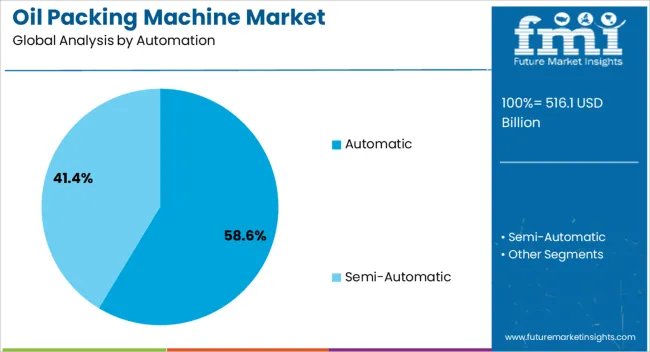
The automatic oil packing machine segment by automation is expected to hold around 70% of the market value share by the end of 2032 due to the growing trend for automation along with the adoption of latest technology by the end use industries.
Market Size 2022 |
US$ 225.6 Mn |
Market Size 2032 |
US$ 344.6 Mn |
Value CAGR (2022-2032) |
4.3% |
Collective Value Share: Top 3 Countries (2022E) |
35-40% |
As per FMI estimates, the oil packing machine market is projected to reach US$ 225.6 Mn, with global revenues up by 3.2% in 2022.
With the rising adoption of oil packing machine by the end-use industries for safe and hygienic packaging and to achieve improved productivity and efficiency, the oil packing machine market is expected to represent an incremental opportunity of US$ 119.0 Mn during 2022-2032.
South Asia is expected to witness the highest CAGR during the forecasted period, owing to the increase in the manufacture and sales of oil packing machine coupled with other factors such as growing population and urbanization in the region.
Let us know your requirement to get
100% FREE customization
Historic Market Outlook for Oil Packing Machine
The global oil packing machine market has been witnessing consistent growth over the last few years and is expected to grow at a CAGR of 4.3% over the forecasted period, compared to its historical CAGR of 3.2%. The adoption of oil packing machine by the end-use industries is increasing in recent years due to technological advancements such as automation which helps the end-users reduce their labour costs and improve productivity and efficiency.
Oil packing machine is widely used in food industries, which is expected to create significant demand due to the growing demand for safe and hygienic packing of cooking oils from the people. Also, the rising spending by people on skin and hair care products is expected to boost the growth of the oil packing machine market. Thus, the oil packing machine market is anticipated to create immense revenue opportunities with an expansion of 1.5x its current market value by 2032.
How is Oil Packaging in Small SKUs, a Growing Trend Paving the Growth of the Oil Packing Machine Market?
There has been a massive shift in buying patterns of the consumers when it comes to edible oil. The increasing awareness of food safety and hygiene among consumers has shifted their consumption preference from loose to packed oil. This shift towards packaged oil is not just seen in urban areas but in rural areas too. The trend of oil packaging in small SKUs (stock keeping units) has led the edible oils packaged segment to grow the rate of the consumption of edible oil in the world. Consumers are opting for cooking oil in small flexible pouches, which are easy to carry and store and are less costly. Thus, the oil packaging in small SKUs (stock keeping units) is expected to augment the sales of oil packing machine in the next few years.
Find your sweet spots for generating winning opportunities in this market.
Talk to AnalystHow are the Technological Advancements Paving the Growth of the Oil Packing Machine Market?
The key players in the oil packing machine market are focusing on adopting advanced technologies such as introducing new filling techniques and automating the operations. The introduction of automatic oil packing machine helps increase production to meet the large consumer demands and maintain high time and efficiency rate records in the filling process.
For instance,
- Clearpack introduced contactless and accurate net weight filling technology for high production environment.
How much is the Growth Potential of the US Market?
Due to a change in lifestyle, there is a surge in the number of brands in many product categories, and there is a big need for food oil packaging in North America. Because of ready-to-eat meals, take-home food items, and online food delivery services, the global market for food oil packaging has also grown in this area.

A unified Market Research Subscription Platform, built for today's disparate research needs.
What is the Growth Outlook for the Europe Market?
In 2016, the average daily production of oil reached roughly 80.6 million barrels. The top 10 oil-producing nations account for more than 68% of global oil output. Only Oceania produces less oil than Europe, which is one of the least oil-producing continents. In Europe, Russia produces the most oil. Norway and the United Kingdom are two other significant oil-producing nations in Europe.
How is the Performance of Russia in the Global Oil Packing Machine Market?
With an annual oil production of over 540.7 million tonnes, Russia is both the top oil producer in the world and the greatest oil producer in Europe. The eighth-largest oil reserves in the world are in Russia. The Eastern Siberian region of Russia is thought to have more than 4.5 billion barrels of proven oil reserves, according to data supplied by the Russian Ministry of Natural Resources in 2005. Additionally, according to the Ministry, there are up to 10.9 million tonnes of proven oil reserves in the entire nation. The number of oil reserves in Western Siberia, where most of Russia's oil production occurs, is unknown, though.
According to estimates from Wood Mackenzie, Western Siberia may contain up to 2 trillion barrels of oil. In December 2015, Russia produced 10.83 million barrels of oil per day on average. The second-largest oil exporter in the world, Russia, exports roughly 70% of its oil, making it one of the top exports from the nation.
Norway is a Significant Oil Packing Machine Market
Norway is the second-largest oil producer in Europe, with an estimated 88 million tonnes of oil produced there each year. In the 1960s, oil was first found in the North Sea off the coast of Norway. Since its discovery, crude oil has surpassed all other exportable goods in Norway, making up around 40% of the nation's annual exports. 17% or so of Norway's GDP is accounted for by the petroleum sector. The Norwegian government deposits a portion of its earnings from the oil business into a fund known as the Government Pension Fund Global as a precaution against the consequences of changes in global oil prices.
About a third of the world's untapped oil reserves are located in the Barents Sea, according to the Ministry of Foreign Affairs, which also declared that the government intended to use these vast reserves. The administration announced plans to conduct oil exploration in the Arctic region as a result of the current thinning of the Arctic ice.
What is the Growth Outlook for the United Kingdom?
With an anticipated yearly oil production of up to 45.3 million tonnes, the United Kingdom ranks third among European oil producers. The nation ranks as the world's 19th-largest oil producer. In Scotland, oil was initially discovered in the 19th century, but production peaked quite rapidly. Early in the 20th century, large oil resources in Derbyshire and Eakring were found. The UK's offshore oil platforms contain enormous oil reserves, yet despite this, the country's oil production is in decline after reaching a high in the late 20th century. According to estimates, the UK's oil production is declining at a pace of roughly 7.5% each year.
How much is the Growth Potential of the Japanese and Korea Market?
Most of the world market for lubricant packaging is in the Asia-Pacific area. The fast-paced development of the automotive and power-generating industries has a big impact on the expansion of the market in this area. As a result of rising disposable income and rising car ownership, lubricant demand has increased. Market expansion is also being fuelled by the expanding use of transformer oil and turbine oil in the expanding power generation sector in China, India, Indonesia, Korea, and other nations.
Some of the key data points used to estimate the market situation for specific nations are consumption volumes, production sites and volumes, import-export analysis, price trend analysis, cost of raw materials, and upstream and downstream value chain analysis. When giving prediction analysis of the country data, it also considers the presence and accessibility of international brands, the difficulties they encounter owing to strong or weak competition from local and domestic brands, the influence of domestic tariffs, and trade routes. The growth in the Asia-Pacific region is astonishing. Additionally, the urge for online meal ordering is growing in a country like India, which is fuelling the market for food oil packing.
Country-wise Insights
How is the China’s Automotive Industry Augmenting the Sales of Oil Packing Machine?
As per data by International Trade Administration, China remained the world’s largest automotive market in terms of annual sales and manufacturing output. Domestic production in China is expected to reach 35 million vehicles by the end of 2025. The increase in foreign direct investment by the international automakers and partnerships with the Chinese automakers is driving the growth of the automotive industry in the country. The increasing penetration of motor vehicles in the market demands more motor oil, thereby creating demand for oil packing machine by the oil & lubricant industries.
How is Edible Oil Consumption in India Expected to Boost the Growth of the Oil Packing Machine Market?
India is one of the major oilseeds growing countries in the world. According to the Department of Food & Public Distribution, the production of oilseeds accounts for 36.56 million tons of the total nine cultivated oilseeds during the year 2020-21(Nov.-Oct.). India is the second largest consumer of vegetable oil in the world. The consumption of vegetable oil in India is expected to remain high due to high growth in population and urbanization. Thus, the need for packaging edible oils to meet the growing demand is expected to create lucrative growth opportunities for oil packing machine manufacturers in the next few years.
Category-wise Insights
Why is the Automatic Remain the Most Preferred Automation Segment among the End Use Industries?
The automatic oil packing machine is anticipated to lead the global market and is estimated to create revenue opportunities of US$ 84.9 Mn by the end of the forecast period. The high preference for this machine is due to its attributes such as improved quality control, reduced labour costs, improved productivity, reliability and versatility. The increasing adoption of automatic oil packing machine among the end users due to their high productivity and efficiency is likely to boost the growth of the oil packing machine market in the next few years.
How is Food Industry expected to lead the Oil Packing Machine Market during the Forecast Period?
The food industry is the largest end-user of the oil packing machine and is expected to maintain its share during the forecast period. This end-use industry is anticipated to expand 1.5x its current market value and is projected to grow at a steady CAGR of 3.7% between 2022 and 2032. The growing population coupled with the flourishing food service sector is resulting in high consumption of edible oils, thereby creating demand for oil packing machine. Therefore, the need for safe and hygienic packaging of oil in the food industry would create immense opportunities for oil packing machine manufacturers in the coming years.
The image below depicts market characteristics and attributes with regional relevance in the global oil packing machine market. Europe, being the matured market, have high competitiveness due to the presence of regional players. Middle East & Africa hold lucrative growth opportunities for the oil packing machine manufacturers, as there are fewer barriers to new entrants and low competitiveness in this region. South Asia is witnessing new entrants due to the fewer barriers to entry and more demand for oil packing machine in the region.
Competitive Landscape
The oil packing machine market is fragmented and competitive, with the key players driving the market growth with frequent product launches. The leading players in the market focus on various tactics such as collaborations, mergers & acquisitions and partnerships to propel their market growth. Some of the recent developments in the oil packing machine market are as follows:
For instance,
- In July 2020, Nichrome added a new product Filpack Servo SMD to its cooking oil packaging machine portfolio. Filpack Servo SMD is a compact, durable, easy-to-operate and maintain oil packaging machine and includes PLC to control operations.
Scope of Report
Attribute |
Details |
Growth Rate |
CAGR of 4.3% from 2022 to 2032 |
Base Year for Estimation |
2021 |
Historical Data |
2015-2020 |
Forecast Period |
2022-2032 |
Quantitative Units |
Revenue in USD Million, Volume in Units, and CAGR from 2022-2032 |
Report Coverage |
Revenue Forecast, Volume Forecast, Company Ranking, Competitive Landscape, Growth Factors, Trends, and Pricing Analysis |
Segments Covered |
|
Regions Covered |
|
Key Countries Covered |
|
Key Companies Profiled |
|
Customization & Pricing |
Available upon Request |
Oil Packing Machine Market by Category
By Automation, the Oil Packing Machine Market is Segmented as:
- Automatic
- Semi-automatic
By Orientation, the Oil Packing Machine Market is Segmented as:
- VFFS Machine
- HFFS Machine
By End Use, the Oil Packing Machine Market is Segmented as:
- Food
- Cosmetic & Personal Care
- Pharmaceutical
- Oil & Lubricant
By Region, the Oil Packing Machine Market is Segmented as:
- North America
- Latin America
- Europe
- Middle East and Africa (MEA)
- East Asia
- South Asia
- Oceania
Frequently Asked Questions
The global oil packing machine market is estimated to witness a growth rate of 4.3% during 2022-2032.
The global oil packing machine market was valued at US$ 218.7 Mn in 2021.
Food as an end use segmnt is expected to represent the highest incremental opportunity of US$ 42.4 Mn by 2032.
Automatic oil packing machine segment is expected to lead the market between 2022 and 2032.
As per FMI estimates, Europe is expected to remain the dominant region during the forecast period.
Table of Content
1. Executive Summary
1.1. Global Market Outlook
1.2. Demand-side Trends
1.3. Supply-side Trends
1.4. Technology Roadmap Analysis
1.5. Analysis and Recommendations
2. Market Overview
2.1. Market Coverage / Taxonomy
2.2. Market Definition / Scope / Limitations
3. Market Background
3.1. Market Dynamics
3.1.1. Drivers
3.1.2. Restraints
3.1.3. Opportunity
3.1.4. Trends
3.2. Impact of Covid-19
3.2.1. Demand in Optimistic Scenario
3.2.2. Demand in Likely Scenario
3.2.3. Demand in Conservative Scenario
3.3. Macro Factors and Forecast Factors
3.4. Value Chain Analysis
3.4.1. Profit Margin Analysis
3.4.2. Raw Automation Suppliers
3.4.3. Manufacturers, Wholesalers and Distributors
3.4.4. End Users / Customers
3.5. Regional Parent Market Outlook
3.6. Production and Consumption Statistics
3.7. Global Average Pricing Analysis Benchmark
4. Global Oil Packing Machine Market Analysis 2015-2021 and Forecast, 2022-2032
4.1. Historical Market Size Value (US$ Bn) & Volume (Units) Analysis, 2015-2021
4.2. Current and Future Market Size Value (US$ Bn) & Volume (Units) Projections, 2022-2032
4.2.1. Y-o-Y Growth Trend Analysis
4.2.2. Absolute $ Opportunity Analysis
5. Global Oil Packing Machine Market Analysis 2015–2021 and Forecast 2022–2032, By Automation
5.1. Introduction / Key Findings
5.2. Historical Market Size Value (US$ Bn) & Volume (Units) Analysis By Automation, 2015-2021
5.3. Current and Future Market Size Value (US$ Bn) & Volume (Units) Analysis and Forecast By Automation, 2022-2032
5.3.1. Automatic
5.3.2. Semi-automatic
5.4. Y-o-Y Growth Trend Analysis By Automation, 2015-2021
5.5. Absolute $ Opportunity Analysis By Automation, 2022-2032
6. Global Oil Packing Machine Market Analysis 2015–2021 and Forecast 2022–2032, By Orientation
6.1. Introduction / Key Findings
6.2. Historical Market Size Value (US$ Bn) & Volume (Units) Analysis By Orientation, 2015-2021
6.3. Current and Future Market Size Value (US$ Bn) & Volume (Units) Analysis and Forecast By Orientation, 2022-2032
6.3.1. VFFS Machine
6.3.2. HFFS Machine
6.4. Y-o-Y Growth Trend Analysis By Orientation, 2015-2021
6.5. Absolute $ Opportunity Analysis By Orientation, 2022-2032
7. Global Oil Packing Machine Market Analysis 2015–2021 and Forecast 2022–2032, By End Use
7.1. Introduction / Key Findings
7.2. Historical Market Size Value (US$ Bn) & Volume (Units) Analysis By End Use, 2015-2021
7.3. Current and Future Market Size Value (US$ Bn) & Volume (Units) Analysis and Forecast By End Use, 2022-2032
7.3.1. Food
7.3.2. Cosmetic & Personal Care
7.3.3. Pharmaceutical
7.3.4. Oil & Lubricant
7.4. Y-o-Y Growth Trend Analysis By End Use, 2015-2021
7.5. Absolute $ Opportunity Analysis By End Use, 2022-2032
8. Global Oil Packing Machine Market Analysis 2015–2021 and Forecast 2022–2032, by Region
8.1. Introduction / Key Findings
8.2. Historical Market Size Value (US$ Bn) & Volume (Units) Analysis By Region, 2015-2021
8.3. Current and Future Market Size Value (US$ Bn) & Volume (Units) Analysis and Forecast By Region, 2022-2032
8.3.1. North America
8.3.2. Latin America
8.3.3. Europe
8.3.4. East Asia
8.3.5. South Asia
8.3.6. Oceania
8.3.7. Middle East and Africa (MEA)
8.4. Market Attractiveness Analysis, by Region
9. North America Oil Packing Machine Market Analysis 2015–2021 and Forecast 2022–2032, By Country
9.1. Historical Market Size Value (US$ Bn) & Volume (Units) Trend Analysis By Market Taxonomy, 2015-2021
9.2. Market Size Value (US$ Bn) & Volume (Units) Forecast By Market Taxonomy, 2022-2032
9.2.1. By Country
9.2.1.1. U.S.
9.2.1.2. Canada
9.2.2. By Automation
9.2.3. By Orientation
9.2.4. By End Use
9.3. Market Attractiveness Analysis
9.3.1. By Country
9.3.2. By Automation
9.3.3. By Orientation
9.3.4. By End Use
9.4. Key Takeaways
10. Latin America Oil Packing Machine Market Analysis 2015–2021 and Forecast 2022–2032, By Country
10.1. Historical Market Size Value (US$ Bn) & Volume (Units) Trend Analysis By Market Taxonomy, 2015-2021
10.2. Market Size Value (US$ Bn) & Volume (Units) Forecast By Market Taxonomy, 2022-2032
10.2.1. By Country
10.2.1.1. Brazil
10.2.1.2. Mexico
10.2.1.3. Argentina
10.2.1.4. Chile
10.2.1.5. Peru
10.2.1.6. Rest of Latin America
10.2.2. By Automation
10.2.3. By Orientation
10.2.4. By End Use
10.3. Market Attractiveness Analysis
10.3.1. By Country
10.3.2. By Automation
10.3.3. By Orientation
10.3.4. By End Use
10.4. Key Takeaways
11. Europe Oil Packing Machine Market Analysis 2015–2021 and Forecast 2022–2032, By Country
11.1. Historical Market Size Value (US$ Bn) & Volume (Units) Trend Analysis By Market Taxonomy, 2015-2021
11.2. Market Size Value (US$ Bn) & Volume (Units) Forecast By Market Taxonomy, 2022-2032
11.2.1. By Country
11.2.1.1. Germany
11.2.1.2. Italy
11.2.1.3. France
11.2.1.4. U.K.
11.2.1.5. Spain
11.2.1.6. BENELUX
11.2.1.7. Nordic
11.2.1.8. Russia
11.2.1.9. Poland
11.2.1.10. Rest of Europe
11.2.2. By Automation
11.2.3. By Orientation
11.2.4. By End Use
11.3. Market Attractiveness Analysis
11.3.1. By Country
11.3.2. By Automation
11.3.3. By Orientation
11.3.4. By End Use
11.4. Key Takeaways
12. East Asia Oil Packing Machine Market Analysis 2015–2021 and Forecast 2022–2032, By Country
12.1. Historical Market Size Value (US$ Bn) & Volume (Units) Trend Analysis By Market Taxonomy, 2015-2021
12.2. Market Size Value (US$ Bn) & Volume (Units) Forecast By Market Taxonomy, 2022-2032
12.2.1. By Country
12.2.1.1. China
12.2.1.2. Japan
12.2.1.3. South Korea
12.2.2. By Automation
12.2.3. By Orientation
12.2.4. By End Use
12.3. Market Attractiveness Analysis
12.3.1. By Country
12.3.2. By Automation
12.3.3. By Orientation
12.3.4. By End Use
12.4. Key Takeaways
13. South Asia Oil Packing Machine Market Analysis 2015–2021 and Forecast 2022–2032, By Country
13.1. Historical Market Size Value (US$ Bn) & Volume (Units) Trend Analysis By Market Taxonomy, 2015-2021
13.2. Market Size Value (US$ Bn) & Volume (Units) Forecast By Market Taxonomy, 2022-2032
13.2.1. By Country
13.2.1.1. India
13.2.1.2. Thailand
13.2.1.3. Malaysia
13.2.1.4. Indonesia
13.2.1.5. Rest of South Asia
13.2.2. By Automation
13.2.3. By Orientation
13.2.4. By End Use
13.3. Market Attractiveness Analysis
13.3.1. By Country
13.3.2. By Automation
13.3.3. By Orientation
13.3.4. By End Use
13.4. Key Takeaways
14. Oceania Oil Packing Machine Market Analysis 2015–2021 and Forecast 2022–2032, By Country
14.1. Historical Market Size Value (US$ Bn) & Volume (Units) Trend Analysis By Market Taxonomy, 2015-2021
14.2. Market Size Value (US$ Bn) & Volume (Units) Forecast By Market Taxonomy, 2022-2032
14.2.1. By Country
14.2.1.1. Australia
14.2.1.2. New Zealand
14.2.2. By Automation
14.2.3. By Orientation
14.2.4. By End Use
14.3. Market Attractiveness Analysis
14.3.1. By Country
14.3.2. By Automation
14.3.3. By Orientation
14.3.4. By End Use
14.4. Key Takeaways
15. Middle East & Africa Oil Packing Machine Market Analysis 2015–2021 and Forecast 2022–2032, By Country
15.1. Historical Market Size Value (US$ Bn) & Volume (Units) Trend Analysis By Market Taxonomy, 2015-2021
15.2. Market Size Value (US$ Bn) & Volume (Units) Forecast By Market Taxonomy, 2022-2032
15.2.1. By Country
15.2.1.1. GCC Countries
15.2.1.2. Turkey
15.2.1.3. Northern Africa
15.2.1.4. South Africa
15.2.1.5. Rest of MEA
15.2.2. By Automation
15.2.3. By Orientation
15.2.4. By End Use
15.3. Market Attractiveness Analysis
15.3.1. By Country
15.3.2. By Automation
15.3.3. By Orientation
15.3.4. By End Use
15.4. Key Takeaways
16. Country wise Oil Packing Machine Market Analysis
16.1. United States (U.S.)
16.1.1. Market Share Analysis, 2022
16.1.2. By Automation
16.1.3. By Orientation
16.1.4. By End Use
16.2. Canada
16.2.1. Market Share Analysis, 2022
16.2.2. By Automation
16.2.3. By Orientation
16.2.4. By End Use
16.3. Brazil
16.3.1. Market Share Analysis, 2022
16.3.2. By Automation
16.3.3. By Orientation
16.3.4. By End Use
16.4. Mexico
16.4.1. Market Share Analysis, 2022
16.4.2. By Automation
16.4.3. By Orientation
16.4.4. By End Use
16.5. Germany
16.5.1. Market Share Analysis, 2022
16.5.2. By Automation
16.5.3. By Orientation
16.5.4. By End Use
16.6. Italy
16.6.1. Market Share Analysis, 2022
16.6.2. By Automation
16.6.3. By Orientation
16.6.4. By End Use
16.7. France
16.7.1. Market Share Analysis, 2022
16.7.2. By Automation
16.7.3. By Orientation
16.7.4. By End Use
16.8. Spain
16.8.1. Market Share Analysis, 2022
16.8.2. By Automation
16.8.3. By Orientation
16.8.4. By End Use
16.9. U.K.
16.9.1. Market Share Analysis, 2022
16.9.2. By Automation
16.9.3. By Orientation
16.9.4. By End Use
16.10. Russia
16.10.1. Market Share Analysis, 2022
16.10.2. By Automation
16.10.3. By Orientation
16.10.4. By End Use
16.11. China
16.11.1. Market Share Analysis, 2022
16.11.2. By Automation
16.11.3. By Orientation
16.11.4. By End Use
16.12. Japan
16.12.1. Market Share Analysis, 2022
16.12.2. By Automation
16.12.3. By Orientation
16.12.4. By End Use
16.13. India
16.13.1. Market Share Analysis, 2022
16.13.2. By Automation
16.13.3. By Orientation
16.13.4. By End Use
16.14. GCC Countries
16.14.1. Market Share Analysis, 2022
16.14.2. By Automation
16.14.3. By Orientation
16.14.4. By End Use
16.15. Australia
16.15.1. Market Share Analysis, 2022
16.15.2. By Automation
16.15.3. By Orientation
16.15.4. By End Use
17. Market Structure Analysis
17.1. Competition Dashboard
17.2. Competition Benchmarking
17.3. Market Share Analysis of Top Players
17.3.1. By Region
17.3.2. By Product Portfolio
18. Competition Analysis
18.1. Competition Deep Dive
18.1.1. Niverplast B.V.
18.1.1.1. Overview
18.1.1.2. Product Portfolio
18.1.1.3. Profitability by Market Segments (Product/Channel/Region)
18.1.1.4. Sales Footprint
18.1.1.5. Strategy Overview
18.1.1.5.1. Marketing Strategy
18.1.1.5.2. Product Strategy
18.1.1.5.3. Channel Strategy
18.1.2. Turpack Makine Sanayi ve Ticaret Ltd. Sti.
18.1.2.1. Overview
18.1.2.2. Product Portfolio
18.1.2.3. Profitability by Market Segments (Product/Channel/Region)
18.1.2.4. Sales Footprint
18.1.2.5. Strategy Overview
18.1.2.5.1. Marketing Strategy
18.1.2.5.2. Product Strategy
18.1.2.5.3. Channel Strategy
18.1.3. GEA Group
18.1.3.1. Overview
18.1.3.2. Product Portfolio
18.1.3.3. Profitability by Market Segments (Product/Channel/Region)
18.1.3.4. Sales Footprint
18.1.3.5. Strategy Overview
18.1.3.5.1. Marketing Strategy
18.1.3.5.2. Product Strategy
18.1.3.5.3. Channel Strategy
18.1.4. SN Maschinenbau GmbH
18.1.4.1. Overview
18.1.4.2. Product Portfolio
18.1.4.3. Profitability by Market Segments (Product/Channel/Region)
18.1.4.4. Sales Footprint
18.1.4.5. Strategy Overview
18.1.4.5.1. Marketing Strategy
18.1.4.5.2. Product Strategy
18.1.4.5.3. Channel Strategy
18.1.5. Gemseal Abhilash Industries
18.1.5.1. Overview
18.1.5.2. Product Portfolio
18.1.5.3. Profitability by Market Segments (Product/Channel/Region)
18.1.5.4. Sales Footprint
18.1.5.5. Strategy Overview
18.1.5.5.1. Marketing Strategy
18.1.5.5.2. Product Strategy
18.1.5.5.3. Channel Strategy
18.1.6. Siklmx Co. Ltd.
18.1.6.1. Overview
18.1.6.2. Product Portfolio
18.1.6.3. Profitability by Market Segments (Product/Channel/Region)
18.1.6.4. Sales Footprint
18.1.6.5. Strategy Overview
18.1.6.5.1. Marketing Strategy
18.1.6.5.2. Product Strategy
18.1.6.5.3. Channel Strategy
18.1.7. Nichrome Packaging Solutions
18.1.7.1. Overview
18.1.7.2. Product Portfolio
18.1.7.3. Profitability by Market Segments (Product/Channel/Region)
18.1.7.4. Sales Footprint
18.1.7.5. Strategy Overview
18.1.7.5.1. Marketing Strategy
18.1.7.5.2. Product Strategy
18.1.7.5.3. Channel Strategy
18.1.8. Foshan Land Packaging Machinery Co. Ltd.
18.1.8.1. Overview
18.1.8.2. Product Portfolio
18.1.8.3. Profitability by Market Segments (Product/Channel/Region)
18.1.8.4. Sales Footprint
18.1.8.5. Strategy Overview
18.1.8.5.1. Marketing Strategy
18.1.8.5.2. Product Strategy
18.1.8.5.3. Channel Strategy
18.1.9. Turpack Packaging Machinery
18.1.9.1. Overview
18.1.9.2. Product Portfolio
18.1.9.3. Profitability by Market Segments (Product/Channel/Region)
18.1.9.4. Sales Footprint
18.1.9.5. Strategy Overview
18.1.9.5.1. Marketing Strategy
18.1.9.5.2. Product Strategy
18.1.9.5.3. Channel Strategy
18.1.10. LPE (Levapack)
18.1.10.1. Overview
18.1.10.2. Product Portfolio
18.1.10.3. Profitability by Market Segments (Product/Channel/Region)
18.1.10.4. Sales Footprint
18.1.10.5. Strategy Overview
18.1.10.5.1. Marketing Strategy
18.1.10.5.2. Product Strategy
18.1.10.5.3. Channel Strategy
18.1.11. APACKS
18.1.11.1. Overview
18.1.11.2. Product Portfolio
18.1.11.3. Profitability by Market Segments (Product/Channel/Region)
18.1.11.4. Sales Footprint
18.1.11.5. Strategy Overview
18.1.11.5.1. Marketing Strategy
18.1.11.5.2. Product Strategy
18.1.11.5.3. Channel Strategy
18.1.12. Unitech Engineering Company
18.1.12.1. Overview
18.1.12.2. Product Portfolio
18.1.12.3. Profitability by Market Segments (Product/Channel/Region)
18.1.12.4. Sales Footprint
18.1.12.5. Strategy Overview
18.1.12.5.1. Marketing Strategy
18.1.12.5.2. Product Strategy
18.1.12.5.3. Channel Strategy
18.1.13. Bestar Packaging Machine Co., Ltd.
18.1.13.1. Overview
18.1.13.2. Product Portfolio
18.1.13.3. Profitability by Market Segments (Product/Channel/Region)
18.1.13.4. Sales Footprint
18.1.13.5. Strategy Overview
18.1.13.5.1. Marketing Strategy
18.1.13.5.2. Product Strategy
18.1.13.5.3. Channel Strategy
18.1.14. Ruian RunLi Machinery Co., Ltd.
18.1.14.1. Overview
18.1.14.2. Product Portfolio
18.1.14.3. Profitability by Market Segments (Product/Channel/Region)
18.1.14.4. Sales Footprint
18.1.14.5. Strategy Overview
18.1.14.5.1. Marketing Strategy
18.1.14.5.2. Product Strategy
18.1.14.5.3. Channel Strategy
18.1.15. Wenzhou Wimach Machinery Co., Ltd.
18.1.15.1. Overview
18.1.15.2. Product Portfolio
18.1.15.3. Profitability by Market Segments (Product/Channel/Region)
18.1.15.4. Sales Footprint
18.1.15.5. Strategy Overview
18.1.15.5.1. Marketing Strategy
18.1.15.5.2. Product Strategy
18.1.15.5.3. Channel Strategy
19. Assumptions and Acronyms Used
20. Research Methodology
Let us know your requirement to get
100% FREE customization
List of Tables
Table 01: Global Oil Packing Machine Market Value (US$ Bn) Forecast by Region, 2015-2032
Table 02: Global Oil Packing Machine Market Volume (Units) Forecast by Region, 2015-2032
Table 03: Global Oil Packing Machine Market Value (US$ Bn) Forecast by Automation, 2015-2032
Table 04: Global Oil Packing Machine Market Volume (Units) Forecast by Automation, 2015-2032
Table 05: Global Oil Packing Machine Market Value (US$ Bn) Forecast by Orientation, 2015-2032
Table 06: Global Oil Packing Machine Market Volume (Units) Forecast by Orientation, 2015-2032
Table 07: Global Oil Packing Machine Market Value (US$ Bn) Forecast by End Use, 2015-2032
Table 08: Global Oil Packing Machine Market Volume (Units) Forecast by End Use, 2015-2032
Table 09: North America Oil Packing Machine Market Value (US$ Bn) Forecast by Country, 2015-2032
Table 10: North America Oil Packing Machine Market Volume (Units) Forecast by Country, 2015-2032
Table 11: North America Oil Packing Machine Market Value (US$ Bn) Forecast by Automation, 2015-2032
Table 12: North America Oil Packing Machine Market Volume (Units) Forecast by Automation, 2015-2032
Table 13: North America Oil Packing Machine Market Value (US$ Bn) Forecast by Orientation, 2015-2032
Table 14: North America Oil Packing Machine Market Volume (Units) Forecast by Orientation, 2015-2032
Table 15: North America Oil Packing Machine Market Value (US$ Bn) Forecast by End Use, 2015-2032
Table 16: North America Oil Packing Machine Market Volume (Units) Forecast by End Use, 2015-2032
Table 17: Latin America Oil Packing Machine Market Value (US$ Bn) Forecast by Country, 2015-2032
Table 18: Latin America Oil Packing Machine Market Volume (Units) Forecast by Country, 2015-2032
Table 19: Latin America Oil Packing Machine Market Value (US$ Bn) Forecast by Automation, 2015-2032
Table 20: Latin America Oil Packing Machine Market Volume (Units) Forecast by Automation, 2015-2032
Table 21: Latin America Oil Packing Machine Market Value (US$ Bn) Forecast by Orientation, 2015-2032
Table 22: Latin America Oil Packing Machine Market Volume (Units) Forecast by Orientation, 2015-2032
Table 23: Latin America Oil Packing Machine Market Value (US$ Bn) Forecast by End Use, 2015-2032
Table 24: Latin America Oil Packing Machine Market Volume (Units) Forecast by End Use, 2015-2032
Table 25: Europe Oil Packing Machine Market Value (US$ Bn) Forecast by Country, 2015-2032
Table 26: Europe Oil Packing Machine Market Volume (Units) Forecast by Country, 2015-2032
Table 27: Europe Oil Packing Machine Market Value (US$ Bn) Forecast by Automation, 2015-2032
Table 28: Europe Oil Packing Machine Market Volume (Units) Forecast by Automation, 2015-2032
Table 29: Europe Oil Packing Machine Market Value (US$ Bn) Forecast by Orientation, 2015-2032
Table 30: Europe Oil Packing Machine Market Volume (Units) Forecast by Orientation, 2015-2032
Table 31: Europe Oil Packing Machine Market Value (US$ Bn) Forecast by End Use, 2015-2032
Table 32: Europe Oil Packing Machine Market Volume (Units) Forecast by End Use, 2015-2032
Table 33: East Asia Oil Packing Machine Market Value (US$ Bn) Forecast by Country, 2015-2032
Table 34: East Asia Oil Packing Machine Market Volume (Units) Forecast by Country, 2015-2032
Table 35: East Asia Oil Packing Machine Market Value (US$ Bn) Forecast by Automation, 2015-2032
Table 36: East Asia Oil Packing Machine Market Volume (Units) Forecast by Automation, 2015-2032
Table 37: East Asia Oil Packing Machine Market Value (US$ Bn) Forecast by Orientation, 2015-2032
Table 38: East Asia Oil Packing Machine Market Volume (Units) Forecast by Orientation, 2015-2032
Table 39: East Asia Oil Packing Machine Market Value (US$ Bn) Forecast by End Use, 2015-2032
Table 40: East Asia Oil Packing Machine Market Volume (Units) Forecast by End Use, 2015-2032
Table 41: South Asia Oil Packing Machine Market Value (US$ Bn) Forecast by Country, 2015-2032
Table 42: South Asia Oil Packing Machine Market Volume (Units) Forecast by Country, 2015-2032
Table 43: South Asia Oil Packing Machine Market Value (US$ Bn) Forecast by Automation, 2015-2032
Table 44: South Asia Oil Packing Machine Market Volume (Units) Forecast by Automation, 2015-2032
Table 45: South Asia Oil Packing Machine Market Value (US$ Bn) Forecast by Orientation, 2015-2032
Table 46: South Asia Oil Packing Machine Market Volume (Units) Forecast by Orientation, 2015-2032
Table 47: South Asia Oil Packing Machine Market Value (US$ Bn) Forecast by End Use, 2015-2032
Table 48: South Asia Oil Packing Machine Market Volume (Units) Forecast by End Use, 2015-2032
Table 49: Oceania Oil Packing Machine Market Value (US$ Bn) Forecast by Country, 2015-2032
Table 50: Oceania Oil Packing Machine Market Volume (Units) Forecast by Country, 2015-2032
Table 51: Oceania Oil Packing Machine Market Value (US$ Bn) Forecast by Automation, 2015-2032
Table 52: Oceania Oil Packing Machine Market Volume (Units) Forecast by Automation, 2015-2032
Table 53: Oceania Oil Packing Machine Market Value (US$ Bn) Forecast by Orientation, 2015-2032
Table 54: Oceania Oil Packing Machine Market Volume (Units) Forecast by Orientation, 2015-2032
Table 55: Oceania Oil Packing Machine Market Value (US$ Bn) Forecast by End Use, 2015-2032
Table 56: Oceania Oil Packing Machine Market Volume (Units) Forecast by End Use, 2015-2032
Table 57: MEA Oil Packing Machine Market Value (US$ Bn) Forecast by Country, 2015-2032
Table 58: MEA Oil Packing Machine Market Volume (Units) Forecast by Country, 2015-2032
Table 59: MEA Oil Packing Machine Market Value (US$ Bn) Forecast by Automation, 2015-2032
Table 60: MEA Oil Packing Machine Market Volume (Units) Forecast by Automation, 2015-2032
Table 61: MEA Oil Packing Machine Market Value (US$ Bn) Forecast by Orientation, 2015-2032
Table 62: MEA Oil Packing Machine Market Volume (Units) Forecast by Orientation, 2015-2032
Table 63: MEA Oil Packing Machine Market Value (US$ Bn) Forecast by End Use, 2015-2032
Table 64: MEA Oil Packing Machine Market Volume (Units) Forecast by End Use, 2015-2032
Table 65: U.S. Oil Packing Machine Market Value (US$ Bn) Forecast by Automation, Orientation, and End Use (2022(E) & 2032(F))
Table 66: Canada Oil Packing Machine Market Value (US$ Bn) Forecast by Automation, Orientation, and End Use (2022(E) & 2032(F))
Table 67: Brazil Oil Packing Machine Market Value (US$ Bn) Forecast by Automation, Orientation, and End Use (2022(E) & 2032(F))
Table 68: Mexico Oil Packing Machine Market Value (US$ Bn) Forecast by Automation, Orientation, and End Use (2022(E) & 2032(F))
Table 69: Germany Oil Packing Machine Market Value (US$ Bn) Forecast by Automation, Orientation, and End Use (2022(E) & 2032(F))
Table 70: Italy Oil Packing Machine Market Value (US$ Bn) Forecast by Automation, Orientation, and End Use (2022(E) & 2032(F))
Table 71: France Oil Packing Machine Market Value (US$ Bn) Forecast by Automation, Orientation, and End Use (2022(E) & 2032(F))
Table 72: Spain Oil Packing Machine Market Value (US$ Bn) Forecast by Automation, Orientation, and End Use (2022(E) & 2032(F))
Table 73: U.K. Oil Packing Machine Market Value (US$ Bn) Forecast by Automation, Orientation, and End Use (2022(E) & 2032(F))
Table 74: Russia Oil Packing Machine Market Value (US$ Bn) Forecast by Automation, Orientation, and End Use (2022(E) & 2032(F))
Table 75: China Oil Packing Machine Market Value (US$ Bn) Forecast by Automation, Orientation, and End Use (2022(E) & 2032(F))
Table 76: Japan Oil Packing Machine Market Value (US$ Bn) Forecast by Automation, Orientation, and End Use (2022(E) & 2032(F))
Table 77: India Oil Packing Machine Market Value (US$ Bn) Forecast by Automation, Orientation, and End Use (2022(E) & 2032(F))
Table 78: GCC Countries Oil Packing Machine Market Value (US$ Bn) Forecast by Automation, Orientation, and End Use (2022(E) & 2032(F))
Table 79: Australia Oil Packing Machine Market Value (US$ Bn) Forecast by Automation, Orientation, and End Use (2022(E) & 2032(F))
Find your sweet spots for generating winning opportunities in this market.
Talk to AnalystList of Charts
Figure 01: Global Oil Packing Machine Market Value (US$ Bn) by Automation, 2022-2032
Figure 02: Global Oil Packing Machine Market Value (US$ Bn) by Orientation, 2022-2032
Figure 03: Global Oil Packing Machine Market Value (US$ Bn) by End Use, 2022-2032
Figure 04: Global Oil Packing Machine Market Value (US$ Bn) by Region, 2022-2032
Figure 05: Global Oil Packing Machine Market Value (US$ Bn) Analysis by Region, 2015-2021
Figure 06: Global Oil Packing Machine Market Volume (Units) Analysis by Region, 2015-2032
Figure 07: Global Oil Packing Machine Market Value Share (%) and BPS Analysis by Region, 2022 & 2032
Figure 08: Global Oil Packing Machine Market Y-o-Y Growth (%) Projections by Region, 2022-2032
Figure 09: Global Oil Packing Machine Market Value (US$ Bn) Analysis by Automation, 2015-2021
Figure 10: Global Oil Packing Machine Market Volume (Units) Analysis by Automation, 2015-2032
Figure 11: Global Oil Packing Machine Market Value Share (%) and BPS Analysis by Automation, 2022 & 2032
Figure 12: Global Oil Packing Machine Market Y-o-Y Growth (%) Projections by Automation, 2022-2032
Figure 13: Global Oil Packing Machine Market Value (US$ Bn) Analysis by Orientation, 2015-2021
Figure 14: Global Oil Packing Machine Market Volume (Units) Analysis by Orientation, 2015-2032
Figure 15: Global Oil Packing Machine Market Value Share (%) and BPS Analysis by Orientation, 2022 & 2032
Figure 16: Global Oil Packing Machine Market Y-o-Y Growth (%) Projections by Orientation, 2022-2032
Figure 17: Global Oil Packing Machine Market Value (US$ Bn) Analysis by End Use, 2015-2021
Figure 18: Global Oil Packing Machine Market Volume (Units) Analysis by End Use, 2015-2032
Figure 19: Global Oil Packing Machine Market Value Share (%) and BPS Analysis by End Use, 2022 & 2032
Figure 20: Global Oil Packing Machine Market Y-o-Y Growth (%) Projections by End Use, 2022-2032
Figure 21: Global Oil Packing Machine Market Attractiveness by Automation, 2022-2032
Figure 22: Global Oil Packing Machine Market Attractiveness by Orientation, 2022-2032
Figure 23: Global Oil Packing Machine Market Attractiveness by Application, 2022-2032
Figure 24: Global Oil Packing Machine Market Attractiveness by End Use, 2022-2032
Figure 25: Global Oil Packing Machine Market Attractiveness by Region, 2022-2032
Figure 26: North America Oil Packing Machine Market Value (US$ Bn) by Automation, 2022-2032
Figure 27: North America Oil Packing Machine Market Value (US$ Bn) by Orientation, 2022-2032
Figure 28: North America Oil Packing Machine Market Value (US$ Bn) by End Use, 2022-2032
Figure 29: North America Oil Packing Machine Market Value (US$ Bn) by Country, 2022-2032
Figure 30: North America Oil Packing Machine Market Value (US$ Bn) Analysis by Country, 2015-2021
Figure 31: North America Oil Packing Machine Market Volume (Units) Analysis by Country, 2015-2032
Figure 32: North America Oil Packing Machine Market Value Share (%) and BPS Analysis by Country, 2022 & 2032
Figure 33: North America Oil Packing Machine Market Y-o-Y Growth (%) Projections by Country, 2022-2032
Figure 34: North America Oil Packing Machine Market Value (US$ Bn) Analysis by Automation, 2015-2021
Figure 35: North America Oil Packing Machine Market Volume (Units) Analysis by Automation, 2015-2032
Figure 36: North America Oil Packing Machine Market Value Share (%) and BPS Analysis by Automation, 2022 & 2032
Figure 37: North America Oil Packing Machine Market Y-o-Y Growth (%) Projections by Automation, 2022-2032
Figure 38: North America Oil Packing Machine Market Value (US$ Bn) Analysis by Orientation, 2015-2021
Figure 39: North America Oil Packing Machine Market Volume (Units) Analysis by Orientation, 2015-2032
Figure 40: North America Oil Packing Machine Market Value Share (%) and BPS Analysis by Orientation, 2022 & 2032
Figure 41: North America Oil Packing Machine Market Y-o-Y Growth (%) Projections by Orientation, 2022-2032
Figure 42: North America Oil Packing Machine Market Value (US$ Bn) Analysis by End Use, 2015-2021
Figure 43: North America Oil Packing Machine Market Volume (Units) Analysis by End Use, 2015-2032
Figure 44: North America Oil Packing Machine Market Value Share (%) and BPS Analysis by End Use, 2022 & 2032
Figure 45: North America Oil Packing Machine Market Y-o-Y Growth (%) Projections by End Use, 2022-2032
Figure 46: North America Oil Packing Machine Market Attractiveness by Automation, 2022-2032
Figure 47: North America Oil Packing Machine Market Attractiveness by Orientation, 2022-2032
Figure 48: North America Oil Packing Machine Market Attractiveness by End Use, 2022-2032
Figure 49: North America Oil Packing Machine Market Attractiveness by Country, 2022-2032
Figure 50: Latin America Oil Packing Machine Market Value (US$ Bn) by Automation, 2022 & 2032
Figure 51: Latin America Oil Packing Machine Market Value (US$ Bn) by Orientation, 2022-2032
Figure 52: Latin America Oil Packing Machine Market Value (US$ Bn) by End Use, 2022-2032
Figure 53: Latin America Oil Packing Machine Market Value (US$ Bn) by Country, 2022-2032
Figure 54: Latin America Oil Packing Machine Market Value (US$ Bn) Analysis by Country, 2015-2021
Figure 55: Latin America Oil Packing Machine Market Volume (Units) Analysis by Country, 2015-2032
Figure 56: Latin America Oil Packing Machine Market Value Share (%) and BPS Analysis by Country, 2022 & 2032
Figure 57: Latin America Oil Packing Machine Market Y-o-Y Growth (%) Projections by Country, 2022-2032
Figure 58: Latin America Oil Packing Machine Market Value (US$ Bn) Analysis by Automation, 2015-2021
Figure 59: Latin America Oil Packing Machine Market Volume (Units) Analysis by Automation, 2015-2032
Figure 60: Latin America Oil Packing Machine Market Value Share (%) and BPS Analysis by Automation, 2022 & 2032
Figure 61: Latin America Oil Packing Machine Market Y-o-Y Growth (%) Projections by Automation, 2022-2032
Figure 62: Latin America Oil Packing Machine Market Value (US$ Bn) Analysis by Orientation, 2015-2021
Figure 63: Latin America Oil Packing Machine Market Volume (Units) Analysis by Orientation, 2015-2032
Figure 64: Latin America Oil Packing Machine Market Value Share (%) and BPS Analysis by Orientation, 2022 & 2032
Figure 65: Latin America Oil Packing Machine Market Y-o-Y Growth (%) Projections by Orientation, 2022-2032
Figure 66: Latin America Oil Packing Machine Market Value (US$ Bn) Analysis by End Use, 2015-2021
Figure 67: Latin America Oil Packing Machine Market Volume (Units) Analysis by End Use, 2015-2032
Figure 68: Latin America Oil Packing Machine Market Value Share (%) and BPS Analysis by End Use, 2022 & 2032
Figure 69: Latin America Oil Packing Machine Market Y-o-Y Growth (%) Projections by End Use, 2022-2032
Figure 70: Latin America Oil Packing Machine Market Attractiveness by Automation, 2022-2032
Figure 71: Latin America Oil Packing Machine Market Attractiveness by Orientation, 2022-2032
Figure 72: Latin America Oil Packing Machine Market Attractiveness by End Use, 2022-2032
Figure 73: Latin America Oil Packing Machine Market Attractiveness by Country, 2022-2032
Figure 74: Europe Oil Packing Machine Market Value (US$ Bn) by Automation, 2022-2032
Figure 75: Europe Oil Packing Machine Market Value (US$ Bn) by Orientation, 2022-2032
Figure 76: Europe Oil Packing Machine Market Value (US$ Bn) by End Use, 2022-2032
Figure 77: Europe Oil Packing Machine Market Value (US$ Bn) by Country, 2022-2032
Figure 78: Europe Oil Packing Machine Market Value (US$ Bn) Analysis by Country, 2015-2021
Figure 79: Europe Oil Packing Machine Market Volume (Units) Analysis by Country, 2015-2032
Figure 80: Europe Oil Packing Machine Market Value Share (%) and BPS Analysis by Country, 2022 & 2032
Figure 81: Europe Oil Packing Machine Market Y-o-Y Growth (%) Projections by Country, 2022-2032
Figure 82: Europe Oil Packing Machine Market Value (US$ Bn) Analysis by Automation, 2015-2021
Figure 83: Europe Oil Packing Machine Market Volume (Units) Analysis by Automation, 2015-2032
Figure 84: Europe Oil Packing Machine Market Value Share (%) and BPS Analysis by Automation, 2022 & 2032
Figure 85: Europe Oil Packing Machine Market Y-o-Y Growth (%) Projections by Automation, 2022-2032
Figure 86: Europe Oil Packing Machine Market Value (US$ Bn) Analysis by Orientation, 2015-2021
Figure 87: Europe Oil Packing Machine Market Volume (Units) Analysis by Orientation, 2015-2032
Figure 88: Europe Oil Packing Machine Market Value Share (%) and BPS Analysis by Orientation, 2022 & 2032
Figure 89: Europe Oil Packing Machine Market Y-o-Y Growth (%) Projections by Orientation, 2022-2032
Figure 90: Europe Oil Packing Machine Market Value (US$ Bn) Analysis by End Use, 2015-2021
Figure 91: Europe Oil Packing Machine Market Volume (Units) Analysis by End Use, 2015-2032
Figure 92: Europe Oil Packing Machine Market Value Share (%) and BPS Analysis by End Use, 2022 & 2032
Figure 93: Europe Oil Packing Machine Market Y-o-Y Growth (%) Projections by End Use, 2022-2032
Figure 94: Europe Oil Packing Machine Market Attractiveness by Automation, 2022-2032
Figure 95: Europe Oil Packing Machine Market Attractiveness by Orientation, 2022-2032
Figure 96: Europe Oil Packing Machine Market Attractiveness by End Use, 2022-2032
Figure 97: Europe Oil Packing Machine Market Attractiveness by Country, 2022-2032
Figure 98: East Asia Oil Packing Machine Market Value (US$ Bn) by Automation, 2022-2032
Figure 99: East Asia Oil Packing Machine Market Value (US$ Bn) by Orientation, 2022-2032
Figure 100: East Asia Oil Packing Machine Market Value (US$ Bn) by End Use, 2022-2032
Figure 101: East Asia Oil Packing Machine Market Value (US$ Bn) by Country, 2022-2032
Figure 102: East Asia Oil Packing Machine Market Value (US$ Bn) Analysis by Country, 2015-2021
Figure 103: East Asia Oil Packing Machine Market Volume (Units) Analysis by Country, 2015-2032
Figure 104: East Asia Oil Packing Machine Market Value Share (%) and BPS Analysis by Country, 2022 & 2032
Figure 105: East Asia Oil Packing Machine Market Y-o-Y Growth (%) Projections by Country, 2022-2032
Figure 106: East Asia Oil Packing Machine Market Value (US$ Bn) Analysis by Automation, 2015-2021
Figure 107: East Asia Oil Packing Machine Market Volume (Units) Analysis by Automation, 2015-2032
Figure 108: East Asia Oil Packing Machine Market Value Share (%) and BPS Analysis by Automation, 2022 & 2032
Figure 109: East Asia Oil Packing Machine Market Y-o-Y Growth (%) Projections by Automation, 2022-2032
Figure 110: East Asia Oil Packing Machine Market Value (US$ Bn) Analysis by Orientation, 2015-2021
Figure 111: East Asia Oil Packing Machine Market Volume (Units) Analysis by Orientation, 2015-2032
Figure 112: East Asia Oil Packing Machine Market Value Share (%) and BPS Analysis by Orientation, 2022 & 2032
Figure 113: East Asia Oil Packing Machine Market Y-o-Y Growth (%) Projections by Orientation, 2022-2032
Figure 114: East Asia Oil Packing Machine Market Value (US$ Bn) Analysis by End Use, 2015-2021
Figure 115: East Asia Oil Packing Machine Market Volume (Units) Analysis by End Use, 2015-2032
Figure 116: East Asia Oil Packing Machine Market Value Share (%) and BPS Analysis by End Use, 2022 & 2032
Figure 117: East Asia Oil Packing Machine Market Y-o-Y Growth (%) Projections by End Use, 2022-2032
Figure 118: East Asia Oil Packing Machine Market Attractiveness by Automation, 2022-2032
Figure 119: East Asia Oil Packing Machine Market Attractiveness by Orientation, 2022-2032
Figure 120: East Asia Oil Packing Machine Market Attractiveness by End Use, 2022-2032
Figure 121: East Asia Oil Packing Machine Market Attractiveness by Country, 2022-2032
Figure 122: South Asia Oil Packing Machine Market Value (US$ Bn) by Automation, 2022-2032
Figure 123: South Asia Oil Packing Machine Market Value (US$ Bn) by Orientation, 2022-2032
Figure 124: South Asia Oil Packing Machine Market Value (US$ Bn) by End Use, 2022-2032
Figure 125: South Asia Oil Packing Machine Market Value (US$ Bn) by Country, 2022-2032
Figure 126: South Asia Oil Packing Machine Market Value (US$ Bn) Analysis by Country, 2015-2021
Figure 127: South Asia Oil Packing Machine Market Volume (Units) Analysis by Country, 2015-2032
Figure 128: South Asia Oil Packing Machine Market Value Share (%) and BPS Analysis by Country, 2022 & 2032
Figure 129: South Asia Oil Packing Machine Market Y-o-Y Growth (%) Projections by Country, 2022-2032
Figure 130: South Asia Oil Packing Machine Market Value (US$ Bn) Analysis by Automation, 2015-2021
Figure 131: South Asia Oil Packing Machine Market Volume (Units) Analysis by Automation, 2015-2032
Figure 132: South Asia Oil Packing Machine Market Value Share (%) and BPS Analysis by Automation, 2022 & 2032
Figure 133: South Asia Oil Packing Machine Market Y-o-Y Growth (%) Projections by Automation, 2022-2032
Figure 134: South Asia Oil Packing Machine Market Value (US$ Bn) Analysis by Orientation, 2015-2021
Figure 135: South Asia Oil Packing Machine Market Volume (Units) Analysis by Orientation, 2015-2032
Figure 136: South Asia Oil Packing Machine Market Value Share (%) and BPS Analysis by Orientation, 2022 & 2032
Figure 137: South Asia Oil Packing Machine Market Y-o-Y Growth (%) Projections by Orientation, 2022-2032
Figure 138: South Asia Oil Packing Machine Market Value (US$ Bn) Analysis by End Use, 2015-2021
Figure 139: South Asia Oil Packing Machine Market Volume (Units) Analysis by End Use, 2015-2032
Figure 140: South Asia Oil Packing Machine Market Value Share (%) and BPS Analysis by End Use, 2022 & 2032
Figure 141: South Asia Oil Packing Machine Market Y-o-Y Growth (%) Projections by End Use, 2022-2032
Figure 142: South Asia Oil Packing Machine Market Attractiveness by Automation, 2022-2032
Figure 143: South Asia Oil Packing Machine Market Attractiveness by Orientation, 2022-2032
Figure 144: South Asia Oil Packing Machine Market Attractiveness by End Use, 2022-2032
Figure 145: South Asia Oil Packing Machine Market Attractiveness by Country, 2022-2032
Figure 146: Oceania Oil Packing Machine Market Value (US$ Bn) by Automation, 2022-2032
Figure 147: Oceania Oil Packing Machine Market Value (US$ Bn) by Orientation, 2022-2032
Figure 148: Oceania Oil Packing Machine Market Value (US$ Bn) by End Use, 2022-2032
Figure 149: Oceania Oil Packing Machine Market Value (US$ Bn) by Country, 2022-2032
Figure 150: Oceania Oil Packing Machine Market Value (US$ Bn) Analysis by Country, 2015-2021
Figure 151: Oceania Oil Packing Machine Market Volume (Units) Analysis by Country, 2015-2032
Figure 152: Oceania Oil Packing Machine Market Value Share (%) and BPS Analysis by Country, 2022 & 2032
Figure 153: Oceania Oil Packing Machine Market Y-o-Y Growth (%) Projections by Country, 2022-2032
Figure 154: Oceania Oil Packing Machine Market Value (US$ Bn) Analysis by Automation, 2015-2021
Figure 155: Oceania Oil Packing Machine Market Volume (Units) Analysis by Automation, 2015-2032
Figure 156: Oceania Oil Packing Machine Market Value Share (%) and BPS Analysis by Automation, 2022 & 2032
Figure 157: Oceania Oil Packing Machine Market Y-o-Y Growth (%) Projections by Automation, 2022-2032
Figure 158: Oceania Oil Packing Machine Market Value (US$ Bn) Analysis by Orientation, 2015-2021
Figure 159: Oceania Oil Packing Machine Market Volume (Units) Analysis by Orientation, 2015-2032
Figure 160: Oceania Oil Packing Machine Market Value Share (%) and BPS Analysis by Orientation, 2022 & 2032
Figure 161: Oceania Oil Packing Machine Market Y-o-Y Growth (%) Projections by Orientation, 2022-2032
Figure 162: Oceania Oil Packing Machine Market Value (US$ Bn) Analysis by End Use, 2015-2021
Figure 163: Oceania Oil Packing Machine Market Volume (Units) Analysis by End Use, 2015-2032
Figure 164: Oceania Oil Packing Machine Market Value Share (%) and BPS Analysis by End Use, 2022 & 2032
Figure 165: Oceania Oil Packing Machine Market Y-o-Y Growth (%) Projections by End Use, 2022-2032
Figure 166: Oceania Oil Packing Machine Market Attractiveness by Automation, 2022-2032
Figure 167: Oceania Oil Packing Machine Market Attractiveness by Orientation, 2022-2032
Figure 168: Oceania Oil Packing Machine Market Attractiveness by End Use, 2022-2032
Figure 169 Oceania Oil Packing Machine Market Attractiveness by Country, 2022-2032
Figure 170: MEA Oil Packing Machine Market Value (US$ Bn) by Automation, 2022-2032
Figure 171: MEA Oil Packing Machine Market Value (US$ Bn) by Orientation, 2022-2032
Figure 172: MEA Oil Packing Machine Market Value (US$ Bn) by End Use, 2022-2032
Figure 173: MEA Oil Packing Machine Market Value (US$ Bn) by Country, 2022-2032
Figure 174: MEA Oil Packing Machine Market Value (US$ Bn) Analysis by Country, 2015-2021
Figure 175: MEA Oil Packing Machine Market Volume (Units) Analysis by Country, 2015-2032
Figure 176: MEA Oil Packing Machine Market Value Share (%) and BPS Analysis by Country, 2022 & 2032
Figure 177: MEA Oil Packing Machine Market Y-o-Y Growth (%) Projections by Country, 2022-2032
Figure 178: MEA Oil Packing Machine Market Value (US$ Bn) Analysis by Automation, 2015-2021
Figure 179: MEA Oil Packing Machine Market Volume (Units) Analysis by Automation, 2015-2032
Figure 180: MEA Oil Packing Machine Market Value Share (%) and BPS Analysis by Automation, 2022 & 2032
Figure 181: MEA Oil Packing Machine Market Y-o-Y Growth (%) Projections by Automation, 2022-2032
Figure 182: MEA Oil Packing Machine Market Value (US$ Bn) Analysis by Orientation, 2015-2021
Figure 183: MEA Oil Packing Machine Market Volume (Units) Analysis by Orientation, 2015-2032
Figure 184: MEA Oil Packing Machine Market Value Share (%) and BPS Analysis by Orientation, 2022 & 2032
Figure 185: MEA Oil Packing Machine Market Y-o-Y Growth (%) Projections by Orientation, 2022-2032
Figure 186: MEA Oil Packing Machine Market Value (US$ Bn) Analysis by End Use, 2015-2021
Figure 187: MEA Oil Packing Machine Market Volume (Units) Analysis by End Use, 2015-2032
Figure 188: MEA Oil Packing Machine Market Value Share (%) and BPS Analysis by End Use, 2022 & 2032
Figure 189: MEA Oil Packing Machine Market Y-o-Y Growth (%) Projections by End Use, 2022-2032
Figure 190: MEA Oil Packing Machine Market Attractiveness by Automation, 2022-2032
Figure 191: MEA Oil Packing Machine Market Attractiveness by Orientation, 2022-2032
Figure 192: MEA Oil Packing Machine Market Attractiveness by End Use, 2022-2032
Figure 193 MEA Oil Packing Machine Market Attractiveness by Country, 2022-2032
Need specific information?
Request CustomizationExplore Packaging Insights
View Reports