The flexible packaging paper market stands at the threshold of a decade-long expansion trajectory that promises to reshape packaging technology and consumer goods solutions. The market's journey from USD 7.2 billion in 2025 to USD 12.8 billion by 2035 represents substantial growth, demonstrating the accelerating adoption of advanced flexible packaging technology and premium barrier solutions across food & beverage, pharmaceutical, and consumer goods sectors.
The first half of the decade (2025-2030) will witness the market climbing from USD 7.2 billion to approximately USD 9.4 billion, adding USD 2.2 billion in value, which constitutes 42% of the total forecast growth period. This phase will be characterized by the rapid adoption of premium barrier paper products, driven by increasing demand for food preservation and the growing need for advanced packaging solutions worldwide. Enhanced moisture resistance capabilities and multilayer barrier systems will become standard expectations rather than premium options.
The latter half (2030-2035) will witness continued growth from USD 9.4 billion to USD 12.8 billion, representing an addition of USD 3.4 billion or 58% of the decade's expansion. This period will be defined by mass market penetration of specialized barrier technologies, integration with comprehensive manufacturing platforms, and seamless compatibility with existing packaging infrastructure. The market trajectory signals fundamental shifts in how manufacturers approach packaging quality and product protection, with participants positioned to benefit from growing demand across multiple paper grades and application segments.
| Period | Primary Revenue Buckets | Share | Notes |
|---|---|---|---|
| Today | Kraft paper (standard) | 38% | Food packaging, industrial applications |
| Greaseproof paper | 26% | Bakery products, fast food packaging | |
| Barrier-coated paper | 22% | Fresh food packaging, moisture protection | |
| Wax-coated paper | 14% | Frozen foods, dairy products | |
| Future (3-5 yrs) | Multi-barrier kraft paper | 28-34% | Advanced food preservation, extended shelf life |
| Bio-based barrier paper | 24-28% | Eco-friendly packaging, regulatory compliance | |
| High-barrier laminated paper | 18-22% | Premium food brands, pharmaceutical applications | |
| Water-resistant specialty paper | 15-18% | Fresh produce, perishable goods | |
| Compostable barrier paper | 10-15% | Environmental regulations, consumer preference |
At-a-Glance Metrics
| Metric | Value |
|---|---|
| Market Value (2025) | USD 7.2 billion |
| Market Forecast (2035) | USD 12.8 billion |
| Growth Rate | 6.0% |
| Leading Technology | Kraft Paper |
| Primary Application | Food & Beverage Packaging Segment |
The market demonstrates strong fundamentals with kraft paper systems capturing a dominant share through advanced barrier capabilities and packaging optimization. Food & beverage packaging applications drive primary demand, supported by increasing consumer goods consumption and premium barrier equipment adoption requirements. Geographic expansion remains concentrated in developed markets with established packaging cultures, while emerging economies show accelerating adoption rates driven by manufacturing proliferation and rising quality standards.
Primary Classification: The market segments by paper type into kraft paper, greaseproof paper, barrier-coated paper, and specialty papers, representing the evolution from basic packaging materials to sophisticated barrier solutions for comprehensive product protection optimization.
Secondary Classification: Application segmentation divides the market into food & beverage (snacks, bakery, dairy), pharmaceutical (medical devices, drug packaging), personal care (cosmetics, toiletries), and industrial (chemicals, consumer goods), reflecting distinct requirements for barrier properties, product compatibility, and regulatory standards.
Tertiary Classification: Barrier technology segmentation covers single-layer papers, multi-layer barrier papers, laminated papers, and specialty-coated papers, while coating type spans polyethylene coating, wax coating, silicone coating, and water-based barrier categories.
Regional Classification: Geographic distribution covers North America, Latin America, Europe, Asia-Pacific, and Middle East & Africa, with developed markets leading adoption while emerging economies show accelerating growth patterns driven by manufacturing expansion programs.
The segmentation structure reveals technology progression from standard packaging materials toward sophisticated barrier systems with enhanced moisture and grease resistance capabilities, while application diversity spans from food packaging operations to pharmaceutical establishments requiring precise barrier solutions.

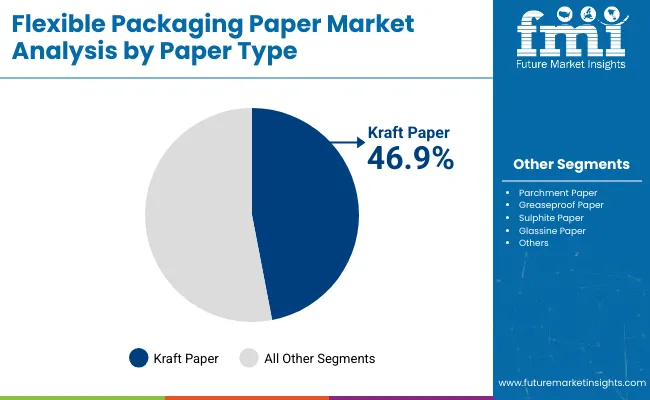
Market Position: Kraft Paper systems command the leading position in the flexible packaging paper market with 38% market share through advanced barrier features, including superior strength, moisture resistance, and packaging optimization that enable manufacturers to achieve optimal product protection across diverse packaging and processing environments.
Value Drivers: The segment benefits from manufacturer preference for reliable packaging systems that provide consistent barrier performance, enhanced product protection, and quality optimization without compromising paper integrity or affecting product characteristics. Advanced paper engineering enables barrier effectiveness, processing compatibility, and integration with existing packaging equipment, where barrier performance and processing consistency represent critical operational requirements.
Competitive Advantages: Kraft Paper systems differentiate through proven barrier reliability, consistent moisture resistance characteristics, and integration with automated packaging systems that enhance operational efficiency while maintaining optimal product safety standards suitable for diverse food and industrial applications.
Key market characteristics:
Greaseproof Paper systems maintain a 26% market position in the flexible packaging paper market due to their oil resistance properties and food packaging advantages. These systems appeal to establishments requiring effective grease barrier operations with competitive pricing for diverse food packaging applications. Market growth is driven by manufacturer preference, emphasizing barrier effectiveness and specialized packaging through optimized paper design.
Barrier-Coated Paper systems capture 22% market share through premium packaging requirements in food manufacturers, pharmaceutical companies, and branded consumer goods operations. These establishments demand advanced barrier systems capable of handling diverse products while providing exceptional protection performance and brand presentation.

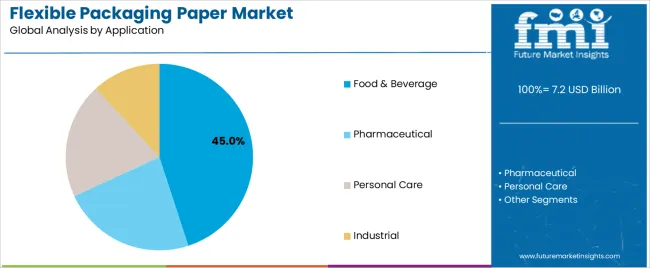
Market Context: Food & Beverage packaging applications demonstrate 45% market share due to widespread adoption of barrier packaging and increasing focus on product preservation, shelf life extension, and quality optimization that maximizes protection efficiency while maintaining processing standards.
Appeal Factors: Food packaging operators prioritize barrier performance, moisture resistance, and integration with diverse food types that enables optimized packaging operations across multiple product categories. The segment benefits from substantial consumer goods investment and food processing programs that emphasize the acquisition of barrier papers for protection optimization and quality assurance applications.
Growth Drivers: Food processing expansion programs incorporate barrier papers as standard packaging for premium products, while manufacturer growth increases demand for advanced barrier capabilities that comply with safety standards and minimize product deterioration.
Market Challenges: Varying product requirements and processing conditions may limit paper standardization across different manufacturers or packaging scenarios.
Application dynamics include:
Pharmaceutical packaging applications capture market share through regulatory compliance requirements in drug packaging, medical device protection, and sterile packaging. These applications demand specialized barrier systems capable of operating with pharmaceutical equipment while providing effective product protection and regulatory compliance capabilities.
Personal care packaging applications account for market share, including cosmetic packaging, toiletry protection, and consumer goods requiring advanced barrier capabilities for product optimization and brand presentation.
Market Position: Multi-Layer Barrier Paper applications command significant market position with 7.2% CAGR through growing advanced packaging adoption and barrier enhancement programs for premium product protection.
Value Drivers: This technology segment provides the ideal combination of barrier performance and processing compatibility, meeting requirements for moisture protection, product preservation, and operational efficiency without reliance on single-layer limitations.
Growth Characteristics: The segment benefits from broad applicability across manufacturing industries, advanced barrier adoption, and established processing programs that support widespread paper usage and operational convenience.
Market Context: Consumer Goods Manufacturing dominates the market with 7.6% CAGR, reflecting the primary demand source for flexible packaging paper in manufacturing operations and product packaging platforms.
Business Model Advantages: Manufacturing operations provide direct market demand for barrier packaging materials, driving quality standards and processing innovation while maintaining product safety and consumer satisfaction requirements.
Operational Benefits: Manufacturing applications include product protection, quality assurance, and consumer experience enhancement that drive consistent demand for packaging papers while providing access to latest barrier technologies.
| Category | Factor | Impact | Why It Matters |
|---|---|---|---|
| Driver | Growing demand for convenient packaging & ready-to-eat foods (processed foods, snack products) | ★★★★★ | Rising consumer preference for convenience foods creates massive demand for flexible packaging; busy lifestyle drives market expansion. |
| Driver | Food & beverage industry expansion & premium product packaging | ★★★★★ | Rapid growth in F&B sector globally; quality packaging requirements across multiple product categories drive bulk procurement and consistent demand. |
| Driver | Plastic packaging regulations & environmental compliance (government mandates) | ★★★★★ | Regulatory pressure eliminating plastic alternatives; paper-based packaging becomes preferred option for compliance with environmental legislation. |
| Restraint | Competition from rigid packaging & alternative materials | ★★★☆☆ | Growing adoption of rigid containers in select applications; structural packaging requirements create substitution pressure for flexible papers. |
| Restraint | Raw material price volatility & pulp cost fluctuations | ★★★★☆ | Wood pulp and chemical price variations impact profit margins; commodity nature of basic papers constrains pricing power during cost increases. |
| Trend | Advanced barrier coatings & multi-layer technology (enhanced moisture resistance) | ★★★★★ | Technical improvements enhancing product preservation; bio-based barriers replacing traditional synthetic coatings for better performance. |
| Trend | Smart packaging integration & digital printing (QR codes, product information) | ★★★★☆ | Technology convergence enabling interactive packaging; consumer engagement through digital integration drives premium paper adoption. |
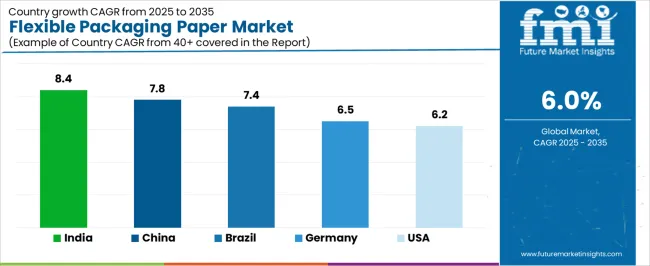
The flexible packaging paper market demonstrates varied regional dynamics with Growth Leaders including China (7.8% growth rate) and India (8.4% growth rate) driving expansion through manufacturing proliferation and packaging modernization initiatives. Steady Performers encompass United States (6.2% growth rate), Germany (6.5% growth rate), and developed regions, benefiting from established manufacturing cultures and barrier technology adoption. Emerging Markets feature Brazil (7.4% growth rate) and developing regions, where consumer goods expansion and packaging enhancement support consistent growth patterns.
Regional synthesis reveals North American markets leading value generation through premium barrier adoption and advanced packaging culture, while Asian markets demonstrate highest volume growth supported by manufacturing proliferation and rising consumer goods trends. European markets show moderate growth driven by regulatory packaging requirements and barrier technology integration.

| Region/Country | 2025-2035 Growth | How to win | What to watch out |
|---|---|---|---|
| China | 7.8% | Manufacturing scale; cost-effective barrier solutions | Quality inconsistency; local competition |
| India | 8.4% | Consumer goods expansion; affordable premium papers | Infrastructure gaps; distribution challenges |
| United States | 6.2% | Advanced barriers; processing innovation | Regulatory complexity; margin pressure |
| Germany | 6.5% | Technical excellence; premium positioning | Cost sensitivities; competition pressure |
| Brazil | 7.4% | Consumer goods growth; regional partnerships | Economic volatility; logistics constraints |
China establishes fastest manufacturing growth through massive consumer goods infrastructure and comprehensive packaging development, integrating advanced flexible packaging papers as standard components in manufacturing operations and processing installations. The country's 7.8% growth rate reflects explosive consumer goods adoption and domestic manufacturing industry expansion that mandates the use of quality barrier systems in commercial and production facilities. Growth concentrates in major manufacturing centers, including Guangzhou, Shanghai, and Shenzhen, where packaging platforms showcase integrated barrier systems that appeal to manufacturers seeking advanced product protection capabilities and processing optimization applications.
Chinese manufacturers are developing domestically-produced paper solutions that combine local production advantages with functional barrier features, including enhanced moisture resistance and multi-layer capabilities. Distribution channels through manufacturing supply chains and processing equipment partnerships expand market access, while consumer goods culture supports adoption across diverse commercial and industrial segments.
Strategic Market Indicators:
In Mumbai, Bangalore, and Delhi, manufacturers and consumer goods companies are implementing flexible packaging papers as standard barrier materials for product protection and quality applications, driven by increasing manufacturing investment and processing programs that emphasize the importance of packaging quality. The market holds an 8.4% growth rate, supported by consumer goods expansion and industrialization programs that promote quality paper systems for commercial and manufacturing applications. Indian operators are adopting paper solutions that provide consistent barrier performance and product protection features, particularly appealing in urban regions where manufacturing quality and packaging performance represent critical business expectations.
Market expansion benefits from growing middle-class consumption patterns and manufacturing proliferation that enable widespread adoption of quality packaging systems for industrial and commercial applications. Technology adoption follows patterns established in industrial packaging, where functionality and value drive procurement decisions and operational deployment.
Market Intelligence Brief:
United States establishes technology leadership through comprehensive manufacturing programs and advanced packaging culture development, integrating flexible packaging papers across consumer goods and processing applications. The country's 6.2% growth rate reflects established consumer goods consumption patterns and mature barrier technology adoption that supports widespread use of premium paper systems in manufacturing and processing facilities. Growth concentrates in major industrial areas, including California, Texas, and the Midwest, where packaging culture showcases mature barrier deployment that appeals to manufacturers seeking proven product protection capabilities and brand presentation applications.
American manufacturing establishments leverage established distribution networks and comprehensive product availability, including custom-printed papers and advanced barrier options that create brand differentiation and operational advantages. The market benefits from mature processing infrastructure and manufacturer willingness to invest in quality packaging materials that enhance product experience and presentation optimization.
Market Intelligence Brief:
Germany's advanced engineering market demonstrates sophisticated flexible packaging paper deployment with documented performance effectiveness in manufacturing applications and processing facilities through integration with existing packaging systems and technical infrastructure. The country leverages technical excellence and quality standards to maintain a 6.5% growth rate. Industrial centers, including Bavaria, North Rhine-Westphalia, and Baden-Württemberg, showcase premium installations where packaging papers integrate with comprehensive processing platforms and quality systems to optimize product protection operations and technical effectiveness.
German operators prioritize packaging performance and technical credentials in paper procurement, creating demand for engineered products with advanced features, including multi-layer barriers and processing compatibility. The market benefits from established quality consciousness and a willingness to invest in premium packaging materials that provide superior technical benefits and adherence to performance standards.
Market Intelligence Brief:
Brazil's market expansion benefits from diverse consumer goods demand, including manufacturing expansion in São Paulo and Rio de Janeiro, industrial establishment growth, and rising packaging consumption that increasingly incorporate paper solutions for product packaging applications. The country maintains a 7.4% growth rate, driven by urbanization and increasing recognition of packaging benefits, including improved product protection and enhanced brand presentation.
Market dynamics focus on affordable quality paper solutions that balance barrier performance with cost considerations important to Brazilian manufacturers. Growing consumer goods proliferation creates continued demand for modern packaging systems in new manufacturing infrastructure and industrial modernization projects.
Strategic Market Considerations:
The European flexible packaging paper market is projected to grow from USD 2.1 billion in 2025 to USD 3.5 billion by 2035, registering a CAGR of 5.2% over the forecast period. Germany is expected to maintain its leadership position with a 31.2% market share in 2025, supported by its strong manufacturing base and advanced barrier technology adoption.
France follows with a 24.8% share in 2025, driven by food packaging regulations and consumer goods expansion. United Kingdom holds a 18.6% share through manufacturing modernization and packaging applications. Italy commands a 14.7% share, while Spain accounts for 10.7% in 2025. The rest of Europe region is anticipated to gain momentum, expanding its collective share from 8.2% to 9.3% by 2035, attributed to increasing manufacturing adoption in Nordic countries and emerging industrial establishments implementing quality packaging programs.

| Stakeholder | What they actually control | Typical strengths | Typical blind spots |
|---|---|---|---|
| Global manufacturers | Production capacity, barrier technology, distribution networks | Scale efficiency, consistent quality, broad reach | Innovation speed; local customization |
| Specialty converters | Custom printing; advanced barriers; premium designs | Quality leadership; manufacturer partnerships; differentiation | Mass market penetration; price competition |
| Regional producers | Local manufacturing, distribution channels, competitive pricing | Market proximity; cultural understanding; cost advantage | Technology gaps; international expansion |
| Private label suppliers | Retailer partnerships, value positioning, volume production | Price competitiveness; retail access; volume scale | Brand loyalty; premium segment access |
| Technology innovators | Barrier technology, coating solutions, material science | Technical expertise; patent portfolio; performance | Market scalability; distribution challenges |
| Item | Value |
|---|---|
| Quantitative Units | USD 7.2 billion |
| Paper Type | Kraft Paper, Greaseproof Paper, Barrier-Coated Paper, Specialty Papers |
| Application | Food & Beverage, Pharmaceutical, Personal Care, Industrial |
| Barrier Technology | Single-Layer, Multi-Layer Barrier, Laminated, Specialty-Coated |
| Coating Type | Polyethylene Coating, Wax Coating, Silicone Coating, Water-Based Barrier |
| Regions Covered | North America, Latin America, Europe, Asia-Pacific, Middle East & Africa |
| Countries Covered | United States, China, Germany, India, France, Brazil, Canada, Japan, United Kingdom, Italy, and 35+ additional countries |
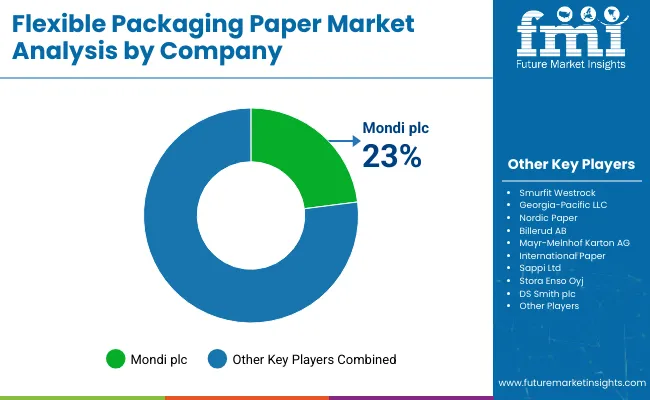
| Key Companies Profiled | Mondi Group, Stora Enso, UPM-Kymmene Corporation, Sappi Limited, Billerud AB, Ahlstrom-Munksjö, Glatfelter Corporation |
| Additional Attributes | Dollar sales by paper type and barrier technology categories, regional adoption trends across Asia-Pacific, North America, and Europe, competitive landscape with packaging manufacturers and industrial suppliers, consumer preferences for product protection and brand presentation, integration with processing equipment and manufacturing systems, innovations in barrier technology and moisture resistance, and development of compostable paper solutions with enhanced performance and product protection capabilities. |
The global flexible packaging paper market is estimated to be valued at USD 7.2 billion in 2025.
The market size for the flexible packaging paper market is projected to reach USD 12.8 billion by 2035.
The flexible packaging paper market is expected to grow at a 6.0% CAGR between 2025 and 2035.
The key product types in flexible packaging paper market are kraft paper, greaseproof paper, barrier-coated paper and specialty papers.
In terms of application, food & beverage segment to command 45.0% share in the flexible packaging paper market in 2025.


Full Research Suite comprises of:
Market outlook & trends analysis
Interviews & case studies
Strategic recommendations
Vendor profiles & capabilities analysis
5-year forecasts
8 regions and 60+ country-level data splits
Market segment data splits
12 months of continuous data updates
DELIVERED AS:
PDF EXCEL ONLINE
Market Share Breakdown of Flexible Packaging Paper Manufacturers
Flexible Plastic Pouch Market Size and Share Forecast Outlook 2025 to 2035
Flexible Rubber Sheets Market Size and Share Forecast Outlook 2025 to 2035
Flexible Printed Circuit Boards Market Size and Share Forecast Outlook 2025 to 2035
Flexible Electronic Market Size and Share Forecast Outlook 2025 to 2035
Flexible Foam Market Size and Share Forecast Outlook 2025 to 2035
Flexible AC Current Transmission System Market Size and Share Forecast Outlook 2025 to 2035
Flexible End-Load Cartoner Market Size and Share Forecast Outlook 2025 to 2035
Flexible Screens Market Size and Share Forecast Outlook 2025 to 2035
Flexible Metallic Conduit Market Size and Share Forecast Outlook 2025 to 2035
Flexible Electrical Conduit Market Size and Share Forecast Outlook 2025 to 2035
Flexible Display Market Size and Share Forecast Outlook 2025 to 2035
Flexible Substrate Market Size and Share Forecast Outlook 2025 to 2035
Flexible Metallic Tubing Market Size and Share Forecast Outlook 2025 to 2035
Flexible Barrier Films for Electronics Market Size and Share Forecast Outlook 2025 to 2035
Flexible Colored PU Foams Market Growth - Trends & Forecast 2025 to 2035
Flexible Endoscopes Market Growth - Trends & Forecast 2025 to 2035
Flexible Pipes Market Analysis by Application, Material, and Region: Forecast for 2025 to 2035
Flexible Thin Film Market Trends - Growth & Forecast 2025 to 2035
Flexible Glass for Flexible Electronics Market Analysis by Application, End User, and Region Through 2035

Thank you!
You will receive an email from our Business Development Manager. Please be sure to check your SPAM/JUNK folder too.
Chat With
MaRIA