Reports

- Global Locations -

Headquarters

Future Market Insights, Inc.

Christiana Corporate, 200
Continental Drive, Suite 401,
Newark, Delaware - 19713,
United States

T: +1-845-579-5705

Americas

Future Market Insights, Inc.

616 Corporate Way, Suite 2-9018,
Valley Cottage, NY 10989, United States

T: +1-347-918-3531

MEA

Future Market Insights

1602-6 Jumeirah Bay X2 Tower, Plot No: JLT-PH2-X2A,
Jumeirah Lakes Towers, Dubai,
United Arab Emirates

Europe

Future Market Insights

3rd Floor, 207 Regent Street,
W1B 3HH London
United Kingdom

T: + 44 (0) 20 8123 9659
D: +44 (0) 20 3287 4268

Asia Pacific

Future Market Insights

IndiaLand Global Tech Park, Unit UG-1, Behind Grand HighStreet, Phase 1, Hinjawadi, MH, Pune – 411057, India

Flexible Screens Market Outlook (2022 to 2032)

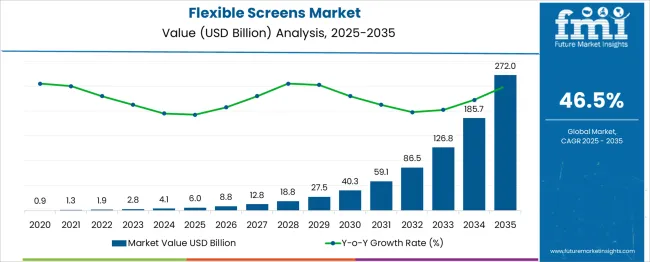
[235 Pages Report] The global flexible screens market was valued at around US$ 1.9 Billion in 2021. With a projected CAGR of 46.5% for the next ten years, the market is likely to reach a valuation of nearly US$ 189 Billion by the end of 2032.

Attribute Details
Flexible Screens Market Size (2021) US$ 1.9 Billion
Flexible Screens Market Size (2022) US$ 4.2 Billion
Projected Market Value (2032) US$ 189 Billion
Global Market Growth Rate (2022 to 2032) 46.5% CAGR
Share of Top 4 Countries More than 99%

Future Market Insights’ analysis reveals that over 3/4th of the market, revenue is grossed from flexible AMOLED screens. On the other hand, POLED-based flexible screens will be the most lucrative indicating nearly 45X growth in a decade starting in 2022. While it is no less apparent that smartphones and tablets will be the key procurer of flexible screens, the screens with 6’’ - 20’’ panel sizes will populate a large proportion of the revenue.

Don't pay for what you don't need

Customize your report by selecting specific countries or regions and save 30%!

Parallel Markets Evolved Into Flexible Screens Resulting In Growth Of Flexible Screens

Rapidly evolving screen technology has been witnessing frequent changes in technology. However, traditional technology is not being obsolete completely. During the years 2000-2010, TFT-LCD technology offered Flat, Slim, and Green screens for end-use products such as LCD TV and LCD laptops.

Between 2012 -2020 OLED technology offered Vivid, Light, and flexible screens for end-use products such as smartphones, tablets, OLED TVs, Unbreakable phones, Wearables, and foldable phones. OLED technology is further distributed to Glass-based OLEDs and Plastic-based OLEDs.

Flexible Screens Market

The evolution of these technologies into the flexible screens market has diluted the share of traditional technology to penetrate into advanced technology and the markets impacted by this are LED screens, flexible OLED screens, flexible Screens technology, flexible LED screens, flexible EPD screens, flexible glass screens, and flexible E-ink screens.

Upcoming OLCD and Electronic Paper Display technologies have high growth opportunities, which will significantly impact the flexible screen market during the forecast period.

Sales Analysis Of Flexible Screens From 2019 To 2021 Vs Market Outlook For 2022 To 2032

The global market for flexible screens rising from the infancy stage of its lifecycle expanded at a three-digit CAGR of 142.1% over the last three years (2019-2021). The market growth is projected to saturate with the projected drop in their prices coupled with mass-level manufacturing resulting in benefits of economies of scale.

In 2021, nearly 1.4 Billion units of smartphones were shipped worldwide, of which flexible smartphones accounted for a meager 0.3% share. Flexible screens for smartphones also accounted for nearly the same proportion. In a decade’s time, it is highly likely that this proportion will swell to over 20%.

Currently, there are 11 brands of foldable and bendable smartphones in the market, of which six comes from Samsung’s flagship Galaxy series of smartphones. The other brand owners Huawei and Xiaomi have four and one brand respectively. In this competition of trio, the supply side is significantly heavy and stressed, as the smartphone manufacturers have been striving to procure a large volume of flexible screens.

Other applications of flexible screens including flexible screens for tablets, flexible screens for laptops, flexible screens for personal computers, flexible screens for smartwatches, flexible screens for smart wearables, flexible screens for televisions, and flexible screens for e-readers have either very low or no penetration in the consumer’s sphere owing to their lower added-utility as compared to smartphones.

Millennials have been observed to be the most active buyers of flexible screen-based devices owing to their growing income levels and increasing share of household expenditure on smart technology products. Nevertheless, buyers from other age groups will soon start purchasing them to make the demand more mainstream.

The global flexible screens market is predicted to surge ahead at a CAGR of 46.5% and record sales worth US$ 189.5 Billion by the end of 2032. China, the global electronics manufacturing hub, will continue to be the largest procurer of flexible screens throughout the analysis period accounting for over US$ 182 Billion absolute dollar opportunity in the coming 10-year epoch.

Sudip Saha
Sudip Saha

Principal Consultant

Talk to Analyst

Find your sweet spots for generating winning opportunities in this market.

How The Buzzword Foldable Is Creating A Demand Swell In Smartphone Sphere?

Manufacturers Vouch for Less Space Consuming Smartphones - Foldable Smartphones

Moor’s law is still relevant and its application can be observed with the continuous miniaturization of electronics. While electronic product manufacturers put their efforts into shrinking the dimension while retaining their utility, the consumers, on the other hand, feel that foldable, bendable, and rollable electronics as trendy which is uplifting their social status. With this trend, foldable smartphones will replace around 1/5th of all smartphones purchased by 2032.

How Technological Transformation Is Taking Flexible Screens From Infancy To Growth Stage Of Product Life Cycle?

The research will continue and Development will follow

Flexible screen manufacturers nowadays are closely working on commercializing OLCD display screens and it is projected that the mass production of OLCD will be initiated by the end of 2022. Flexible panels, including flexible passive transparent TSPs, flexible active backplanes, and flexible light sources, have been studied at the UNIST research center in order to bring flexible devices to reality.

In addition, testing of nano-scale flexible panels was carried out to assess the performance of similar individual materials to those found in flexible panels. A readout IC for the display panel was also investigated in order to achieve consistent curved flexible panel performance.

Finally, the flexible device's ergonomics were investigated in order to determine its impact on human users. This flow of research solely dictates the growing appetite of end-use sectors for flexible screens which are pushing the development.

Low-cost flexible displays poised for growth include electrophoretic displays, electrochromic displays, and electroluminescent displays. Some of the organizations continuing the research and development of flexible displays are Flexible Display Roll to Roll Research Center (FDRC), Flexible Electronics and Display Center, Arizona State University, National Centre for Flexible Electronics, IIT Kanpur, and Ulsan National Institute of Science and Technology.

Many technologies have been developed to create flexible displays. Electrophoretic displays (EPD) and OLEDs are most advantageous and contribute to the exponential growth of flexible screen penetration. EPDs were first used as an electronic paper display, thereby creating a flexible material laminated on a rigid thin-film transistor (TFT) active matrix.

Liquid crystal displays (LCD) can be used in flexible form factors theoretically, however, the trend in flexibles is increased deployment of OLEDs, which do not require a backlight as they are self-luminous, and have reduced thickness and faster response times while improving color and contrast.

OLED technology represents a new era of low-energy, transparent and flexible displays and lighting products that are already in production due to their low cost, better applicability, and ease of manufacturing.

Get the data you need at a Fraction of the cost

Personalize your report by choosing insights you need
and save 40%!

How Next-Gen Wearables Are Emerging As Potent End-Use Channels For Flexible Screens?

From Smartphones to smart clothing - Onus Goes to Flexible Screens

Wearables have gained significant attention these days, with new substrates, low power requirements, power scavenging, durability, and novel connectivity. Korean researchers claim to have invented meta-display technology, which could become a prominent factor in increasing the demand for next-gen wearables.

Most stretchable materials (rubber, cloth, or anything else having some elasticity) tend to shrink in one direction when stretched in the other direction. While usually this is not an issue but can be an issue in some applications. However, no one wants to sew a touchscreen display on the sleeves of jackets and move the arm to distort the image on the screen.

Designed to overcome this fundamental difficulty with stretchable displays, metamaterials have been brought into the picture, which are sophisticated materials that are often composed of small elements arranged in repeating patterns that exhibit unique behavior which is not found in natural materials. Metamaterials could thus be the key to the sustained growth of the flexible display market in the coming years.

The idea of intelligent apparel as a category of clothing that has dynamic functions, further to the conventional properties of clothing, has been introduced. The intelligent feature of the clothing is obtained by utilizing either a specifically developed fabric or by integrating a digital device into conventional fabric.

Thus, a sweater that adjusts color under the effect of heat should be regarded as smart clothing, as should a bracelet that monitors the heart rate of an athlete even as he/she is exercising.

Accordingly, three categories for these smart clothing are envisaged as follows:

  • Virtual clothing assistants have a ‘memory’ to save data and perform complicated calculations.
  • Clothing monitors that record the performance, behavior, or fitness of the person
  • Regulative clothing that adjusts positive parameters, together with temperature or ventilation

Smart clothing can be used in manual or automatic modes. The wearer can act on added intelligent functions while automatic function cloths react autonomously to external parameters like light, temperature, and humidity.

The growing prevalence of such types of applications in the apparel industry is the key factor that will generate demand for flexible displays in the future. This is expected to augment the demand for flexible screens in the wearables category.
Country-Wise Insights

How does China continue Being the Nucleus of Global Flexible Display Demand?

The World’s Factory to Retain its Dominance for Flexible Screens Consumption

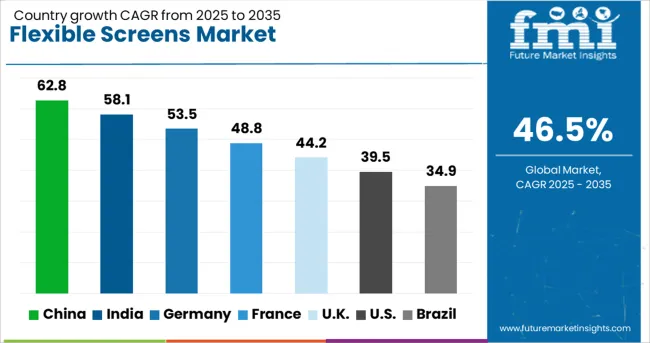
China accounted for over 97% of the global flexible screens market in 2021, representing the first choice of global small electronics product manufacturers.

The mix of lower wages, availability of technical workforce, fertile business ecosystem, lower compliance, business-friendly taxes and duties, and depressed national currency makes it a lucrative production hotspot for several products, especially electronics. With these statistics, it will be no wonder to expect China as a market with a US$ 182 Billion absolute dollar opportunity between 2022 and 2032.

How is the Demand for Flexible Screens Shaping Up in South Korea?

Flexible Smartphones to Rollable TVs - South Korea revving up to Become Hotspot for Next Electronics

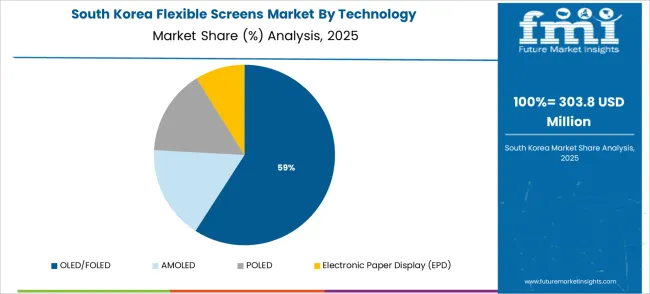
In 2021, South Korea was the second-largest flexible screen consumer after China, with a market value of US$ 51 Million. Currently, it is the only rollable television manufacturer worldwide. Being the headquarters of the electronics giant Samsung, South Korea generates strong demand for flexible screens for the manufacturing of foldable smartphones.

It is highly likely, that South Korea will become a US$ 2.8 Billion flexible screens market forecasted by the end of 2032.

Category-Wise Insights

Why Flexible Screens Market Depends Nearly Solely on Sales of Panel Size 6’’ to 20’’?

Most flexible electronics manufactured currently use flexible screens of display size 6’’ - 20’’

Smartphones and tablets and laptops are the only electronics using flexible screens currently. Considering their size, the requirement for flexible screens with panel sizes 6’’- 20’’ accounts for a revenue share of over 99%.

Other panel sizes which include up to 6’’ and above 20’’ are highly unlikely to gain more than 1% share throughout the analysis period, as they are used to fulfill the demand for flexible screens for smartwatches and wearables, demand for flexible screens for televisions, and demand for flexible screens for e-readers.

While TVs presently are made to order and have a significantly high price tag, e-readers are yet to be commercialized. With the miniaturization of smartphones, most of the features of wearables will be available with smartphones.
Competitive Landscape

At present, flexible screen manufacturers are largely aiming at setting up manufacturing facilities, winning orders, and showcasing technology at exhibitions.

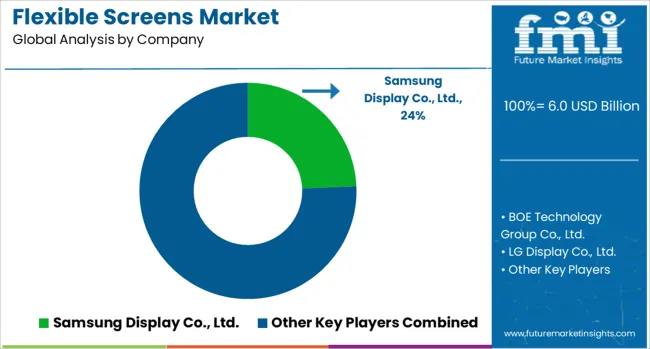
The key companies operating in the flexible screen market include Samsung Display Co. Ltd., BOE Technology Group Co. Ltd., LG Display Co. Ltd., Visionox Technology, Inc., AU Optronics Corp., Tianma Microelectronics Co. Ltd., Shenzhen Royole Technologies Co. Ltd., E Ink Holdings Inc., HannStar Display Corporation, ever display Optronics (Shanghai) Co. Ltd., Iljin Display Co. Ltd., Shenzhen RADIANT Technology Co. Ltd., and Osel Technology Pvt. Ltd.

Some of the recent developments by key providers of flexible screens are as follows:

  • In April 2022, BOE announced that it will expand production lines in Western China. The production line would be fully functional by the end of 2022. The third production line in central China is for testing production. Companies nearly shipped 60 million OLED panels which are making it 2nd largest OLED manufacturer and securing 17% of the global market share. The company planned to ship 100 million OLED panel units by the end of 2022.
  • In May 2021, Samsung Display unveiled its latest OLED innovations at the SID Display Week trade show. It showed the way forward with its innovative offerings, such as Slidable, S-Foldable, and under-panel cameras. Samsung Display unveiled its next-generation OLED technologies to the world’s biggest exhibit of displays, affirming its leadership within the industry. It opened a virtual exhibition booth to introduce its displays to potential customers.
  • In Jan 2021, CES 2021 showcased new products from TCL CSOT, which include a 17-inch OLED scroll print display that is 0.18 millimeters thin and a 6.7-inch AMOLED rollable display. TCL CSOT is a parent company of TCL Technology and a company that specializes in next-generation display technology. The 17-inch printed OLED scroll display for flexible, free-form displays is only 0.18 millimeters thin, a significant breakthrough for this kind of technology. It is highly scrollable and portable, and easily fits anywhere like a scrolling picture.

Similarly, recent developments related to companies manufacturing Flexible Screens have been tracked by the team at Future Market Insights, which is available in the full report.

Flexible Screens Industry Report Scope

Attribute Details
Forecast Period 2022 to 2032
Historical Data Available for 2019 to 2021
Market Analysis US$ Million for Value
Key Countries Covered China, South Korea, Taiwan, and India
Key Market Segments Covered Functionality, Technology, Panel Size, and Application
Key Companies Profiled
  • Samsung Display Co. Ltd.
  • BOE Technology Group Co. Ltd.
  • LG Display Co. Ltd.
  • Visionox Technology, Inc.
  • AU Optronics Corp.
  • Tianma Microelectronics Co. Ltd.
  • Shenzhen Royole Technologies Co. Ltd.
  • E Ink Holdings Inc.
  • HannStar Display Corporation
  • Everdisplay Optronics (Shanghai) Co. Ltd.
  • Iljin Display Co. Ltd.
  • Shenzhen RADIANT Technology Co. Ltd.
  • Osel Technology Pvt. Ltd.
Report Coverage Market Forecast, Competition Intelligence, Drivers, Restraints, Opportunities and Threats Analysis, Market Dynamics and Challenges, and Strategic Growth Initiatives
Customization & Pricing Available upon Request

Key Segments Covered In Flexible Screens Industry Survey

By Functionality:

  • Bendable and Foldable Display
  • Rollable Display

By Technology:

  • OLED/ FOLED
  • AMOLED
  • POLED
  • Electronic Paper Display (EPD)

By Panel Size:

  • Up to 6’’
  • 6’’ - 20’’
  • Above 20’’

By Application:

  • Smartphones & Tablets
  • Laptops
  • Smartwatches & Wearables
  • Television
  • E-Readers

By Region:

  • China
  • World Exc. China

Frequently Asked Questions

How much is the global Flexible Screens market currently worth?

The global flexible screens market was valued at US$ 4.2 Billion in 2021 and is expected to grow 45.6X by 2032.

What is the Flexible Screens Market Forecast through 2032?

The flexible screens industry is set to witness a high growth rate of 15.1% over the forecast period and be valued at US$ 189 Billion by 2032.

At what rate did demand Flexible Screens increase over the past 3 years?

The Flexible Screens Market expanded at 141.3% from 2019 through 2021.

Who are the key players shaping the Flexible Screens industry?

Samsung Display Co. Ltd., BOE Technology Group Co. Ltd., LG Displays, and Shenzhen China Star Optoelectronics Technologies Co. Ltd. are the key suppliers of flexible screens.

Which panel size of Flexible Screens is driving market demand?

Flexible screens of panel size 6’’ - 20’’ have been driving the demand accounting for over 99% share in 2021.

Who are the top 5 countries driving the highest sales of Flexible Screens?

China, South Korea, Taiwan, and India are expected to drive the most sales growth of flexible screens.

What is the China market outlook for Flexible Screens?

The market in China accounts for over 99% of the global market share.

Which countries are key producers of flexible screens?

Most of the flexible screens used globally are manufactured in China and South Korea.

Table of Content

1. Executive Summary | Flexible Screens Market

    1.1. Global Market Outlook

    1.2. Key Findings

    1.3. Market Share Analysis

    1.4. Summary of Statistics

    1.5. Value Propositions

2. Market Overview

    2.1. Introduction and Definition

    2.2. Market Taxonomy

3. Market Background

    3.1. Global Scenario

        3.1.1. Consumer Preference Shifting from Flat Screens to Flexible Screens

        3.1.2. Display, Flexible Display Vs End Use Applications Market Size and Growth Analysis

        3.1.3. Was there any Impact of Covid-19 on Demand?

    3.2. Global Technology Roadmap

        3.2.1. Flexible Products Development Trend

        3.2.2. Roadmap for Flexible Products and Technology

    3.3. Global Patent Analysis

        3.3.1. Application-based distribution of patents

        3.3.2. Major assignees (based on representative member per family)

        3.3.3. Representative List of Centers for Research and Development in Flexible and Printable Electronics

        3.3.4. Key Annual Conferences in the Field of Flexible and Printable Electronics

    3.4. Forecast Factors - Relevance & Impact

        3.4.1. Top Companies’ Historical Growth

        3.4.2. Government Expenditure on Electronic Industry Development

        3.4.3. Flexible Electronics Market Growth

        3.4.4. Growth of the Smartphones Industry

        3.4.5. Increasing Adoption of Next-Gen Wearables

        3.4.6. Growth of New Raw Material Substitutes in Flexible Electronics

        3.4.7. Impact of Emerging Technologies on the Electronics Sector

        3.4.8. Increasing Semiconductor Manufacturing Growth

        3.4.9. Growth in Flexible Electronic Product Shipments

        3.4.10. Growth Capital Expenditure on Manufacturing

    3.5. Investment Feasibility Assessment

    3.6. Industry Value and Supply Chain Analysis

        3.6.1. Profit Margin Analysis at each sales point

        3.6.2. Raw Material Procurement Process

        3.6.3. Raw Material Analysis

        3.6.4. List & role of key participants

            3.6.4.1. OLED Panel Makers

            3.6.4.2. OLED Equipment Suppliers

            3.6.4.3. OLED Material Suppliers

    3.7. PESTLE Analysis of Market

    3.8. Porter’s Five Force

    3.9. Market Dynamics

        3.9.1. Drivers

        3.9.2. Restraints

        3.9.3. Opportunity Analysis

        3.9.4. Trends

4. Global Market Demand Analysis 2019 to 2021 and Forecast, 2022 to 2032

    4.1. Historical Market Volume (Million Units) Analysis, 2019 to 2021

    4.2. Current and Future Market Volume Projections, 2022 to 2032

        4.2.1. Y-o-Y Growth Trend Analysis

        4.2.2. Absolute $ Opportunity Analysis

    4.3. Global - Scenario-Based Forecast

5. Global - Pricing Analysis

    5.1. Regional Pricing Analysis

    5.2. Pricing Analysis by Screen Size

    5.3. Global - Pricing Forecast Analysis

6. Global Demand (in Value or Size in US$ Million and in Volume in Units) Analysis 2019 to 2021 and Forecast, 2022 to 2032

    6.1. Historical Market Value (US$ Million) Analysis, 2019 to 2021

    6.2. Current and Future Market Value (US$ Million) Projections, 2022 to 2032

    6.3. Absolute $ Opportunity Analysis

    6.4. Global: Introduction to Market Statistics

7. Global Analysis 2019 to 2021 and Forecast 2022 to 2032, by Functionality

    7.1. Key Findings

    7.2. Market Size (US$ Million) and Market Volume (Units) Analysis and Forecast By Functionality, 2019 to 2032

        7.2.1. Bendable and Foldable Display

        7.2.2. Rollable Display

    7.3. Market Share Analysis By Functionality

    7.4. Market YoY Growth Projection (%) By Functionality

    7.5. Market Attractiveness Analysis By Functionality

8. Global Analysis 2019 to 2021 and Forecast 2022 to 2032, by Technology

    8.1. Key Findings

    8.2. Market Size (US$ Million) and Market Volume (Units) Analysis and Forecast By Technology, 2019 to 2032

        8.2.1. OLED/FOLED

        8.2.2. AMOLED

        8.2.3. POLED

        8.2.4. Electronic Paper Display (EPD)

    8.3. Market Share Analysis By Technology

    8.4. Market YoY Growth Projection (%) By Technology

    8.5. Market Attractiveness Analysis By Technology

9. Global Analysis 2019 to 2021 and Forecast 2022 to 2032, by Panel Size

    9.1. Key Findings

    9.2. Market Size (US$ Million) and Market Volume (Units) Analysis and Forecast By Panel Size, 2019 to 2032

        9.2.1. Up to 6”

        9.2.2. 6-20”

        9.2.3. Above 20”

    9.3. Market Share Analysis By Panel Size

    9.4. Market YoY Growth Projection (%) By Panel Size

    9.5. Market Attractiveness Analysis By Panel Size

10. Global Analysis 2019 to 2021 and Forecast 2022 to 2032, by Application

    10.1. Key Findings

    10.2. Market Share Analysis By Application

    10.3. Market YoY Growth Projection (%) By Application

    10.4. Market Attractiveness Analysis By Application

11. Global Analysis 2019 to 2021 and Forecast 2022 to 2032, by Region

    11.1. Key Findings

    11.2.Market Size (US$ Million) and Market Volume (Units) Analysis and Forecast By Region, 2019 to 2032

        11.2.1. China

        11.2.2. World Except for China

    11.3. Market Share Analysis By Region

    11.4. Market YoY Growth Projection (%) By Region

    11.5. Market Attractiveness Analysis By Region

12. China Market Analysis 2019 to 2021 and Forecast 2022 to 2032

    12.1. China Market: Introduction to Market Statistics

        12.1.1. Market Volume Statistics

            12.1.1.1. China Market Volume (Units), 2019 to 2032

            12.1.1.2. China Market Demand Opportunity (Units), 2019 to 2032

            12.1.1.3. China Market YoY Growth

        12.1.2. Market Value Statistics

            12.1.2.1. China Market Value (US$ Million), 2019 to 2032

            12.1.2.2. China Market Incremental Dollar Opportunity (US$ Million), 2019 to 2032

            12.1.2.3. China Market YoY Growth

    12.2. China  Market - Scenario-Based Forecast

    12.3. Market Size (US$ Million) and Volume (Units) Forecast By Market Taxonomy, 2022 to 2032

        12.3.1. By Functionality

        12.3.2. By Technology

        12.3.3. By Panel Size

        12.3.4. By Application

    12.4. Market Share Analysis

        12.4.1. By Functionality

        12.4.2. By Technology

        12.4.3. By Panel Size

        12.4.4. By Application

    12.5. Market Growth Projections Analysis

        12.5.1. By Functionality

        12.5.2. By Technology

        12.5.3. By Panel Size

        12.5.4. By Application

    12.6. Market Attractiveness Analysis

        12.6.1. By Functionality

        12.6.2. By Technology

        12.6.3. By Panel Size

        12.6.4. By Application

13. World Expect China Market Analysis 2019 to 2021 and Forecast 2022 to 2032

    13.1. World Expect China Market: Introduction to Market Statistics

        13.1.1. Market Volume Statistics

            13.1.1.1. World Except for China Market Volume (Units), 2019 to 2032

            13.1.1.2. World Except for China Market Demand Opportunity (Units), 2019 to 2032

            13.1.1.3. World Except for China Market YoY Growth

        13.1.2. Market Value Statistics

            13.1.2.1. World Except China Market Value (US$ Million), 2019 to 2032

            13.1.2.2. World Except China Market Incremental Dollar Opportunity (US$ Million), 2019 to 2032

            13.1.2.3. World Except for China Market YoY Growth

    13.2. World Expect China Market - Scenario-Based Forecast

    13.3. Market Size (US$ Million) and Volume (Units) Forecast By Market Taxonomy, 2022 to 2032

        13.3.1. By Country

            13.3.1.1. South Korea

            13.3.1.2. Taiwan

            13.3.1.3. India

            13.3.1.4. Rest of World

        13.3.2. By Functionality

        13.3.3. By Technology

        13.3.4. By Panel Size

        13.3.5. By Application

    13.4. Market Share Analysis

        13.4.1. By Country

        13.4.2. By Functionality

        13.4.3. By Technology

        13.4.4. By Panel Size

        13.4.5. By Application

    13.5. Market Growth Projections Analysis

        13.5.1. By Country

        13.5.2. By Functionality

        13.5.3. By Technology

        13.5.4. By Panel Size

        13.5.5. By Application

    13.6. Market Attractiveness Analysis

        13.6.1. By Country

        13.6.2. By Functionality

        13.6.3. By Technology

        13.6.4. By Panel Size

        13.6.5. By Application

14. Market in Key Countries Analysis

    14.1. China

        14.1.1. Key Findings

        14.1.2. China Market Value (US$ Billion) and Volume (Million Units) Forecast, 2019 to 2032

        14.1.3. China Market (%) Analysis 2022, By Functionality

        14.1.4. China Market (%) Analysis 2022, By Technology

        14.1.5. China Market (%) Analysis 2022, By Panel Size

        14.1.6. China Market (%) Analysis 2022, By Application

    14.2. South Korea

        14.2.1. Key Findings

        14.2.2. South Korea Market Value (US$ Billion) and Volume (Million Units) Forecast, 2019 to 2032

        14.2.3. South Korea Market (%) Analysis 2022, By Functionality

        14.2.4. South Korea Market (%) Analysis 2022, By Technology

        14.2.5. South Korea Market (%) Analysis 2022, By Panel Size

        14.2.6. South Korea Market (%) Analysis 2022, By Application

    14.3. Taiwan

        14.3.1. Key Findings

        14.3.2. Taiwan Market Value (US$ Billion) and Volume (Million Units) Forecast, 2019 to 2032

        14.3.3. Taiwan Market (%) Analysis 2022, By Functionality

        14.3.4. Taiwan Market (%) Analysis 2022, By Technology

        14.3.5. Taiwan Market (%) Analysis 2022, By Panel Size

        14.3.6. Taiwan Market (%) Analysis 2022, By Application

    14.4. India

        14.4.1. Key Findings

        14.4.2. India Market Value (US$ Billion) and Volume (Million Units) Forecast, 2019 to 2032

        14.4.3. India Market (%) Analysis 2022, By Functionality

        14.4.4. India Market (%) Analysis 2022, By Technology

        14.4.5. India Market (%) Analysis 2022, By Panel Size

        14.4.6. India Market (%) Analysis 2022, By Application

    14.5. Rest of World

        14.5.1. Key Findings

        14.5.2. Rest of World Market Value (US$ Billion) and Volume (Million Units) Forecast, 2019 to 2032

        14.5.3. Rest of World Market (%) Analysis 2022, By Functionality

        14.5.4. Rest of World Market (%) Analysis 2022, By Technology

        14.5.5. Rest of World Market (%) Analysis 2022, By Panel Size

        14.5.6. Rest of World Market (%) Analysis 2022, By Application

15. Market Structure Analysis

    15.1. Competition Dashboard

    15.2. Market Share Analysis of Top Players

    15.3. Market Unit Share Analysis

    15.4. Market Analysis by Tier of Companies (Flexible Screen)

16. Competition Analysis

    16.1. Manufacturers

        16.1.1. Samsung Display Co., Ltd.

            16.1.1.1. Overview

                16.1.1.1.1. Marketing Strategy

                16.1.1.1.2. Product Strategy

                16.1.1.1.3. Channel Strategy

        16.1.2. BOE Technology Group Co., Ltd.

            16.1.2.1. Overview

                16.1.2.1.1. Marketing Strategy

                16.1.2.1.2. Product Strategy

                16.1.2.1.3. Channel Strategy

        16.1.3. LG Display Co., Ltd.

            16.1.3.1. Overview

                16.1.3.1.1. Marketing Strategy

                16.1.3.1.2. Product Strategy

                16.1.3.1.3. Channel Strategy

        16.1.4. Shenzhen China Star Optoelectronics Technology Co., Ltd.

            16.1.4.1. Overview

                16.1.4.1.1. Marketing Strategy

                16.1.4.1.2. Product Strategy

                16.1.4.1.3. Channel Strategy

        16.1.5. Visionox Technology Inc

            16.1.5.1. Overview

                16.1.5.1.1. Marketing Strategy

                16.1.5.1.2. Product Strategy

                16.1.5.1.3. Channel Strategy

        16.1.6. AU Optronics Corp.

            16.1.6.1. Overview

                16.1.6.1.1. Marketing Strategy

                16.1.6.1.2. Product Strategy

                16.1.6.1.3. Channel Strategy

        16.1.7. Tianma Microelectronics Co., Ltd.

            16.1.7.1. Overview

                16.1.7.1.1. Marketing Strategy

                16.1.7.1.2. Product Strategy

                16.1.7.1.3. Channel Strategy

        16.1.8. E Ink Holdings Inc.

            16.1.8.1. Overview

                16.1.8.1.1. Marketing Strategy

                16.1.8.1.2. Product Strategy

                16.1.8.1.3. Channel Strategy

        16.1.9. Shenzhen Royole Technologies Co Ltd

            16.1.9.1. Overview

                16.1.9.1.1. Marketing Strategy

                16.1.9.1.2. Product Strategy

                16.1.9.1.3. Channel Strategy

        16.1.10. HannStar Display Corporation

            16.1.10.1. Overview

                16.1.10.1.1. Marketing Strategy

                16.1.10.1.2. Product Strategy

                16.1.10.1.3. Channel Strategy

        16.1.11. Everdisplay Optronics (Shanghai) Co., Ltd.

            16.1.11.1. Overview

                16.1.11.1.1. Marketing Strategy

                16.1.11.1.2. Product Strategy

                16.1.11.1.3. Channel Strategy

        16.1.12. Iljin Display Co Ltd

            16.1.12.1. Overview

                16.1.12.1.1. Marketing Strategy

                16.1.12.1.2. Product Strategy

                16.1.12.1.3. Channel Strategy

        16.1.13. Shenzhen RADIANT Technology Co., Ltd.

            16.1.13.1. Overview

                16.1.13.1.1. Marketing Strategy

                16.1.13.1.2. Product Strategy

                16.1.13.1.3. Channel Strategy

        16.1.14. Ösel Technology Pvt. Ltd.

            16.1.14.1. Overview

                16.1.14.1.1. Marketing Strategy

                16.1.14.1.2. Product Strategy

                16.1.14.1.3. Channel Strategy

    16.2. - Technology Providers and Material Manufacture

        16.2.1. Shenzhen China Star Optoelectronics Technology Co., Ltd.

        16.2.2. E.I. du Pont de Nemours & Company

        16.2.3. Universal Display Corporation

        16.2.4. FlexEnable Limited

17. Definitions of Analytical Frameworks

18. Sources and References

19. Appendix

Don't pay for what you don't need

Customize your report by selecting specific countries or regions and save 30%!

List of Tables

Table 01: Global Market Volume (Units) Forecast By Region, 2019 to 2032

Table 02: Global Market Value (US$ Million) Forecast By Region, 2019 to 2032

Table 03: Global Market Volume (Units) Forecast By Functionality, 2019 to 2032

Table 04: Global Market Value (US$ Million) Forecast By Functionality, 2019 to 2032

Table 05: Global Market Volume (Units) Forecast By Technology, 2019 to 2032

Table 06: Global Market Value (US$ Million) Forecast By Technology, 2019 to 2032

Table 07: Global Market Volume (Units) Forecast By Panel Size, 2019 to 2032

Table 08: Global Market Value (US$ Million) Forecast By Panel Size, 2019 to 2032

Table 09: Global Market Volume (Units) Forecast By Application, 2019 to 2032

Table 10: Global Market Value (US$ Million) Forecast By Application, 2019 to 2032

Table 11: China Market Volume (Units) Forecast By Functionality, 2019 to 2032

Table 12: China Market Value (US$ Million) Forecast By Functionality, 2019 to 2032

Table 13: China Market Volume (Units) Forecast By Technology, 2019 to 2032

Table 14: China Market Value (US$ Million) Forecast by Technology, 2019 to 2032

Table 15: China Market Volume (Units) Forecast By Panel Size, 2019 to 2032

Table 16: China Market Value (US$ Million) Forecast By Panel Size, 2019 to 2032

Table 17: China Market Volume (Units) Forecast By Application, 2019 to 2032

Table 18: China Market Value (US$ Million) Forecast by Application, 2019 to 2032

Table 19: World Except for China Market Volume (Units) Forecast By Country, 2019 to 2032

Table 20: World Except for China Market Value (US$ Million) Forecast by Country, 2019 to 2032

Table 21: World Except for China Market Volume (Units) Forecast By Functionality, 2019 to 2032

Table 22: World Except for China Market Value (US$ Million) Forecast By Functionality, 2019 to 2032

Table 23: World Except for China Market Volume (Units) Forecast By Technology, 2019 to 2032

Table 24: World Except for China Market Value (US$ Million) Forecast by Technology, 2019 to 2032

Table 25: World Except for China Market Volume (Units) Forecast By Panel Size, 2019 to 2032

Table 26: World Except for China Market Value (US$ Million) Forecast By Panel Size, 2019 to 2032

Table 27: World Except for China Market Volume (Units) Forecast By Application, 2019 to 2032

Table 28: World Except for China Market Value (US$ Million) Forecast by Application, 2019 to 2032
Sudip Saha
Sudip Saha

Principal Consultant

Talk to Analyst

Find your sweet spots for generating winning opportunities in this market.

List of Charts

Figure 01: Global Market Value (US$ Million) and Volume (Million Units) Analysis, 2019 to 2021

Figure 02: Global Market Value (US$ Billion) and Volume (Million Units) Forecast, 2022 to 2032

Figure 03: Global Market Value (US$ Million) and Volume (Million Units), 2019 to 2021

Figure 04: Global Market Absolute $ Opportunity (US$ Billion), 2021 to 2032

Figure 05: Global Market Value (US$ Million) and Volume (Million Units) Forecast, 2022 to 2032

Figure 06: Global Market Volume (Million Units), 2019 to 2032 

Figure 07: Global Market Incremental Demand Opportunity (Million Units), 2019 to 2032 

Figure 08: Global Market Value (US$ Billion), 2019 to 2032 

Figure 09: Global Market Incremental Dollar Opportunity (US$ Billion), 2019 to 2032 

Figure 10: Global Bendable and Foldable Display Market Volume (Million Units), 2019 to 2032

Figure 11: Global Rollable Display Market Volume (Units), 2019 to 2032 

Figure 12: Global Bendable and Foldable Display Market Value (US$ Million), 2019 to 2032

Figure 13: Global Rollable Display Market Value (US$ Million), 2019 to 2032

Figure 14: Global Market Share (%), by Functionality, 2022 & 2032

Figure 15: Global Market YoY GrowThousand Projections (%), by Functionality, 2019 to 2032

Figure 16: Global Market Attractiveness Index, by Functionality, 2019 to 2032 

Figure 17: Global OLED/FOLED Market Volume (Million Units), 2019 to 2032

Figure 18: Global AMOLED Market Volume (Million Units), 2019 to 2032 

Figure 19: Global POLED Market Volume (Million Units), 2019 to 2032 

Figure 20: Global EPD Market Volume (Million Units), 2019 to 2032 

Figure 21: Global OLED/FOLED Market Value (US$ Million), 2019 to 2032

Figure 22: Global AMOLED Market Value (US$ Million), 2019 to 2032 

Figure 23: Global POLED Market Value (US$ Million), 2019 to 2032 

Figure 24: Global EPD Market Value (US$ Million), 2019 to 2032 

Figure 25: Global Market Share (%), by Technology, 2022 & 2032

Figure 26: Global Market Attractiveness Index, by Technology, 2019 to 2032 

Figure 27: Global Market YoY GrowThousand Projections (%), By Technology 2019 to 2032

Figure 28: Global Up to 6’’ Market Volume (Thousand Units), 2019 to 2032

Figure 29: Global 6-20’’ Market Volume (Million Units), 2019 to 2032 

Figure 30: Global Above 20’’ Market Volume (Units), 2019 to 2032 

Figure 31: Global Up to 6’’ Market Value (US$ Million), 2019 to 2032

Figure 32: Global 6-20’’ Market Value (US$ Million), 2019 to 2032 

Figure 33: Global Above 20’’ Market Value (US$ Million), 2019 to 2032 

Figure 34: Global Market Share (%), by Panel Size, 2022 & 2032

Figure 35: Global Market YoY GrowThousand Projections (%), By Panel Size, 2019 to 2032

Figure 36: Global Market Attractiveness Index, By Panel Size 2019 to 2032 

Figure 37: Global Smartphones & Tablets Market Volume (Million Units), 2019 to 2032

Figure 38: Global Laptop Market Volume (Thousand Units), 2019 to 2032 

Figure 39: Global Smartwatches & Wearables Market Volume (Thousand Units), 2019 to 2032 

Figure 40: Global Television Market Volume (Units), 2019 to 2032

Figure 41: Global E-reader Market Volume (Thousand Units), 2019 to 2032 

Figure 42: Global Smartphones & Tablets Market Value (US$ Million), 2019 to 2032

Figure 43: Global Laptops Market Value (US$ Million), 2019 to 2032 

Figure 44: Global Smartwatches & Wearables Market Value (US$ Million), 2019 to 2032 

Figure 45: Global Television Market Value (US$ Million), 2019 to 2032

Figure 46: Global Market Value (US$ Million), 2019 to 2032 

Figure 47: Global Market Share (%), by Application, 2022 & 2032

Figure 48: Global Market Attractiveness Index, By Application 2019 to 2032 

Figure 49: Global Market YoY GrowThousand Projections (%), By Application, 2019 to 2032

Figure 50: Global Market Share (%), by Region, 2022 & 2032

Figure 51: Global Market YoY GrowThousand Projections (%), by Region 2019 to 2032

Figure 52: Global Market Attractiveness Index, By Region 2019 to 2032

Figure 53: China Market Volume (Thousand Units), 2019 to 2032

Figure 54: China Market Incremental Demand Opportunity (Thousand Units), 2019 to 2032

Figure 55: China Market Value (US$ Million), 2019 to 2032

Figure 56: China Market Incremental Dollar Opportunity (US$ Million), 2019 to 2032

Figure 57: China Bendable and Foldable Display Market Volume (Thousand Units), 2019 to 2032

Figure 58: China Rollable Display Market Volume (Units), 2019 to 2032

Figure 59: China Bendable and Foldable Display Market Value (US$ Million), 2019 to 2032

Figure 60: China Rollable Display Market Value (US$ Million), 2019 to 2032

Figure 61: China Market Share (%), by Functionality, 2022 & 2032

Figure 62: China Market YoY GrowThousand Projections (%), by Functionality, 2019 to 2032

Figure 63: China Market Attractiveness Index, by Functionality, 2019 to 2032

Figure 64: China OLED/FOLED Market Volume (Thousand Units), 2019 to 2032

Figure 65: China AMOLED Market Volume (Thousand Units), 2019 to 2032

Figure 66: China POLED Market Volume (Thousand Units), 2019 to 2032

Figure 67: China EPD Market Volume (Thousand Units), 2019 to 2032

Figure 68: China OLED/FOLED Market Value (US$ Million), 2019 to 2032

Figure 69: China AMOLED Market Value (US$ Million), 2019 to 2032

Figure 70: China POLED Market Value (US$ Million), 2019 to 2032

Figure 71: China EPD Market Value (US$ Million), 2019 to 2032

Figure 72: China Market Share (%), by Technology, 2022 & 2032

Figure 73: China Market Attractiveness Index, by Technology, 2019 to 2032

Figure 74: China Market YoY GrowThousand Projections (%), By Technology, 2019 to 2032

Figure 75: China Up to 6’’ Market Volume (Thousand Units), 2019 to 2032

Figure 76: China 6-20’’ Market Volume (Thousand Units), 2019 to 2032

Figure 77: China Above 20’’ Market Volume (Units), 2019 to 2032

Figure 78: China Up to 6’’ Market Value (US$ Million), 2019 to 2032

Figure 79: China 6-20’’ Market Value (US$ Million), 2019 to 2032

Figure 80: China Above 20’’ Market Value (US$ Million), 2019 to 2032

Figure 81: China Market Share (%), by Panel Size, 2022 & 2032

Figure 82: China Market YoY GrowThousand Projections (%), by Panel Size, 2019 to 2032

Figure 83: China Market Attractiveness Index, by Panel Size, 2019 to 2032

Figure 84: China Smartphones & Tablets Market Volume (Thousand Units), 2019 to 2032

Figure 85: China Laptop Market Volume (Thousand Units), 2019 to 2032

Figure 86: China Smartwatches & Wearables Market Volume (Thousand Units), 2019 to 2032

Figure 87: China Television Market Volume (Units), 2019 to 2032

Figure 88: China E-reader Market Volume (Thousand Units), 2019 to 2032

Figure 89: China Smartphones & Tablets Market Value (US$ Million), 2019 to 2032

Figure 90: China Laptops Market Value (US$ Million), 2019 to 2032

Figure 91: China Smartwatches & Wearables Market Value (US$ Million), 2019 to 2032

Figure 92: China Television Market Value (US$ Million), 2019 to 2032

Figure 93: China E-reader Market Value (US$ Million), 2019 to 2032

Figure 94: China Market Share (%), by Application, 2022 & 2032

Figure 95: China Market Attractiveness Index, by Application, 2019 to 2032

Figure 96: China Market YoY GrowThousand Projections (%), by Application, 2019 to 2032

Figure 97: World Except for China Market Volume (Thousand Units), 2019 to 2032

Figure 98: World Except for China Market Incremental Demand Opportunity (Thousand Units), 2019 to 2032

Figure 99: World Except for China Market Value (US$ Million), 2019 to 2032

Figure 100: World Except for China Market Incremental Dollar Opportunity (US$ Million), 2019 to 2032

Figure 101: SouThousand Korea Market Volume (Thousand Units), 2019 to 2032

Figure 102: Taiwan Market Volume (Thousand Units), 2019 to 2032

Figure 103: India Market Volume (Thousand Units), 2019 to 2032

Figure 104: Rest of World Market Volume (Thousand Units), 2019 to 2032

Figure 105: SouThousand Korea Market Value (US$ Million), 2019 to 2032

Figure 106: Taiwan Market Value (US$ Million), 2019 to 2032

Figure 107: India Market Value (US$ Million), 2019 to 2032

Figure 108: Rest of World Market Value (US$ Million), 2019 to 2032

Figure 109: World Except for China Market Share (%), by Country, 2022 & 2032

Figure 110: World Except for China Market YoY GrowThousand Projections (%), by Country, 2019 to 2032

Figure 111: World Except for China Market Attractiveness Index, by Country, 2019 to 2032

Figure 112: World Except for China Bendable and Foldable Display Market Volume (Million Units), 2019 to 2032

Figure 113: World Except for China Rollable Display Market Volume (Units), 2019 to 2032

Figure 114: World Except for China Bendable and Foldable Display Market Value (US$ Million), 2019 to 2032

Figure 115: World Except for China Rollable Display Market Value (US$ Million), 2019 to 2032

Figure 116: World Except for China Market Share (%), by Functionality, 2022 & 2032

Figure 117: World Except for China Market YoY GrowThousand Projections (%), by Functionality, 2019 to 2032

Figure 118: World Except for China Market Attractiveness Index, by Functionality, 2019 to 2032

Figure 119: World Except for China OLED/FOLED Market Volume (Thousand Units), 2019 to 2032

Figure 120: World Except for China AMOLED Market Volume (Thousand Units), 2019 to 2032

Figure 121: World Except for China POLED Market Volume (Thousand Units), 2019 to 2032

Figure 122: World Except for China EPD Market Volume (Thousand Units), 2019 to 2032

Figure 123: World Except for China OLED/FOLED Market Value (US$ Million), 2019 to 2032

Figure 124: World Except for China AMOLED Market Value (US$ Million), 2019 to 2032

Figure 125: World Except for China POLED Market Value (US$ Million), 2019 to 2032

Figure 126: World Except for China EDP Market Value (US$ Million), 2019 to 2032

Figure 127: World Except for China Market Share (%), by Technology, 2022 & 2032

Figure 128: World Except for China Market YoY GrowThousand Projections (%), by Technology,2019 to 2032

Figure 129: World Except for China Market Attractiveness Index, by Technology, 2019 to 2032

Figure 130: World Except for China Above 20’’ Market Volume (Units), 2019 to 2032

Figure 131: World Except for China 6-20’’ Market Volume (Thousand Units), 2019 to 2032

Figure 132: World Except for China Above 20’’ Market Value (US$ Million), 2019 to 2032

Figure 133: World Except for China 6-20’’ Market Value (US$ Million), 2019 to 2032

Figure 134: World Except for China Market Share (%), by Panel Size, 2022 & 2032

Figure 135: World Except for China Market YoY GrowThousand Projections (%), by Panel Size, 2019 to 2032

Figure 136: World Except for China Market Attractiveness Index, by Panel Size, 2019 to 2032

Figure 137: World Except for China Smartphones & Tablets Market Volume (Thousand Units), 2019 to 2032

Figure 138: World Except for China Television Market Volume (Units), 2019 to 2032

Figure 139: World Except for China E-readers Market Volume (Thousand Units), 2019 to 2032

Figure 140: World Except for China Smartphones & Tablets Market Value (US$ Million), 2019 to 2032

Figure 141: World Except for China Television Market Value (US$ Million), 2019 to 2032

Figure 142: World Except for China E-readers Market Value (US$ Million), 2019 to 2032

Figure 143: World Except for China Market Share (%), by Application, 2022 & 2032

Figure 144: World Except for China Market Attractiveness Index, by Application, 2019 to 2032

Figure 145: World Except for China Market YoY GrowThousand Projections (%), by Application, 2019 to 2032

Figure 146: China Market Value (US$ Billion) and Volume (Million Units) Forecast, 2019 to 2032

Figure 147: China Market Share (%), by Functionality, 2022

Figure 148: China Market Share (%), by Technology, 2022

Figure 149: China Market Share (%), by Panel Size, 2022

Figure 150: China Market Share (%), by Application, 2022

Figure 151: SouThousand Korea Market Value (US$ Billion) and Volume (‘000 Units) Forecast, 2019 to 2032

Figure 152: SouThousand Korea Market Share (%), by Functionality, 2022

Figure 153: SouThousand Korea Market Share (%), by Technology, 2022

Figure 154: SouThousand Korea Market Share (%), by Panel Size, 2022

Figure 155: SouThousand Korea Market Share (%), by Application, 2022

Figure 156: Taiwan Market Value (US$ Billion) and Volume (Million Units) Forecast, 2019 to 2032

Figure 157: Taiwan Market Share (%), by Functionality, 2022

Figure 158: Taiwan Market Share (%), by Technology, 2022

Figure 159: Taiwan Market Share (%), by Panel Size, 2022

Figure 160: Taiwan Market Share (%), by Application, 2022

Figure 161: India Market Value (US$ Billion) and Volume (Million Units) Forecast, 2019 to 2032

Figure 162: India Market Share (%), by Functionality, 2022

Figure 163: India Market Share (%), by Technology, 2022

Figure 164: India Market Share (%), by Panel Size, 2022

Figure 165: India Market Share (%), by Application, 2022

Figure 166: Rest of World Market Value (US$ Billion) and Volume (Million Units) Forecast, 2019 to 2032

Figure 167: Rest of World Market Value (US$ Billion) and Volume (Million Units) Forecast, 2019 to 2032

Figure 168: Rest of World Market Share (%), by Functionality, 2022 

Figure 169: Rest of World Market Share (%), by Technology, 2022 

Figure 170: Rest of World Market Share (%), by Panel Size, 2022 

Figure 171: Rest of World Market Share (%), by Application, 2022 

Recommendations

Technology

Digital Signage System Market

Published : October 2023

Technology

Display Panel Market

Published : July 2023

Technology

Tablet And e-Reader Application Processor Market

Published : December 2022

Technology

Flexible Barrier Films for Electronics Market

Published : November 2022

Explore Technology Insights

View Reports