The flexible plastic packaging industry is set for a decade-long expansion, growing from USD 267.5 billion in 2025 to USD 396 billion by 2035, reflecting a CAGR of 4%. The first half of the decade (2025-2030) will see the market rise from USD 267.5 billion to approximately USD 328.4 billion, adding USD 60.9 billion, or 46% of the total forecast growth. This phase will be marked by rapid adoption of multilayer film systems, driven by the increasing demand for advanced barrier solutions. Enhanced material capabilities and automated production systems are expected to become standard expectations across food processing, pharmaceutical, and consumer goods sectors.
In the latter half (2030-2035), the market will continue its upward trajectory, expanding from USD 328.4 billion to USD 396 billion, adding USD 70.3 billion, or 54% of the decade's growth. This period will be characterized by the widespread adoption of advanced coating technologies, integration with comprehensive packaging management platforms, and improved compatibility with existing production infrastructure. As barrier optimization and material management continue to evolve, market participants will benefit from the growing demand across various product types and application segments.
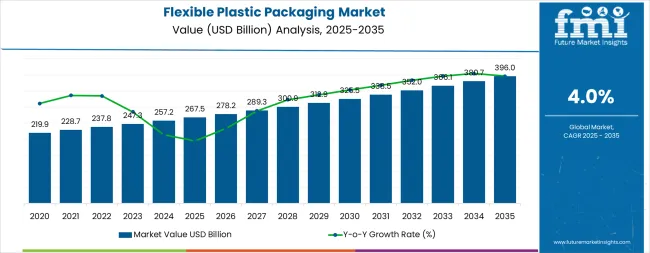
The flexible plastic packaging market demonstrates distinct growth phases with varying market characteristics and competitive dynamics. Between 2025 and 2030, the market progresses through its technology adoption phase, expanding from USD 267.5 billion to USD 328.4 billion with steady annual increments averaging 4.0% growth. This period showcases the transition from basic packaging materials to advanced multilayer film systems with enhanced barrier capabilities and integrated production systems becoming mainstream features.
The 2025-2030 phase adds USD 60.9 billion to market value, representing 46% of total decade expansion. Market maturation factors include standardization of packaging protocols, declining component costs for specialized equipment, and increasing industrial awareness of flexible packaging benefits reaching 95-97% operational effectiveness in barrier applications. Competitive landscape evolution during this period features established packaging companies like Amcor plc and Berry Global Inc. expanding their flexible packaging portfolios while specialty manufacturers focus on advanced technology development and enhanced barrier capabilities.
From 2030 to 2035, market dynamics shift toward advanced material integration and global packaging expansion, with growth continuing from USD 328.4 billion to USD 396 billion, adding USD 70.3 billion or 54% of total expansion. This phase transition centers on composite material systems, integration with automated monitoring networks, and deployment across diverse packaging and industrial scenarios, becoming standard rather than specialized applications. The competitive environment matures with focus shifting from basic barrier capability to comprehensive material optimization systems and integration with packaging monitoring platforms.
| Metric | Value |
|---|---|
| Market Value (2025) | USD 267.5 billion |
| Market Forecast (2035) | USD 396 billion |
| Growth Rate | 4% CAGR |
| Leading Technology | Pouches Type |
| Primary Application | Food & Beverage Segment |
The market demonstrates strong fundamentals with pouch systems capturing a dominant share through advanced convenience features and material optimization. Food & beverage applications drive primary demand, supported by increasing packaging development and consumer preference requirements. Geographic expansion remains concentrated in developed markets with established packaging infrastructure, while emerging economies show accelerating adoption rates driven by urbanization initiatives and rising consumption standards.
Market expansion rests on three fundamental shifts driving adoption across the packaging and consumer goods sectors.
1. Convenience mandates create compelling consumer advantages through flexible plastic packaging that provides immediate product access without material degradation, enabling brands to meet consumer expectations while maintaining product freshness and reducing transportation costs.
2. Packaging modernization accelerates as facilities worldwide seek advanced materials that complement traditional rigid packaging methods, enabling precise barrier control and extended shelf life that align with food safety regulations and operational efficiency standards.
3. Cost optimization drives adoption from food processing facilities and consumer goods operations requiring effective packaging solutions that minimize material usage while maintaining operational productivity during packaging and distribution operations.
However, growth faces headwinds from environmental concerns that vary across regions regarding the disposal of plastic packaging materials and the development of recycling infrastructure, which may limit adoption in environmentally conscious markets. Technical limitations also persist regarding material capabilities and operational conditions that may reduce effectiveness in extreme temperature or challenging storage environments, which affect barrier performance and material consistency.
Primary Classification: The market segments by product type into pouches, bags, films & wraps, and lidding films, representing the evolution from basic packaging materials to specialized barrier solutions for comprehensive packaging optimization.
Secondary Classification: Application segmentation divides the market into food & beverage, pharmaceutical & healthcare, personal care & cosmetics, and industrial & other sectors, reflecting distinct requirements for operational performance, barrier compliance, and material efficiency standards.
Regional Classification: Geographic distribution covers North America, Latin America, Western Europe, Eastern Europe, East Asia, South Asia Pacific, and Middle East & Africa, with developed markets leading adoption while emerging economies show accelerating growth patterns driven by packaging expansion programs.
The segmentation structure reveals technology progression from standard packaging materials toward specialized barrier systems with enhanced performance and automation capabilities, while application diversity spans from food facilities to pharmaceutical operations requiring precise moisture and oxygen control solutions.
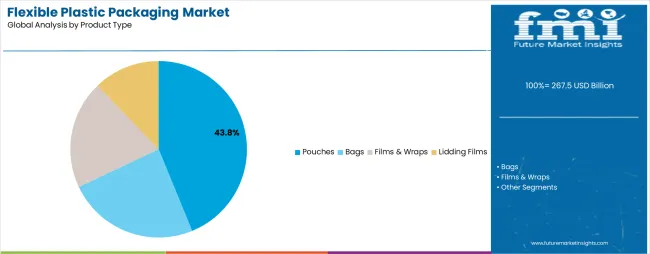
Market Position: Pouch systems command the leading position in the flexible plastic packaging market with 43.8% share and 4.5% CAGR through advanced convenience features, including superior barrier protection, operational flexibility, and material optimization that enable brands to achieve optimal product preservation across diverse food and consumer goods environments.
Value Drivers: The segment benefits from consumer preference for convenient packaging systems that provide easy opening, reclosability, and portion control without requiring significant lifestyle modifications. Advanced zipper features enable stand-up functionality, barrier consistency, and integration with existing retail infrastructure, where convenience and material efficiency represent critical consumer requirements.
Competitive Advantages: Pouch systems differentiate through proven operational stability, consistent barrier characteristics, and integration with automated filling systems that enhance production effectiveness while maintaining optimal quality standards for diverse food and beverage applications.
Key market characteristics:
Bags systems maintain a 28.5% market share in the flexible plastic packaging market due to their versatile properties and operational advantages. These systems appeal to facilities requiring reliable packaging characteristics with competitive pricing for standard food and industrial applications. Market growth is driven by industrial expansion, emphasizing economical packaging solutions and operational efficiency through optimized material designs.
Films & Wraps capture 19.2% market share through versatile packaging requirements in food wrapping facilities, industrial applications, and protective packaging operations. These facilities demand flexible material systems capable of operating in diverse environments while providing effective barrier protection and operational efficiency.
Lidding Films account for 8.5% market share through specialized sealing requirements in food tray operations, pharmaceutical blister packs, and container closure applications requiring hermetic seal capabilities for operational performance and product protection.
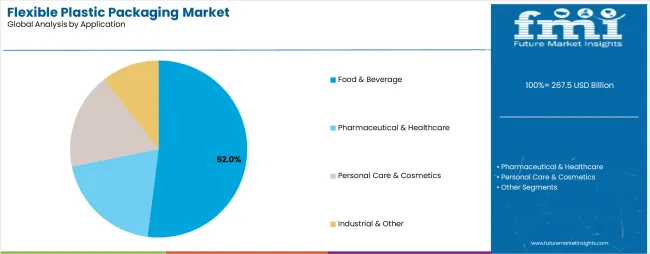
Market Context: Food & Beverage applications demonstrate market leadership in the flexible plastic packaging market with 52.0% share and 4.2% CAGR due to widespread adoption of flexible packaging systems and increasing focus on food preservation, extended shelf life, and packaging modernization applications that maximize freshness while maintaining regulatory standards.
Appeal Factors: Food & beverage operators prioritize material reliability, barrier optimization, and integration with existing production infrastructure that enables coordinated freshness control across multiple packaging operations. The segment benefits from substantial consumer goods investment and modernization programs that emphasize the acquisition of flexible packaging systems for quality control and extended shelf life applications.
Growth Drivers: Consumer convenience trends incorporate flexible packaging applications as standard materials for food operations, while food processing facility growth increases demand for reliable barrier capabilities that comply with regulatory standards and minimize waste complexity.
Market Challenges: Varying food safety technology standards and packaging infrastructure differences may limit material standardization across different facilities or operational scenarios.
Application dynamics include:
Pharmaceutical & Healthcare applications capture 21.7% market share through stringent sterility requirements in drug packaging facilities, medical device operations, and healthcare applications. These facilities demand premium barrier systems capable of operating in controlled environments while providing effective moisture protection and contamination prevention capabilities.
Personal Care & Cosmetics applications account for 16.4% market share, including beauty product packaging, toiletry operations, and consumer goods applications requiring attractive packaging for operational optimization and product appeal.
Industrial & Other applications account for 9.6% market share, including general manufacturing operations, component protection, and specialty applications requiring barrier capabilities for operational optimization and product preservation.
Growth Accelerators: Consumer convenience development drives primary adoption as flexible plastic packaging provides ease-of-use capabilities that enable brands to meet consumer expectations without excessive material usage, supporting food processing and consumer goods missions that require extended shelf life applications. Packaging demand accelerates market expansion as facilities seek effective systems that minimize transportation costs while maintaining operational effectiveness during storage and distribution scenarios. Cost optimization spending increases worldwide, creating continued demand for flexible packaging systems that complement traditional rigid packaging methods and provide material efficiency in complex consumer goods environments.
Growth Inhibitors: Environmental concerns vary across regions regarding the disposal of plastic packaging materials and recycling infrastructure development, which may limit operational flexibility and market penetration in areas with strict environmental regulations or waste management challenges. Technical performance limitations persist regarding material capabilities and operational conditions that may reduce effectiveness in extreme temperature, challenging environments, or storage conditions, affecting barrier performance and material consistency. Market fragmentation across multiple packaging specifications and quality standards creates compatibility concerns between different material suppliers and existing packaging infrastructure.
Market Evolution Patterns: Adoption accelerates in food and pharmaceutical sectors where quality requirements justify flexible packaging system costs, with geographic concentration in developed markets transitioning toward mainstream adoption in emerging economies driven by urbanization initiatives and consumption development. Technology development focuses on enhanced barrier capabilities, improved oxygen resistance, and integration with automated monitoring systems that optimize material performance and packaging effectiveness. The market could face disruption if alternative packaging technologies or environmental regulations significantly limit the deployment of traditional plastic materials in food or consumer goods applications.
The flexible plastic packaging market demonstrates varied regional dynamics with Growth Leaders including India (4.8% growth rate) and China (4.5% growth rate) driving expansion through urbanization initiatives and consumption development. Steady Performers encompass United States (3.8% growth rate), Germany (3.6% growth rate), and Japan (3.4% growth rate), benefiting from established packaging sectors and advanced flexible packaging adoption. Emerging Markets feature developing regions where packaging initiatives and consumption modernization support consistent growth patterns.
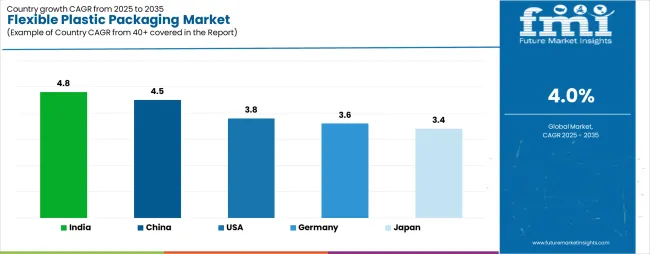
| Country | CAGR (2025-2035) |
|---|---|
| India | 4.8% |
| China | 4.5% |
| United States | 3.8% |
| Germany | 3.6% |
| Japan | 3.4% |
Regional synthesis reveals East Asian markets leading adoption through consumption expansion and urbanization development, while South Asian countries maintain steady expansion supported by food processing technology advancement and retail standardization requirements. North American markets show moderate growth driven by convenience applications and material integration trends.
India establishes fastest market growth through aggressive urbanization programs and comprehensive consumer goods development, integrating advanced flexible plastic packaging as standard materials in food processing and retail installations. The country's 4.8% growth rate reflects government initiatives promoting manufacturing technology and domestic packaging capabilities that mandate the use of advanced barrier systems in food and consumer goods facilities. Growth concentrates in major urban centers, including Mumbai, Delhi, and Bangalore, where retail technology development showcases integrated flexible packaging systems that appeal to food operators seeking advanced facility optimization capabilities and quality management applications.
Indian manufacturers are developing cost-effective flexible packaging solutions that combine domestic production advantages with advanced barrier features, including automated production systems and enhanced freshness protection capabilities. Distribution channels through retail suppliers and material distributors expand market access, while government support for food processing development supports adoption across diverse food and consumer goods segments.
Strategic Market Indicators:
In Beijing, Shanghai, and Shenzhen, food processing facilities and consumer goods manufacturers are implementing advanced flexible plastic packaging as standard materials for barrier optimization and convenience applications, driven by increasing consumer demand and packaging modernization programs that emphasize the importance of freshness control capabilities. The market holds a 4.5% growth rate, supported by government manufacturing initiatives and food processing infrastructure development programs that promote advanced flexible packaging systems for food and consumer goods facilities. Chinese operators are adopting flexible packaging systems that provide consistent operational performance and convenience features, particularly appealing in urban regions where product freshness and convenience represent critical consumer requirements.
Market expansion benefits from growing packaging technology manufacturing capabilities and international technology transfer agreements that enable domestic production of advanced flexible packaging systems for food and consumer goods applications. Technology adoption follows patterns established in packaging equipment, where convenience and quality drive procurement decisions and operational deployment.
Market Intelligence Brief:
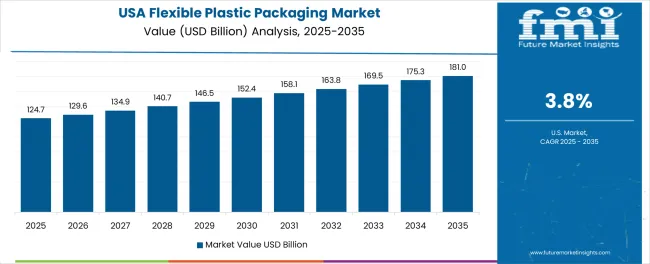
United States establishes market leadership through comprehensive consumer goods programs and advanced packaging infrastructure development, integrating flexible plastic packaging across food and retail applications. The country's 3.8% growth rate reflects established packaging relationships and mature flexible packaging technology adoption that supports widespread use of barrier systems in food processing and consumer goods facilities. Growth concentrates in major urban centers, including California, Texas, and New York, where packaging technology showcases mature flexible packaging deployment that appeals to food operators seeking proven barrier capabilities and operational efficiency applications.
American flexible packaging providers leverage established distribution networks and comprehensive service capabilities, including technical programs and quality support that create customer relationships and operational advantages. The market benefits from mature food safety regulations and packaging standards that mandate flexible packaging use while supporting technology advancement and operational optimization.
Market Intelligence Brief:
Germany establishes technology leadership through comprehensive packaging programs and advanced manufacturing infrastructure development, integrating flexible plastic packaging across food and pharmaceutical applications. The country's 3.6% growth rate reflects established packaging relationships and mature flexible packaging technology adoption that supports widespread use of barrier systems in food processing and pharmaceutical facilities. Growth concentrates in major industrial centers, including Bavaria, North Rhine-Westphalia, and Baden-Württemberg, where packaging technology showcases mature flexible packaging deployment that appeals to food operators seeking proven barrier capabilities and operational efficiency applications.
German flexible packaging providers leverage established distribution networks and comprehensive service capabilities, including quality programs and technical support that create customer relationships and operational advantages. The market benefits from mature food safety regulations and packaging standards that mandate flexible packaging use while supporting technology advancement and operational optimization.
Market Intelligence Brief:
Japan's market growth reflects precision manufacturing culture and stringent quality standards, with flexible plastic packaging adoption concentrated in pharmaceutical packaging and premium food applications. The country's 3.4% growth rate benefits from established packaging technology infrastructure and mature quality control systems that prioritize material consistency and barrier performance. Japanese operators emphasize miniaturization, stability under controlled conditions, and compatibility with automated packaging platforms, where operational precision represents non-negotiable requirements.
Market characteristics include high reliance on multilayer films for pharmaceutical applications, integration with quality monitoring systems, and focus on material uniformity and long-term barrier stability. Demand concentrates in Tokyo, Osaka, and Nagoya, where pharmaceutical facilities and premium food packaging operations implement advanced flexible packaging systems for contamination prevention and quality assurance.
Strategic Market Considerations:
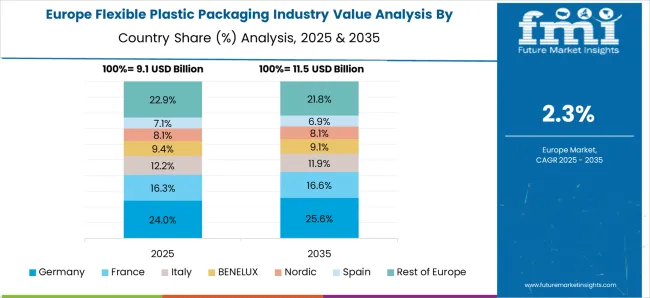
The European flexible plastic packaging market is projected to grow from USD 62.3 billion in 2025 to USD 88.5 billion by 2035, registering a CAGR of 3.6% over the forecast period. Germany is expected to maintain its leadership position with a 27.8% market share in 2025, supported by its advanced packaging technology infrastructure and major food processing centers.
France follows with a 22.4% share in 2025, driven by comprehensive consumer goods programs and retail packaging development initiatives. United Kingdom holds a 18.6% share through specialized packaging applications and convenience requirements. Italy commands a 15.7% share, while Spain accounts for 11.2% in 2025. The rest of Europe region is anticipated to gain momentum, expanding its collective share from 4.3% to 4.8% by 2035, attributed to increasing packaging adoption in Nordic countries and emerging food processing facilities implementing modernization programs.
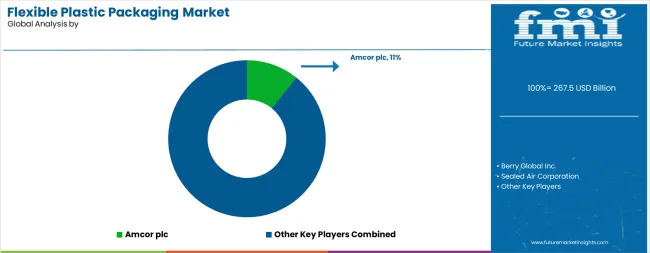
The flexible plastic packaging market operates with moderate concentration, featuring approximately 35-45 meaningful participants, where leading companies control roughly 38-42% of the global market share through established packaging relationships and comprehensive flexible packaging portfolios. Competition emphasizes advanced barrier capabilities, material reliability, and production integration rather than price-based rivalry.
Market Leaders encompass Amcor plc, Berry Global Inc., and Sealed Air Corporation, which maintain competitive advantages through extensive packaging technology expertise, global distributor networks, and comprehensive material integration capabilities that create customer switching costs and support premium pricing. These companies leverage decades of flexible packaging technology experience and ongoing research investments to develop advanced barrier systems with precision moisture control and quality monitoring features.
Technology Innovators include Constantia Flexibles Group GmbH, Huhtamaki Oyj, and Mondi Group, which compete through specialized flexible packaging technology focus and innovative material interfaces that appeal to food operators seeking advanced barrier capabilities and operational flexibility. These companies differentiate through rapid technology development cycles and specialized food application focus.
Regional Specialists feature companies like Coveris Holdings SA, Sonoco Products Company, and Uflex Limited, which focus on specific geographic markets and specialized applications, including specialty barriers and integrated packaging solutions. Market dynamics favor participants that combine reliable barrier capabilities with advanced production software, including precision freshness control and automatic quality optimization capabilities. Competitive pressure intensifies as traditional packaging manufacturers expand into flexible systems, while specialized material companies challenge established players through innovative barrier solutions and cost-effective materials targeting specialized food processing segments.
| Item | Value |
|---|---|
| Quantitative Units | USD 267.5 billion |
| Product Type | Pouches, Bags, Films & Wraps, Lidding Films |
| Application | Food & Beverage, Pharmaceutical & Healthcare, Personal Care & Cosmetics, Industrial & Other |
| Regions Covered | North America, Latin America, Western Europe, Eastern Europe, East Asia, South Asia Pacific, Middle East & Africa |
| Countries Covered | United States, China, Germany, India, United Kingdom, Japan, France, Canada, Brazil, Australia, and 25+ additional countries |
| Key Companies Profiled | Amcor plc, Berry Global Inc., Sealed Air Corporation, Constantia Flexibles Group GmbH, Huhtamaki Oyj, Mondi Group, Coveris Holdings SA, Sonoco Products Company |
| Additional Attributes | Dollar sales by product type and application categories, regional adoption trends across East Asia, South Asia Pacific, and North America, competitive landscape with packaging manufacturers and technical material suppliers, food operator preferences for precision freshness control and material reliability, integration with packaging platforms and quality monitoring systems, innovations in flexible packaging technology and barrier enhancement, and development of automated production solutions with enhanced performance and packaging optimization capabilities. |
Region:
The global flexible plastic packaging market is estimated to be valued at USD 267.5 billion in 2025.
The market size for the flexible plastic packaging market is projected to reach USD 396.0 billion by 2035.
The flexible plastic packaging market is expected to grow at a 4.0% CAGR between 2025 and 2035.
The key product types in flexible plastic packaging market are pouches, bags, films & wraps and lidding films.
In terms of application, food & beverage segment to command 52.0% share in the flexible plastic packaging market in 2025.


Full Research Suite comprises of:
Market outlook & trends analysis
Interviews & case studies
Strategic recommendations
Vendor profiles & capabilities analysis
5-year forecasts
8 regions and 60+ country-level data splits
Market segment data splits
12 months of continuous data updates
DELIVERED AS:
PDF EXCEL ONLINE
Flexible Plastic Packaging Industry Analysis in United States Size and Share Forecast Outlook 2025 to 2035
Market Share Distribution Among Flexible Plastic Packaging Manufacturers
USA Flexible Plastic Packaging Market Insights – Trends, Demand & Growth 2025-2035
ASEAN Flexible Plastic Packaging Market Analysis - Size, Share, and Forecast Outlook 2025 to 2035
Japan Flexible Plastic Packaging Market Report – Demand, Trends & Industry Forecast 2025-2035
Europe Flexible Plastic Packaging Market Analysis by Material, Product Type, End Use, Packaging Type, and Region Forecast Through 2035
Competitive Breakdown of Europe Flexible Plastic Packaging Providers
Germany Flexible Plastic Packaging Market Outlook – Size, Trends & Forecast 2025-2035
Flexible Rubber Sheets Market Size and Share Forecast Outlook 2025 to 2035
Flexible Printed Circuit Boards Market Size and Share Forecast Outlook 2025 to 2035
Flexible Electronic Market Size and Share Forecast Outlook 2025 to 2035
Flexible Foam Market Size and Share Forecast Outlook 2025 to 2035
Flexible AC Current Transmission System Market Size and Share Forecast Outlook 2025 to 2035
Flexible End-Load Cartoner Market Size and Share Forecast Outlook 2025 to 2035
Flexible Screens Market Size and Share Forecast Outlook 2025 to 2035
Flexible Metallic Conduit Market Size and Share Forecast Outlook 2025 to 2035
Flexible Electrical Conduit Market Size and Share Forecast Outlook 2025 to 2035
Flexible Display Market Size and Share Forecast Outlook 2025 to 2035
Flexible Substrate Market Size and Share Forecast Outlook 2025 to 2035
Flexible Paper Battery Market Size and Share Forecast Outlook 2025 to 2035

Thank you!
You will receive an email from our Business Development Manager. Please be sure to check your SPAM/JUNK folder too.
Chat With
MaRIA