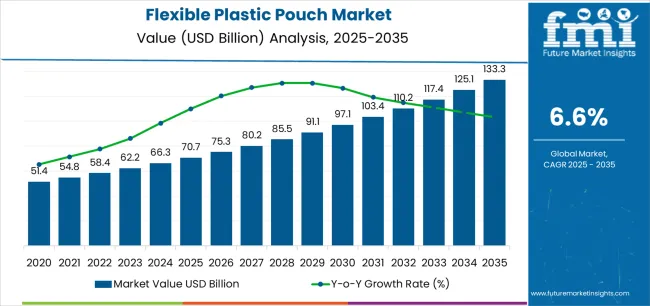
The Flexible Plastic Pouch Market is estimated to be valued at USD 70.7 billion in 2025 and is projected to reach USD 133.3 billion by 2035, registering a compound annual growth rate (CAGR) of 6.6% over the forecast period.
The flexible plastic pouch market is witnessing significant expansion, propelled by the rising demand for lightweight, durable, and cost-efficient packaging solutions across diverse industries. The market’s growth is supported by increasing consumer preference for convenience packaging that offers portability, resealability, and extended shelf life. Technological advancements in multilayer film structures and barrier coatings have enhanced the functional properties of flexible pouches, ensuring superior protection against moisture, oxygen, and contamination.
The food and beverage sector continues to drive major consumption, supported by the shift toward flexible packaging formats for ready-to-eat meals, snacks, and beverages. Sustainability trends have also influenced market dynamics, encouraging the adoption of recyclable and bio-based plastics to meet environmental compliance standards.
The growing use of digital printing for brand differentiation and reduced material wastage further contributes to market growth. Looking ahead, the sector is poised for steady expansion due to increasing demand for high-performance, eco-efficient packaging across retail and industrial supply chains.

| Metric | Value |
|---|---|
| Flexible Plastic Pouch Market Estimated Value in (2025 E) | USD 70.7 billion |
| Flexible Plastic Pouch Market Forecast Value in (2035 F) | USD 133.3 billion |
| Forecast CAGR (2025 to 2035) | 6.6% |
The market is segmented by Type and End Use and region. By Type, the market is divided into Bags And Pouches, Wraps And Rolls, Boxes And Cartons, Sachets And Envelopes, and Others. In terms of End Use, the market is classified into Food And Beverage, Retail And Consumer Goods, Pharmaceuticals And Healthcare, Personal Care, ECommerce, and Others. Regionally, the market is classified into North America, Latin America, Western Europe, Eastern Europe, Balkan & Baltic Countries, Russia & Belarus, Central Asia, East Asia, South Asia & Pacific, and the Middle East & Africa.

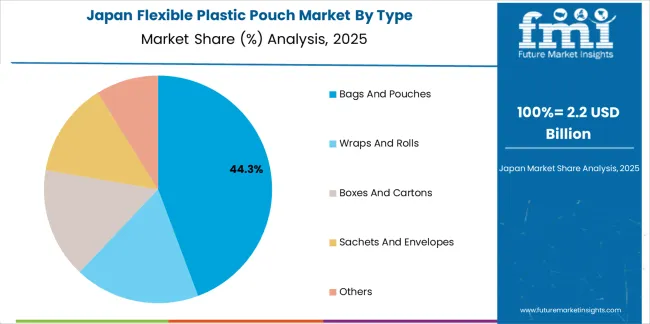
The bags and pouches segment leads the type category with approximately 43.8% share, driven by its versatility, lightweight nature, and adaptability across various packaging needs. This segment has benefited from the growing popularity of single-serve and on-the-go consumption formats, particularly within the food, beverage, and personal care sectors.
Its cost-effectiveness in production and transportation has made it the preferred alternative to rigid packaging solutions. The segment’s prominence is further strengthened by advances in film technology that enhance durability, puncture resistance, and printability for improved shelf appeal.
The rising integration of spouts, zippers, and resealable closures has enhanced consumer convenience, increasing product adoption across both retail and e-commerce channels. With growing emphasis on material efficiency and product differentiation, the bags and pouches segment is expected to sustain its leading position in the market throughout the forecast period.

The food and beverage segment dominates the end-use category with approximately 52.4% share, underscoring its central role in driving flexible plastic pouch demand. This segment’s leadership is attributed to the growing consumption of packaged foods, dairy products, sauces, and beverages that require safe, durable, and visually appealing packaging solutions.
Flexible pouches offer extended product freshness, reduced packaging weight, and improved sustainability compared to traditional rigid formats. The segment also benefits from the increasing use of vacuum and retort pouches for perishable and heat-processed food products.
Manufacturers in the food and beverage industry are adopting innovative pouch designs with enhanced barrier properties to maintain flavor integrity and product safety. With changing consumer lifestyles and the global rise of convenience-driven purchasing behavior, the food and beverage segment is projected to remain the dominant end-use category, reinforcing its substantial share in the flexible plastic pouch market.
On-the-go Lifestyle Spurs Surge in Flexible Plastic Pouches! Growing consumer desire for lightweight and easy packaging options that fit their increasingly hectic lifestyles is driving the flexible plastic pouch market.
Flexible Pouches Lead the Charge in Environmental Innovation! Sustainability concerns are pushing companies to adopt recyclable and eco-friendly materials, further fueling the demand for flexible plastic pouches.
Innovative Bioplastic Pouches Gain Traction with Government Backing! Flexible plastic pouches with enhanced safety features and recyclability are becoming a growing trend due to regulatory regulations and standards that push for safer and more sustainable pouch packaging solutions.
Flexible Plastic Pouches Redefine eCommerce Packaging! The rise of retail channels and eCommerce, which require space-saving and long-lasting packaging solutions for shipment and storage, is further driving the flexible plastic pouch market.
Flexible Packaging Booms with Technological Advancements! Flexible packaging is becoming increasingly desirable for multiple products due to improvements in barrier qualities and shelf life brought about by technological advancements.
Within the flexible plastic packaging market, pouches are one of the fastest-growing areas. On the other hand, strict laws governing flexible plastic packaging can limit the market. Adherence to laws is crucial, as even the slightest flaw in packing has the potential to taint the product and impact the makers' revenues.
Food and beverage, personal care, and healthcare product packaging have to have certain qualities, such as being light- and moisture-resistant and being portable. The United States Environmental Protection Agency (EPA), the European Commission, and the Food and Drug Administration (FDA) are among the regulatory authorities that oversee flexible plastic packaging.
In the packaging business, rigid containers and poly bags are used as pouch alternatives. The food and beverage, personal care, and pharmaceutical sectors all use rigid containers, which include bottles, jars, cans, and containers.
Rigid containers are quite popular in many sectors because of their great robustness, impact strength, and barrier qualities. This could pose a serious challenge to pouch packaging market expansion.
From 2020 to 2025, the flexible plastic pouch market showed promising growth, boasting an 8.0% CAGR. During this time, advancements in packaging technology and shifting consumer preferences towards convenience and sustainability fueled the surge in demand for flexible plastic pouches.
| Historical CAGR (2020 to 2025) | 8.0% |
|---|---|
| Forecasted CAGR (2025 to 2035) | 6.9% |
The market for flexible plastic pouches is expected to exhibit a lower CAGR compared to the historical period.
Despite the anticipated decrease in growth rate, the flexible plastic pouches market global forecast anticipates robust progression driven by expanding industrial pouch applications in the market across healthcare, personal care, and pet food fields, which are poised to fuel demand.
Despite the decreased CAGR, manufacturers are likely to continue to innovate to fulfill the more stringent restrictions put on them by regulatory agencies around waste management and packaging materials.
Pouches for packaging alcohol have become increasingly common recently. The growing popularity of pouches in alcohol packaging can be attributed to their cost-effectiveness, flexibility, small size, and ability to retain flavor and quality. They also provide aesthetic appeal.
Pouches possess contamination and oxygen barrier qualities, which are essential for maintaining the product's freshness for longer. At the moment, wine, spirits, and beer are packaged extensively in flexible plastic pouches.
South Africa, Australia, and the United States are the main markets for this type of alcohol packaging. This is expected to have a highly positive impact on the global demand for flexible plastic pouches.
The North America flexible plastic pouch market stands out as a dominant force. The exponential rise in eCommerce and online shopping in recent times has fueled the flexible plastic pouch packaging market expansion.
Europe flexible plastic packaging industry is witnessing continuous and steady growth in demand for flexible plastic pouches. Despite the region's stricter position on plastic consumption, Europe continues to be one of the top consumers of plastic packaging, particularly flexible plastic packaging.
The Asia Pacific flexible plastic pouch industry is likely to progress significantly. Two key factors anticipated to drive the market are the large-scale availability of raw materials and the rapid advancement of flexible plastic packaging technology.
| Country | United States |
|---|---|
| Forecasted CAGR (2025 to 2035) | 7.1% |
| Market Size by 2035 | USD 22.9 billion |
| Country | United Kingdom |
|---|---|
| Forecasted CAGR (2025 to 2035) | 7.8% |
| Market Size by 2035 | USD 5.1 billion |
| Country | China |
|---|---|
| Forecasted CAGR (2025 to 2035) | 7.7% |
| Market Size by 2035 | USD 20.2 billion |
| Country | Japan |
|---|---|
| Forecasted CAGR (2025 to 2035) | 8.1% |
| Market Size by 2035 | USD 13.9 billion |
| Country | South Korea |
|---|---|
| Forecasted CAGR (2025 to 2035) | 8.2% |
| Market Size by 2035 | USD 7.8 billion |
Demand for flexible plastic pouches in the United States is set to rise with an anticipated CAGR of 7.1% through 2035. Key factors influencing these pouches’ demand include:
The United Kingdom flexible plastic pouch market is expected to surge at a CAGR of 7.8% through 2035. The topmost dynamic forces supporting the market extension in the country include:
The China flexible plastic pouch market is forecasted to inflate at a CAGR of 7.7% through 2035. Prominent factors backing up the market growth are:

Sales of flexible plastic pouches in Japan are estimated to record a CAGR of 8.1% through 2035. The primary factors bolstering the flexible pouch market size are:

The market in South Korea is likely to exhibit a CAGR of 8.2% through 2035. Reasons supporting the growth of flexible plastic pouch market in the country include:
As far as the type of flexible plastic pouch is concerned, the bags and pouches segment is likely to dominate through 2035, registering a CAGR of 6.6%.
Similarly, the food and beverage segment is expected to dominate the revenue share of flexible plastic pouches in terms of end use, with a projected CAGR of 6.5% through 2035.
| Segment | Forecasted CAGR (2025 to 2035) |
|---|---|
| Bags and Pouches | 6.6% |
| Food and Beverage | 6.5% |
The bags and pouches segment is anticipated to lead the way, holding an impressive flexible plastic pouch market share. Here are a few key factors that contribute to its acceptance:
The food and beverage end-use industry takes the top spot in the flexible plastic pouch industry, a trend substantiated by factors such as:

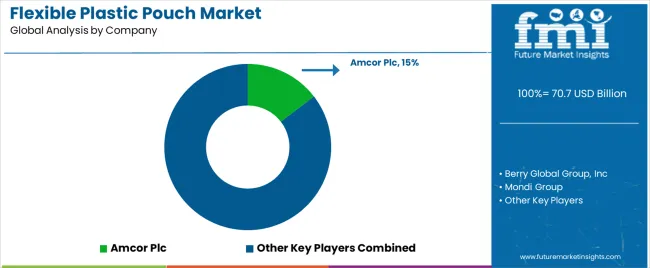
Flexible plastic pouch market players employ diverse strategies to gain a competitive edge. Some concentrate on product innovation, launching eco-friendly or more practical pouches.
Others prioritize cost leadership by providing competitive prices to draw in consumers who are cost-conscious. In order to increase their market share, businesses are also utilizing digital platforms and broadening their global reach in their marketing and distribution methods.
Recent Developments
The global flexible plastic pouch market is estimated to be valued at USD 70.7 billion in 2025.
The market size for the flexible plastic pouch market is projected to reach USD 133.3 billion by 2035.
The flexible plastic pouch market is expected to grow at a 6.6% CAGR between 2025 and 2035.
The key product types in flexible plastic pouch market are bags and pouches, wraps and rolls, boxes and cartons, sachets and envelopes and others.
In terms of end use, food and beverage segment to command 52.4% share in the flexible plastic pouch market in 2025.


Our Research Products

The "Full Research Suite" delivers actionable market intel, deep dives on markets or technologies, so clients act faster, cut risk, and unlock growth.

The Leaderboard benchmarks and ranks top vendors, classifying them as Established Leaders, Leading Challengers, or Disruptors & Challengers.

Locates where complements amplify value and substitutes erode it, forecasting net impact by horizon

We deliver granular, decision-grade intel: market sizing, 5-year forecasts, pricing, adoption, usage, revenue, and operational KPIs—plus competitor tracking, regulation, and value chains—across 60 countries broadly.

Spot the shifts before they hit your P&L. We track inflection points, adoption curves, pricing moves, and ecosystem plays to show where demand is heading, why it is changing, and what to do next across high-growth markets and disruptive tech

Real-time reads of user behavior. We track shifting priorities, perceptions of today’s and next-gen services, and provider experience, then pace how fast tech moves from trial to adoption, blending buyer, consumer, and channel inputs with social signals (#WhySwitch, #UX).

Partner with our analyst team to build a custom report designed around your business priorities. From analysing market trends to assessing competitors or crafting bespoke datasets, we tailor insights to your needs.
Supplier Intelligence
Discovery & Profiling
Capacity & Footprint
Performance & Risk
Compliance & Governance
Commercial Readiness
Who Supplies Whom
Scorecards & Shortlists
Playbooks & Docs
Category Intelligence
Definition & Scope
Demand & Use Cases
Cost Drivers
Market Structure
Supply Chain Map
Trade & Policy
Operating Norms
Deliverables
Buyer Intelligence
Account Basics
Spend & Scope
Procurement Model
Vendor Requirements
Terms & Policies
Entry Strategy
Pain Points & Triggers
Outputs
Pricing Analysis
Benchmarks
Trends
Should-Cost
Indexation
Landed Cost
Commercial Terms
Deliverables
Brand Analysis
Positioning & Value Prop
Share & Presence
Customer Evidence
Go-to-Market
Digital & Reputation
Compliance & Trust
KPIs & Gaps
Outputs
Full Research Suite comprises of:
Market outlook & trends analysis
Interviews & case studies
Strategic recommendations
Vendor profiles & capabilities analysis
5-year forecasts
8 regions and 60+ country-level data splits
Market segment data splits
12 months of continuous data updates
DELIVERED AS:
PDF EXCEL ONLINE
Flexible Plastic Drinking Pouch Market
Flexible Plastic Packaging Market Size and Share Forecast Outlook 2025 to 2035
Flexible Plastic Packaging Industry Analysis in United States Size and Share Forecast Outlook 2025 to 2035
Market Share Distribution Among Flexible Plastic Packaging Manufacturers
USA Flexible Plastic Packaging Market Insights – Trends, Demand & Growth 2025-2035
ASEAN Flexible Plastic Packaging Market Analysis - Size, Share, and Forecast Outlook 2025 to 2035
Japan Flexible Plastic Packaging Market Report – Demand, Trends & Industry Forecast 2025-2035
Europe Flexible Plastic Packaging Market Analysis by Material, Product Type, End Use, Packaging Type, and Region Forecast Through 2035
Competitive Breakdown of Europe Flexible Plastic Packaging Providers
Germany Flexible Plastic Packaging Market Outlook – Size, Trends & Forecast 2025-2035
Plastic Tubes for Effervescent Tablets Market Size and Share Forecast Outlook 2025 to 2035
Plastic Banding Market Size and Share Forecast Outlook 2025 to 2035
Plastic Tube Market Size and Share Forecast Outlook 2025 to 2035
Flexible Packaging Paper Market Size and Share Forecast Outlook 2025 to 2035
Plastic Jar Packaging Market Forecast and Outlook 2025 to 2035
Plastic Cases Market Size and Share Forecast Outlook 2025 to 2035
Plastic Jar Industry Analysis in the United States Size and Share Forecast Outlook 2025 to 2035
Plastic Cutlery Market Forecast and Outlook 2025 to 2035
Plastic Vial Market Forecast and Outlook 2025 to 2035
Plastic Hot and Cold Pipe Market Forecast and Outlook 2025 to 2035

Thank you!
You will receive an email from our Business Development Manager. Please be sure to check your SPAM/JUNK folder too.
Chat With
MaRIA