Methodology

Bag-in-Box Packaging Market Forecast and Outlook (2025-2035)

The bag-in-box packaging market is valued at USD 4.8 billion in 2025 and is projected to reach USD 11.3 billion by 2035, rising at an 8.9% CAGR, adding USD 6.4 billion in total. The magnitude and trajectory of expansion reflect accelerating shifts toward convenient liquid dispensing, extended shelf-life solutions, and cost-efficient distribution formats across beverages, liquid foods, and industrial fluids. Between 2025 and 2030, the market grows to USD 7.4 billion, accounting for 40.6% of the decade’s increase as beverage producers adopt low-waste dispensing systems, hospitality operators scale wine-on-tap programs, and liquid food processors prioritize inventory optimization. The larger 59.4% growth contribution during 2030–2035 stems from wider penetration of aseptic technology, premium barrier films, and smart dispensing systems with portion-control features supporting foodservice automation and value-added consumer experiences.

Technology segmentation reinforces these preservation and efficiency priorities: aseptic bag-in-box systems hold ~54% share, driven by ambient-stable dairy alternatives, nutritional beverages, and juice applications requiring microbiological safety and extended distribution cycles. In application terms, food & beverages command ~61%, reflecting dominant use across wine, juice, liquid dairy, beverage concentrates, and on-premise dispensing systems in QSR chains and hospitality environments. Industrial liquids form the next major cluster, supported by chemical handling, lubricants, and detergents adopting safer bulk-dispensing formats.

Geographically, growth is led by China (11.3% CAGR) and India (10.8%), supported by expanding beverage consumption, liquid food processing modernization, and rapid foodservice infrastructure scale-up. The USA (8.1%) and Australia (7.9%) benefit from craft beverage markets, wine-export packaging, and premium dispensing system innovation, while Spain (7.6%), France (7.3%), and Germany (6.8%) gain momentum through wine industry modernization, barrier-film advancements, and industrial liquid applications. Competitive structure is moderately concentrated, with Smurfit Kappa, DS Smith, Scholle IPN, Liqui-Box, and Rapak collectively shaping 30–35% of global supply through integrated film technologies, fitment innovation, and strong beverage-sector partnerships. Regional converters such as Optopack, CDF Corporation, Aran Group, and local packaging specialists compete through faster lead times, customized barrier structures, and application-specific dispensing solutions aligned with emerging foodservice and industrial needs.

Technological advancement is accelerating adoption across premium and sensitive products. High-barrier films with improved oxygen and light resistance allow storage of wines, dairy products, and specialty beverages for longer durations. Enhanced filling lines, aseptic technologies, and automated sealing systems ensure higher sterility standards and reduced contamination risks. In industrial settings, multi-layer bags capable of handling corrosive chemicals, lubricants, adhesives, and agrochemicals are expanding the format’s utility beyond consumer applications.
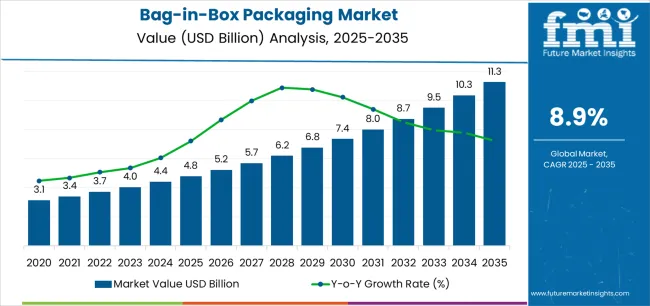
Quick Stats for Bag-in-Box Packaging Market

  • Bag-in-Box Packaging Market Value (2025): USD 4.8 billion
  • Bag-in-Box Packaging Market Forecast Value (2035): USD 11.3 billion
  • Bag-in-Box Packaging Market Forecast CAGR: 8.9%
  • Leading Application in Bag-in-Box Packaging Market: Food & Beverage (61%)
  • Key Growth Regions in Bag-in-Box Packaging Market: North America, Europe, and Asia Pacific
  • Top Players in Bag-in-Box Packaging Market: Smurfit Kappa Group, DS Smith plc, Rapak (DS Smith), Liqui-Box Corporation, Amcor plc, Scholle IPN Corporation, CDF Corporation, Optopack Ltd., TPS Rental Systems Ltd., and Aran Group

Bag In Box Packaging Market Market Value Analysis

Bag-in-Box Packaging Market Key Takeaways

Metric Value
Estimated Value in (2025E) USD 4.8 billion
Forecast Value in (2035F) USD 11.3 billion
Forecast CAGR (2025 to 2035) 8.9%

Why is the Bag-in-Box Packaging Market Growing?

Market expansion is being supported by the increasing global demand for convenient beverage dispensing and the corresponding need for cost-effective packaging solutions that can provide extended shelf-life, reduced transportation costs, and improved space utilization across foodservice, retail, and industrial liquid distribution channels. Modern beverage producers are increasingly focused on implementing packaging formats that can support brand differentiation, minimize product waste, and provide consistent quality throughout the consumption cycle. Bag-in-box packaging's proven ability to deliver exceptional product protection, convenient dispensing functionality, and freight optimization make them essential solutions for contemporary liquid product distribution and consumer convenience applications.

The growing emphasis on cost efficiency and distribution optimization is driving demand for bag-in-box packaging that can support reduced packaging weight, lower carbon footprint logistics, and simplified inventory management systems. Manufacturers' preference for packaging formats that combine product protection with handling convenience and storage efficiency is creating opportunities for innovative bag-in-box implementations. The rising influence of wine-on-tap adoption and craft beverage distribution is also contributing to increased demand for bag-in-box packaging that can provide preservation integrity, dispensing reliability, and premium presentation capabilities.

Opportunity Pathways - Bag-in-Box Packaging Market

The bag-in-box packaging market is poised for rapid growth and transformation. As industries across beverages, liquid foods, industrial fluids, and personal care seek packaging formats that deliver exceptional convenience, product protection, and distribution efficiency, bag-in-box solutions are gaining prominence not just as commodity packaging but as strategic enablers of brand differentiation and supply chain optimization.

Rising wine consumption in emerging markets and expanding foodservice operations globally amplify demand, while manufacturers are leveraging innovations in barrier film technologies, smart dispensing systems, and premium finishing options.

Pathways like premium wine packaging, aseptic processing integration, and application-specific customization promise strong margin uplift, especially in high-value segments. Geographic expansion and vertical integration will capture volume, particularly where regional production capabilities and supply chain proximity are critical. Regulatory pressures around packaging waste reduction, food safety compliance, beverage quality standards, and recyclable material adoption give structural support.

  • Pathway A - Premium Wine & Craft Beverage Packaging. Wine producers and craft beverage manufacturers increasingly require bag-in-box solutions with enhanced barrier properties, sophisticated dispensing systems, and premium external presentation. Packaging converters who develop wine-specific formats with extended preservation capabilities can command premium pricing. Expected revenue pool: USD 1.2-1.8 billion.
  • Pathway B - Aseptic Bag-in-Box Systems. Growing demand for ambient-stable liquid foods, dairy alternatives, and nutritional beverages drives need for aseptic processing compatibility, sterile barrier integrity, and validated microbiological safety. Opportunity: USD 1.5-2.2 billion.
  • Pathway C - Advanced Barrier Film Technologies. Enhanced barrier formulations including metallized films, multi-layer structures, and oxygen scavenging systems enable extended shelf-life and superior product preservation across sensitive liquid applications. Revenue lift: USD 800 million-1.3 billion.
  • Pathway D - Foodservice & On-Premise Dispensing Solutions. Expanding reach into restaurant chains, hotels, catering operations, and quick-service establishments requiring bulk liquid dispensing with portion control and operational efficiency. Pool: USD 1.0-1.6 billion.
  • Pathway E - Geographic Expansion & Regional Manufacturing. Strong growth in Asia-Pacific, particularly China, India, and Southeast Asia. Local production lowers costs, reduces logistics complexity, and enables faster response to regional beverage preferences. Expected upside: USD 1.4-2.0 billion.
  • Pathway F - Industrial & Non-Food Applications. Increasing demand for bag-in-box formats in lubricants, chemicals, detergents, and liquid industrial products requiring safe handling and efficient dispensing. USD 700 million-1.1 billion.
  • Pathway G - Recyclable & Mono-Material Structures. Developing bag-in-box packaging with improved recyclability through simplified material composition and designing for circular economy integration creates differentiation. Growing regulatory support and retailer preferences. Pool: USD 600 million-950 million.

Segmental Analysis

The market is segmented by capacity, material type, technology, application, end use industry, and region. By capacity, the market is divided into small (up to 5 liters), medium (5-10 liters), and large (above 10 liters). By material type, it covers plastic films (polyethylene, EVOH, metallized films), cardboard outer packaging, and fitments & taps. By technology, it is segmented into aseptic bag-in-box and non-aseptic bag-in-box. By application, it includes beverages (wine, juice, liquid dairy, water, others), liquid food products, and industrial liquids. By end use industry, it is categorized into food & beverage, hospitality & foodservice, industrial, and retail. Based on distribution channel, the market includes direct sales, distributors, and packaging converters. Regionally, the market is divided into North America, Europe, East Asia, South Asia & Pacific, Latin America, and the Middle East & Africa.
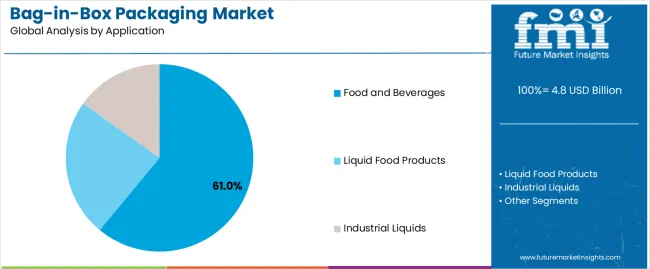
By Application, the Food & Beverage Segment Accounts for 61% Market Share

Bag In Box Packaging Market Analysis By Application

The food & beverage segment is projected to account for 61% of the bag-in-box packaging market in 2025, reaffirming its position as the leading application category. Beverage producers increasingly utilize bag-in-box formats for their superior product preservation, convenient dispensing functionality, and cost-effective distribution characteristics in applications ranging from wine and juice to liquid dairy products and beverage concentrates. Bag-in-box packaging technology's advanced barrier capabilities and dispensing reliability directly address the industry requirements for extended shelf-life and operational efficiency in both retail and foodservice environments.

This application segment forms the foundation of modern liquid food distribution operations, as it represents the packaging format with the greatest versatility and established market demand across multiple beverage categories and consumption occasions. Manufacturer investments in enhanced barrier film technologies and premium dispensing systems continue to strengthen adoption among beverage producers. With companies prioritizing product quality and distribution cost optimization, bag-in-box packaging aligns with both preservation performance requirements and supply chain efficiency objectives, making them the central component of comprehensive liquid packaging strategies.
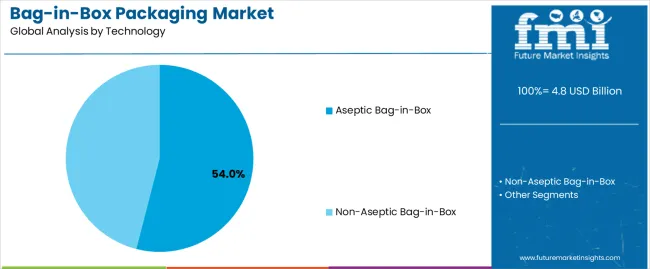
By Technology, the Aseptic Bag-in-Box Segment Accounts for 54.0% Market Share

Bag In Box Packaging Market Analysis By Technology

Aseptic bag-in-box systems are projected to represent 54.0% of bag-in-box packaging demand in 2025, underscoring their critical role as the primary technology platform for ambient-stable liquid food products requiring extended shelf-life without refrigeration. Food and beverage manufacturers prefer aseptic bag-in-box solutions for their exceptional microbiological safety, validated sterilization processes, and ability to maintain product quality throughout extended distribution cycles. Positioned as essential packaging for modern liquid food processing, aseptic bag-in-box systems offer both preservation advantages and distribution flexibility benefits.

The segment is supported by continuous innovation in sterilization technologies and the growing availability of validated aseptic filling equipment that enables premium product quality with enhanced shelf-life characteristics. Additionally, liquid food manufacturers are investing in aseptic processing capabilities to support ambient distribution strategies and reduced cold chain dependency. As dairy alternative demand becomes more prevalent and nutritional beverage consumption increases, aseptic bag-in-box applications will continue to dominate the technology market while supporting advanced product formulation and distribution optimization strategies.

What are the Drivers, Restraints, and Key Trends of the Bag-in-Box Packaging Market?

The bag-in-box packaging market is advancing rapidly due to increasing demand for convenient beverage dispensing solutions and growing adoption of cost-effective packaging formats that provide extended shelf-life and reduced distribution costs across foodservice, retail, and industrial liquid applications. However, the market faces challenges, including consumer perception barriers regarding premium product positioning, compatibility limitations with certain liquid formulations, and the need for specialized filling equipment investments. Innovation in barrier film technologies and smart dispensing systems continues to influence product development and market expansion patterns.

Expansion of Wine-on-Tap and Premium Beverage Concepts

The growing adoption of wine-on-tap programs in restaurants, bars, and hospitality venues is enabling beverage suppliers to offer premium products with reduced waste, improved cost economics, and enhanced freshness guarantees. Wine-on-tap systems provide improved profitability while allowing more efficient inventory management and consistent quality across service locations. Beverage distributors are increasingly recognizing the competitive advantages of bag-in-box formats for premium market positioning and operational excellence.

Integration of Smart Dispensing and Portion Control Technologies

Modern bag-in-box packaging producers are incorporating electronic monitoring systems, automated portion control mechanisms, and dispensing analytics to enhance operational efficiency, enable consumption tracking, and deliver value-added solutions to foodservice operators. These technologies improve inventory management while enabling data-driven purchasing decisions and waste reduction programs. Advanced dispensing integration also allows manufacturers to support premium service positioning and operational optimization beyond traditional bulk packaging supply.
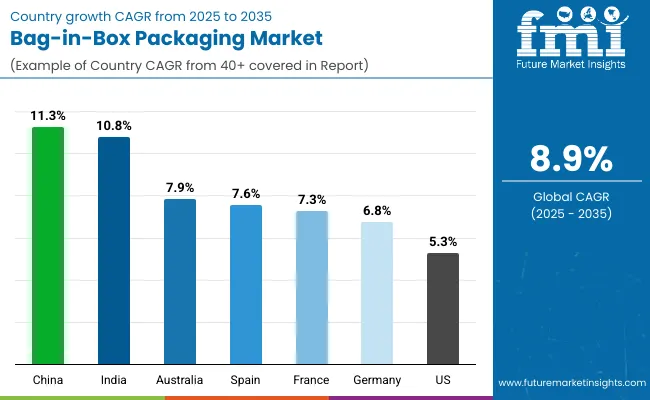
Analysis of the Bag-in-Box Packaging Market by Key Countries

Bag In Box Market Country Wise Analysis

Country CAGR (2025-2035)
China 11.3%
India 10.8%
Australia 7.9%
Spain 7.6%
France 7.3%
Germany 6.8%
United States 5.3%

The bag-in-box packaging market is experiencing strong growth globally, with China leading at an 11.3% CAGR through 2035, driven by the expanding wine consumption, growing liquid food processing sector, and significant investment in modern foodservice infrastructure development. India follows at 10.8%, supported by rapid dairy industry modernization, increasing juice consumption, and growing adoption of organized retail formats. The USA shows growth at 5.3%, emphasizing craft beverage distribution and premium wine packaging innovation. Australia records 7.9%, focusing on wine export packaging and domestic beverage market sophistication. France demonstrates 7.3% growth, prioritizing wine industry innovation and premium beverage packaging excellence. Germany exhibits 6.8% growth, emphasizing quality control and industrial liquid packaging. Spain shows 7.6% growth, supported by wine production leadership and beverage processing expansion.

The report covers an in-depth analysis of 40+ countries top-performing countries are highlighted below.

China Leads Global Market Growth with Beverage Consumption Expansion

Revenue from bag-in-box packaging in China is projected to exhibit exceptional growth with a CAGR of 11.3% through 2035, driven by expanding wine consumption habits and rapidly growing liquid food processing capacity supported by urbanization and rising middle-class beverage preferences. The country's growing position in global wine imports and increasing investment in modern foodservice operations are creating substantial demand for convenient liquid packaging solutions. Major beverage distributors and foodservice chains are establishing comprehensive bag-in-box sourcing capabilities to serve both domestic consumption and regional distribution networks.

  • Government support for food safety modernization and cold chain infrastructure development is driving demand for advanced liquid packaging throughout major urban centers and foodservice distribution networks.
  • Strong beverage import growth and an expanding network of restaurant chains are supporting the rapid adoption of bag-in-box packaging among distributors seeking enhanced operational efficiency and product quality.

India Demonstrates Strong Market Potential with Dairy Industry Growth

Revenue from bag-in-box packaging in India is expanding at a CAGR of 10.8%, supported by the country's growing organized dairy sector, expanding juice consumption, and increasing adoption of modern retail formats. The country's rising disposable income and growing preference for packaged liquid foods are driving requirements for efficient liquid packaging capabilities. International packaging suppliers and domestic converters are establishing extensive production and distribution capabilities to address the growing demand for bag-in-box solutions.

  • Rising urban consumption and expanding quick-service restaurant networks are creating opportunities for bag-in-box adoption across beverage distributors, dairy cooperatives, and foodservice suppliers in major metropolitan regions.
  • Growing focus on cold chain infrastructure and food safety standards is driving adoption of aseptic bag-in-box systems among liquid food processors seeking enhanced product preservation and distribution efficiency.

USA Demonstrates Innovation Leadership with Craft Beverage Growth

Revenue from bag-in-box packaging in the USA is expanding at a CAGR of 5.3%, supported by the country's thriving craft beverage industry, strong emphasis on premium wine packaging, and robust demand for convenient dispensing solutions in hospitality applications. The nation's mature wine market and high-value beverage focus are driving sophisticated bag-in-box capabilities throughout the distribution chain. Leading packaging converters and beverage suppliers are investing extensively in advanced barrier technologies and premium finishing options to serve both domestic and export markets.

  • Rising adoption of wine-on-tap programs and craft cocktail concepts is creating requirements for premium bag-in-box formats with enhanced barrier properties and sophisticated dispensing systems among restaurants and bars seeking operational advantages.
  • Strong consumer preference for convenience and growing interest in eco-friendly packaging are supporting adoption of bag-in-box formats across wine producers and specialty beverage manufacturers in major wine-producing regions.

Australia Focuses on Wine Export Packaging and Domestic Market

Revenue from bag-in-box packaging in Australia is growing at a CAGR of 7.9%, driven by the country's leadership in wine production, expanding domestic beverage consumption, and growing investment in premium packaging development. Australia's concentration of major wineries and commitment to export quality standards are supporting demand for high-performance bag-in-box solutions across multiple market segments. Manufacturers are establishing comprehensive quality assurance capabilities to maintain competitive positioning in key export markets.

  • Premium wine production and export focus are driving adoption of specialized bag-in-box formats with superior barrier properties and premium presentation capabilities among leading wineries targeting international markets.
  • Growing domestic acceptance of bag-in-box wine formats and increasing foodservice adoption are supporting market expansion for convenient dispensing systems throughout the country's hospitality sector.

France Emphasizes Wine Industry Innovation and Quality Standards

Revenue from bag-in-box packaging in France is expanding at a CAGR of 7.3%, supported by the country's wine production heritage, advanced packaging innovation capabilities, and strategic focus on quality liquid food packaging. France's wine industry leadership and beverage packaging expertise are driving demand for bag-in-box solutions in premium wine distribution, juice production, and specialty liquid food applications. Manufacturers are investing in comprehensive development capabilities to serve both domestic wine producers and international premium markets.

  • Wine industry modernization and evolving consumer preferences are creating opportunities for bag-in-box adoption in casual wine consumption and picnic formats among producers seeking new market segments.
  • Growing emphasis on packaging innovation and quality preservation is driving adoption of advanced barrier films with enhanced oxygen protection throughout the country's wine production regions.

Germany Exhibits Quality Control Excellence and Industrial Applications

Revenue from bag-in-box packaging in Germany is growing at a CAGR of 6.8%, driven by the country's expertise in packaging technology, emphasis on quality control, and strong position in industrial liquid packaging and beverage distribution. Germany's established packaging manufacturing capabilities and commitment to operational excellence are supporting investment in advanced filling technologies throughout major production centers. Industry leaders are establishing comprehensive quality management systems to serve domestic beverage producers and industrial liquid markets.

  • Innovations in aseptic processing and barrier film technology are creating demand for premium bag-in-box solutions with validated sterility and extended shelf-life among manufacturers of liquid dairy alternatives and nutritional beverages.
  • Growing industrial fluid distribution and chemical handling requirements are driving adoption of specialized bag-in-box formats with chemical resistance and safe dispensing capabilities across industrial manufacturing sectors.

Spain Shows Wine Production Leadership and Beverage Growth

Revenue from bag-in-box packaging in Spain is expanding at a CAGR of 7.6%, supported by the country's wine production scale, growing beverage processing industry, and strategic position in European liquid food distribution. Spain's wine export capabilities and integrated beverage manufacturing ecosystem are driving demand for cost-effective bag-in-box packaging in bulk wine distribution, juice concentrates, and liquid food applications. Leading manufacturers are investing in production capacity to serve the growing requirements of domestic and export markets.

  • Wine production efficiency initiatives and export competitiveness are creating requirements for economical bag-in-box formats with reliable quality and efficient filling capabilities among large-scale wine producers and cooperatives.
  • Strong position in juice concentrate production and liquid food processing is supporting adoption of aseptic bag-in-box systems throughout the country's comprehensive beverage manufacturing infrastructure.

Europe Market Split by Countries

The bag-in-box packaging market in Europe is projected to grow from USD 1.9 billion in 2025 to USD 4.1 billion by 2035, registering a CAGR of 8.0% over the forecast period. France is expected to maintain its leadership position with a 28.0% market share in 2025, projected to reach 28.5% by 2035, supported by its strong wine industry, advanced beverage packaging capabilities, and comprehensive liquid food processing base serving diverse bag-in-box applications across Europe.

Germany follows with a 24.0% share in 2025, projected to reach 24.2% by 2035, driven by robust demand for bag-in-box packaging in industrial liquids, dairy alternatives, and beverage distribution, combined with established packaging manufacturing capabilities and quality control excellence. The United Kingdom holds a 15.0% share in 2025, expected to maintain 15.0% through 2035, supported by strong wine consumption and growing foodservice adoption. Spain commands an 18.0% share in 2025, projected to reach 18.5% by 2035, while Italy accounts for 8.0% in 2025, expected to reach 8.2% by 2035. The Netherlands maintains a 3.5% share in 2025, growing to 3.6% by 2035. The Rest of Europe region, including Nordic countries, Eastern Europe, Belgium, Switzerland, Austria, and Poland, is anticipated to gain momentum, with its collective share adjusting from 3.5% to 2.0% by 2035, attributed to increasing wine consumption in Eastern Europe and growing craft beverage distribution in Nordic countries implementing modern packaging programs.
Competitive Landscape of the Bag-in-Box Packaging Market

Bag In Box Packaging Market Analysis By Company

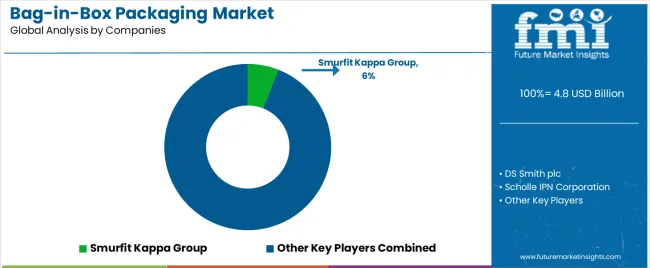
The bag-in-box packaging market features 10–15 players with moderate concentration, where the top three companies collectively hold around 46–52% of global market share, driven by strong expertise in flexible films, dispensing technologies, and long-standing partnerships with beverage, food, and industrial liquid brands. The leading company, Smurfit Kappa Group, commands roughly 6% of the market share, supported by its advanced Bag-in-Box systems, proprietary Vitop® dispensing technology, and global manufacturing footprint. Competition centers on film barrier performance, dispensing reliability, product safety, sustainability, and filling-line compatibility rather than simple price-based strategies.

Market leaders such as Smurfit Kappa Group, DS Smith plc (Rapak), and Liqui-Box Corporation maintain dominant positions by offering high-performance bags, taps, fitments, and integrated filling systems tailored for wine, dairy, juices, water, and foodservice applications. Their strengths include multilayer film innovation, oxygen-barrier technologies, and strong sustainability programs that reduce plastic usage and extend product shelf life.

Challenger companies including Amcor plc, Scholle IPN Corporation, and CDF Corporation compete with specialized films, custom dispensing solutions, and recyclable Bag-in-Box formats targeted at both consumer and industrial liquid packaging.

Additional competition arises from Optopack Ltd., TPS Rental Systems Ltd., and Aran Group, which enhance regional presence through cost-effective production, flexible customization, and reliable supply for foodservice, chemical, and bulk liquid applications.

Key Players in the Bag-in-Box Packaging Market

  • Smurfit Kappa Group
  • DS Smith plc
  • Rapak (DS Smith)
  • Liqui-Box Corporation
  • Amcor plc
  • Scholle IPN Corporation
  • CDF Corporation
  • Optopack Ltd.
  • TPS Rental Systems Ltd.
  • Aran Group

Scope of the Report

Items Values
Quantitative Units (2025) USD 4.8 billion
Capacity Small (up to 5 liters), Medium (5-10 liters), Large (above 10 liters)
Material Type Plastic Films (Polyethylene, EVOH, Metallized Films), Cardboard Outer Packaging, Fitments & Taps
Technology Aseptic Bag-in-Box, Non-Aseptic Bag-in-Box
Application Beverages (Wine, Juice, Liquid Dairy, Water, Others), Liquid Food Products, Industrial Liquids
End Use Industry Food & Beverage, Hospitality & Foodservice, Industrial, Retail
Distribution Channel Direct Sales, Distributors, Packaging Converters
Regions Covered North America, Europe, East Asia, South Asia & Pacific, Latin America, Middle East & Africa
Countries Covered United States, Canada, United Kingdom, Germany, France, Spain, China, Japan, South Korea, India, Australia, Brazil and 40+ countries
Key Companies Profiled Smurfit Kappa Group, DS Smith plc, Rapak (DS Smith), Liqui-Box Corporation, Amcor plc, Scholle IPN Corporation, CDF Corporation, Optopack Ltd., TPS Rental Systems Ltd., and Aran Group
Additional Attributes Dollar sales by capacity and application category, regional demand trends, competitive landscape, technological advancements in barrier systems, aseptic processing integration, dispensing innovation, and supply chain optimization

Bag-in-Box Packaging Market by Segments

Capacity:

  • Small (up to 5 liters)
  • Medium (5-10 liters)
  • Large (above 10 liters)

Material Type:

  • Plastic Films (Polyethylene, EVOH, Metallized Films)
  • Cardboard Outer Packaging
  • Fitments & Taps

Technology:

  • Aseptic Bag-in-Box
  • Non-Aseptic Bag-in-Box

Application:

  • Beverages
    • Wine
    • Juice
    • Liquid Dairy
    • Water
    • Others
  • Liquid Food Products
  • Industrial Liquids

End Use Industry:

  • Food & Beverage
  • Hospitality & Foodservice
  • Industrial
  • Retail

Distribution Channel:

  • Direct Sales
  • Distributors
  • Packaging Converters

Region:

North America

  • United States
  • Canada
  • Mexico

Europe

  • France
  • Germany
  • United Kingdom
  • Spain
  • Italy
  • Nordic
  • BENELUX
  • Rest of Europe

East Asia

  • China
  • Japan
  • South Korea
  • Taiwan

South Asia & Pacific

  • India
  • ASEAN
  • Australia & New Zealand
  • Rest of South Asia & Pacific

Latin America

  • Brazil
  • Chile
  • Argentina
  • Rest of Latin America

Middle East & Africa

  • Kingdom of Saudi Arabia
  • Other GCC Countries
  • Turkiye
  • South Africa
  • Other African Union
  • Rest of Middle East & Africa

Frequently Asked Questions

How big is the bag-in-box packaging market in 2025?

The global bag-in-box packaging market is estimated to be valued at USD 4.8 billion in 2025.

What will be the size of bag-in-box packaging market in 2035?

The market size for the bag-in-box packaging market is projected to reach USD 11.3 billion by 2035.

How much will be the bag-in-box packaging market growth between 2025 and 2035?

The bag-in-box packaging market is expected to grow at a 8.9% CAGR between 2025 and 2035.

What are the key product types in the bag-in-box packaging market?

The key product types in bag-in-box packaging market are aseptic bag-in-box and non-aseptic bag-in-box.

Which application segment to contribute significant share in the bag-in-box packaging market in 2025?

In terms of application, food and beverages segment to command 61.0% share in the bag-in-box packaging market in 2025.

Table of Content

  1. Executive Summary
    • Global Market Outlook
    • Demand to side Trends
    • Supply to side Trends
    • Technology Roadmap Analysis
    • Analysis and Recommendations
  2. Market Overview
    • Market Coverage / Taxonomy
    • Market Definition / Scope / Limitations
  3. Market Background
    • Market Dynamics
      • Drivers
      • Restraints
      • Opportunity
      • Trends
    • Scenario Forecast
      • Demand in Optimistic Scenario
      • Demand in Likely Scenario
      • Demand in Conservative Scenario
    • Opportunity Map Analysis
    • Product Life Cycle Analysis
    • Supply Chain Analysis
    • Investment Feasibility Matrix
    • Value Chain Analysis
    • PESTLE and Porter’s Analysis
    • Regulatory Landscape
    • Regional Parent Market Outlook
    • Production and Consumption Statistics
    • Import and Export Statistics
  4. Global Market Analysis 2020 to 2024 and Forecast, 2025 to 2035
    • Historical Market Size Value (USD Million) Analysis, 2020 to 2024
    • Current and Future Market Size Value (USD Million) Projections, 2025 to 2035
      • Y to o to Y Growth Trend Analysis
      • Absolute $ Opportunity Analysis
  5. Global Market Pricing Analysis 2020 to 2024 and Forecast 2025 to 2035
  6. Global Market Analysis 2020 to 2024 and Forecast 2025 to 2035, By Technology
    • Introduction / Key Findings
    • Historical Market Size Value (USD Million) Analysis By Technology , 2020 to 2024
    • Current and Future Market Size Value (USD Million) Analysis and Forecast By Technology , 2025 to 2035
      • Aseptic Bag-in-Box
      • Non-Aseptic Bag-in-Box
    • Y to o to Y Growth Trend Analysis By Technology , 2020 to 2024
    • Absolute $ Opportunity Analysis By Technology , 2025 to 2035
  7. Global Market Analysis 2020 to 2024 and Forecast 2025 to 2035, By Application
    • Introduction / Key Findings
    • Historical Market Size Value (USD Million) Analysis By Application, 2020 to 2024
    • Current and Future Market Size Value (USD Million) Analysis and Forecast By Application, 2025 to 2035
      • Food and Beverages
      • Liquid Food Products
      • Industrial Liquids
    • Y to o to Y Growth Trend Analysis By Application, 2020 to 2024
    • Absolute $ Opportunity Analysis By Application, 2025 to 2035
  8. Global Market Analysis 2020 to 2024 and Forecast 2025 to 2035, By Region
    • Introduction
    • Historical Market Size Value (USD Million) Analysis By Region, 2020 to 2024
    • Current Market Size Value (USD Million) Analysis and Forecast By Region, 2025 to 2035
      • North America
      • Latin America
      • Western Europe
      • Eastern Europe
      • East Asia
      • South Asia and Pacific
      • Middle East & Africa
    • Market Attractiveness Analysis By Region
  9. North America Market Analysis 2020 to 2024 and Forecast 2025 to 2035, By Country
    • Historical Market Size Value (USD Million) Trend Analysis By Market Taxonomy, 2020 to 2024
    • Market Size Value (USD Million) Forecast By Market Taxonomy, 2025 to 2035
      • By Country
        • USA
        • Canada
        • Mexico
      • By Technology
      • By Application
    • Market Attractiveness Analysis
      • By Country
      • By Technology
      • By Application
    • Key Takeaways
  10. Latin America Market Analysis 2020 to 2024 and Forecast 2025 to 2035, By Country
    • Historical Market Size Value (USD Million) Trend Analysis By Market Taxonomy, 2020 to 2024
    • Market Size Value (USD Million) Forecast By Market Taxonomy, 2025 to 2035
      • By Country
        • Brazil
        • Chile
        • Rest of Latin America
      • By Technology
      • By Application
    • Market Attractiveness Analysis
      • By Country
      • By Technology
      • By Application
    • Key Takeaways
  11. Western Europe Market Analysis 2020 to 2024 and Forecast 2025 to 2035, By Country
    • Historical Market Size Value (USD Million) Trend Analysis By Market Taxonomy, 2020 to 2024
    • Market Size Value (USD Million) Forecast By Market Taxonomy, 2025 to 2035
      • By Country
        • Germany
        • UK
        • Italy
        • Spain
        • France
        • Nordic
        • BENELUX
        • Rest of Western Europe
      • By Technology
      • By Application
    • Market Attractiveness Analysis
      • By Country
      • By Technology
      • By Application
    • Key Takeaways
  12. Eastern Europe Market Analysis 2020 to 2024 and Forecast 2025 to 2035, By Country
    • Historical Market Size Value (USD Million) Trend Analysis By Market Taxonomy, 2020 to 2024
    • Market Size Value (USD Million) Forecast By Market Taxonomy, 2025 to 2035
      • By Country
        • Russia
        • Poland
        • Hungary
        • Balkan & Baltic
        • Rest of Eastern Europe
      • By Technology
      • By Application
    • Market Attractiveness Analysis
      • By Country
      • By Technology
      • By Application
    • Key Takeaways
  13. East Asia Market Analysis 2020 to 2024 and Forecast 2025 to 2035, By Country
    • Historical Market Size Value (USD Million) Trend Analysis By Market Taxonomy, 2020 to 2024
    • Market Size Value (USD Million) Forecast By Market Taxonomy, 2025 to 2035
      • By Country
        • China
        • Japan
        • South Korea
      • By Technology
      • By Application
    • Market Attractiveness Analysis
      • By Country
      • By Technology
      • By Application
    • Key Takeaways
  14. South Asia and Pacific Market Analysis 2020 to 2024 and Forecast 2025 to 2035, By Country
    • Historical Market Size Value (USD Million) Trend Analysis By Market Taxonomy, 2020 to 2024
    • Market Size Value (USD Million) Forecast By Market Taxonomy, 2025 to 2035
      • By Country
        • India
        • ASEAN
        • Australia & New Zealand
        • Rest of South Asia and Pacific
      • By Technology
      • By Application
    • Market Attractiveness Analysis
      • By Country
      • By Technology
      • By Application
    • Key Takeaways
  15. Middle East & Africa Market Analysis 2020 to 2024 and Forecast 2025 to 2035, By Country
    • Historical Market Size Value (USD Million) Trend Analysis By Market Taxonomy, 2020 to 2024
    • Market Size Value (USD Million) Forecast By Market Taxonomy, 2025 to 2035
      • By Country
        • Kingdom of Saudi Arabia
        • Other GCC Countries
        • Turkiye
        • South Africa
        • Other African Union
        • Rest of Middle East & Africa
      • By Technology
      • By Application
    • Market Attractiveness Analysis
      • By Country
      • By Technology
      • By Application
    • Key Takeaways
  16. Key Countries Market Analysis
    • USA
      • Pricing Analysis
      • Market Share Analysis, 2024
        • By Technology
        • By Application
    • Canada
      • Pricing Analysis
      • Market Share Analysis, 2024
        • By Technology
        • By Application
    • Mexico
      • Pricing Analysis
      • Market Share Analysis, 2024
        • By Technology
        • By Application
    • Brazil
      • Pricing Analysis
      • Market Share Analysis, 2024
        • By Technology
        • By Application
    • Chile
      • Pricing Analysis
      • Market Share Analysis, 2024
        • By Technology
        • By Application
    • Germany
      • Pricing Analysis
      • Market Share Analysis, 2024
        • By Technology
        • By Application
    • UK
      • Pricing Analysis
      • Market Share Analysis, 2024
        • By Technology
        • By Application
    • Italy
      • Pricing Analysis
      • Market Share Analysis, 2024
        • By Technology
        • By Application
    • Spain
      • Pricing Analysis
      • Market Share Analysis, 2024
        • By Technology
        • By Application
    • France
      • Pricing Analysis
      • Market Share Analysis, 2024
        • By Technology
        • By Application
    • India
      • Pricing Analysis
      • Market Share Analysis, 2024
        • By Technology
        • By Application
    • ASEAN
      • Pricing Analysis
      • Market Share Analysis, 2024
        • By Technology
        • By Application
    • Australia & New Zealand
      • Pricing Analysis
      • Market Share Analysis, 2024
        • By Technology
        • By Application
    • China
      • Pricing Analysis
      • Market Share Analysis, 2024
        • By Technology
        • By Application
    • Japan
      • Pricing Analysis
      • Market Share Analysis, 2024
        • By Technology
        • By Application
    • South Korea
      • Pricing Analysis
      • Market Share Analysis, 2024
        • By Technology
        • By Application
    • Russia
      • Pricing Analysis
      • Market Share Analysis, 2024
        • By Technology
        • By Application
    • Poland
      • Pricing Analysis
      • Market Share Analysis, 2024
        • By Technology
        • By Application
    • Hungary
      • Pricing Analysis
      • Market Share Analysis, 2024
        • By Technology
        • By Application
    • Kingdom of Saudi Arabia
      • Pricing Analysis
      • Market Share Analysis, 2024
        • By Technology
        • By Application
    • Turkiye
      • Pricing Analysis
      • Market Share Analysis, 2024
        • By Technology
        • By Application
    • South Africa
      • Pricing Analysis
      • Market Share Analysis, 2024
        • By Technology
        • By Application
  17. Market Structure Analysis
    • Competition Dashboard
    • Competition Benchmarking
    • Market Share Analysis of Top Players
      • By Regional
      • By Technology
      • By Application
  18. Competition Analysis
    • Competition Deep Dive
      • Smurfit Kappa Group
        • Overview
        • Product Portfolio
        • Profitability by Market Segments (Product/Age /Sales Channel/Region)
        • Sales Footprint
        • Strategy Overview
          • Marketing Strategy
          • Product Strategy
          • Channel Strategy
      • DS Smith plc
      • Scholle IPN Corporation
      • Liqui-Box Corporation
      • Rapak (DS Smith)
      • Amcor plc
      • CDF Corporation
      • Optopack Ltd.
      • TPS Rental Systems Ltd.
      • Aran Group
  19. Assumptions & Acronyms Used
  20. Research Methodology

List of Tables

  • Table 1: Global Market Value (USD Million) Forecast by Region, 2020 to 2035
  • Table 2: Global Market Value (USD Million) Forecast by Technology , 2020 to 2035
  • Table 3: Global Market Value (USD Million) Forecast by Application, 2020 to 2035
  • Table 4: North America Market Value (USD Million) Forecast by Country, 2020 to 2035
  • Table 5: North America Market Value (USD Million) Forecast by Technology , 2020 to 2035
  • Table 6: North America Market Value (USD Million) Forecast by Application, 2020 to 2035
  • Table 7: Latin America Market Value (USD Million) Forecast by Country, 2020 to 2035
  • Table 8: Latin America Market Value (USD Million) Forecast by Technology , 2020 to 2035
  • Table 9: Latin America Market Value (USD Million) Forecast by Application, 2020 to 2035
  • Table 10: Western Europe Market Value (USD Million) Forecast by Country, 2020 to 2035
  • Table 11: Western Europe Market Value (USD Million) Forecast by Technology , 2020 to 2035
  • Table 12: Western Europe Market Value (USD Million) Forecast by Application, 2020 to 2035
  • Table 13: Eastern Europe Market Value (USD Million) Forecast by Country, 2020 to 2035
  • Table 14: Eastern Europe Market Value (USD Million) Forecast by Technology , 2020 to 2035
  • Table 15: Eastern Europe Market Value (USD Million) Forecast by Application, 2020 to 2035
  • Table 16: East Asia Market Value (USD Million) Forecast by Country, 2020 to 2035
  • Table 17: East Asia Market Value (USD Million) Forecast by Technology , 2020 to 2035
  • Table 18: East Asia Market Value (USD Million) Forecast by Application, 2020 to 2035
  • Table 19: South Asia and Pacific Market Value (USD Million) Forecast by Country, 2020 to 2035
  • Table 20: South Asia and Pacific Market Value (USD Million) Forecast by Technology , 2020 to 2035
  • Table 21: South Asia and Pacific Market Value (USD Million) Forecast by Application, 2020 to 2035
  • Table 22: Middle East & Africa Market Value (USD Million) Forecast by Country, 2020 to 2035
  • Table 23: Middle East & Africa Market Value (USD Million) Forecast by Technology , 2020 to 2035
  • Table 24: Middle East & Africa Market Value (USD Million) Forecast by Application, 2020 to 2035

List of Figures

  • Figure 1: Global Market Pricing Analysis
  • Figure 2: Global Market Value (USD Million) Forecast 2020-2035
  • Figure 3: Global Market Value Share and BPS Analysis by Technology , 2025 and 2035
  • Figure 4: Global Market Y to o to Y Growth Comparison by Technology , 2025-2035
  • Figure 5: Global Market Attractiveness Analysis by Technology
  • Figure 6: Global Market Value Share and BPS Analysis by Application, 2025 and 2035
  • Figure 7: Global Market Y to o to Y Growth Comparison by Application, 2025-2035
  • Figure 8: Global Market Attractiveness Analysis by Application
  • Figure 9: Global Market Value (USD Million) Share and BPS Analysis by Region, 2025 and 2035
  • Figure 10: Global Market Y to o to Y Growth Comparison by Region, 2025-2035
  • Figure 11: Global Market Attractiveness Analysis by Region
  • Figure 12: North America Market Incremental Dollar Opportunity, 2025-2035
  • Figure 13: Latin America Market Incremental Dollar Opportunity, 2025-2035
  • Figure 14: Western Europe Market Incremental Dollar Opportunity, 2025-2035
  • Figure 15: Eastern Europe Market Incremental Dollar Opportunity, 2025-2035
  • Figure 16: East Asia Market Incremental Dollar Opportunity, 2025-2035
  • Figure 17: South Asia and Pacific Market Incremental Dollar Opportunity, 2025-2035
  • Figure 18: Middle East & Africa Market Incremental Dollar Opportunity, 2025-2035
  • Figure 19: North America Market Value Share and BPS Analysis by Country, 2025 and 2035
  • Figure 20: North America Market Value Share and BPS Analysis by Technology , 2025 and 2035
  • Figure 21: North America Market Y to o to Y Growth Comparison by Technology , 2025-2035
  • Figure 22: North America Market Attractiveness Analysis by Technology
  • Figure 23: North America Market Value Share and BPS Analysis by Application, 2025 and 2035
  • Figure 24: North America Market Y to o to Y Growth Comparison by Application, 2025-2035
  • Figure 25: North America Market Attractiveness Analysis by Application
  • Figure 26: Latin America Market Value Share and BPS Analysis by Country, 2025 and 2035
  • Figure 27: Latin America Market Value Share and BPS Analysis by Technology , 2025 and 2035
  • Figure 28: Latin America Market Y to o to Y Growth Comparison by Technology , 2025-2035
  • Figure 29: Latin America Market Attractiveness Analysis by Technology
  • Figure 30: Latin America Market Value Share and BPS Analysis by Application, 2025 and 2035
  • Figure 31: Latin America Market Y to o to Y Growth Comparison by Application, 2025-2035
  • Figure 32: Latin America Market Attractiveness Analysis by Application
  • Figure 33: Western Europe Market Value Share and BPS Analysis by Country, 2025 and 2035
  • Figure 34: Western Europe Market Value Share and BPS Analysis by Technology , 2025 and 2035
  • Figure 35: Western Europe Market Y to o to Y Growth Comparison by Technology , 2025-2035
  • Figure 36: Western Europe Market Attractiveness Analysis by Technology
  • Figure 37: Western Europe Market Value Share and BPS Analysis by Application, 2025 and 2035
  • Figure 38: Western Europe Market Y to o to Y Growth Comparison by Application, 2025-2035
  • Figure 39: Western Europe Market Attractiveness Analysis by Application
  • Figure 40: Eastern Europe Market Value Share and BPS Analysis by Country, 2025 and 2035
  • Figure 41: Eastern Europe Market Value Share and BPS Analysis by Technology , 2025 and 2035
  • Figure 42: Eastern Europe Market Y to o to Y Growth Comparison by Technology , 2025-2035
  • Figure 43: Eastern Europe Market Attractiveness Analysis by Technology
  • Figure 44: Eastern Europe Market Value Share and BPS Analysis by Application, 2025 and 2035
  • Figure 45: Eastern Europe Market Y to o to Y Growth Comparison by Application, 2025-2035
  • Figure 46: Eastern Europe Market Attractiveness Analysis by Application
  • Figure 47: East Asia Market Value Share and BPS Analysis by Country, 2025 and 2035
  • Figure 48: East Asia Market Value Share and BPS Analysis by Technology , 2025 and 2035
  • Figure 49: East Asia Market Y to o to Y Growth Comparison by Technology , 2025-2035
  • Figure 50: East Asia Market Attractiveness Analysis by Technology
  • Figure 51: East Asia Market Value Share and BPS Analysis by Application, 2025 and 2035
  • Figure 52: East Asia Market Y to o to Y Growth Comparison by Application, 2025-2035
  • Figure 53: East Asia Market Attractiveness Analysis by Application
  • Figure 54: South Asia and Pacific Market Value Share and BPS Analysis by Country, 2025 and 2035
  • Figure 55: South Asia and Pacific Market Value Share and BPS Analysis by Technology , 2025 and 2035
  • Figure 56: South Asia and Pacific Market Y to o to Y Growth Comparison by Technology , 2025-2035
  • Figure 57: South Asia and Pacific Market Attractiveness Analysis by Technology
  • Figure 58: South Asia and Pacific Market Value Share and BPS Analysis by Application, 2025 and 2035
  • Figure 59: South Asia and Pacific Market Y to o to Y Growth Comparison by Application, 2025-2035
  • Figure 60: South Asia and Pacific Market Attractiveness Analysis by Application
  • Figure 61: Middle East & Africa Market Value Share and BPS Analysis by Country, 2025 and 2035
  • Figure 62: Middle East & Africa Market Value Share and BPS Analysis by Technology , 2025 and 2035
  • Figure 63: Middle East & Africa Market Y to o to Y Growth Comparison by Technology , 2025-2035
  • Figure 64: Middle East & Africa Market Attractiveness Analysis by Technology
  • Figure 65: Middle East & Africa Market Value Share and BPS Analysis by Application, 2025 and 2035
  • Figure 66: Middle East & Africa Market Y to o to Y Growth Comparison by Application, 2025-2035
  • Figure 67: Middle East & Africa Market Attractiveness Analysis by Application
  • Figure 68: Global Market - Tier Structure Analysis
  • Figure 69: Global Market - Company Share Analysis
Dashboard
Dashboard
Dashboard
Dashboard
Dashboard
Dashboard

Our Research Products

Full Research Suite

The "Full Research Suite" delivers actionable market intel, deep dives on markets or technologies, so clients act faster, cut risk, and unlock growth.

Competitor Leaderboard Report

The Leaderboard benchmarks and ranks top vendors, classifying them as Established Leaders, Leading Challengers, or Disruptors & Challengers.

Future Leaders Index

Locates where complements amplify value and substitutes erode it, forecasting net impact by horizon

Market Data & Forecasts

We deliver granular, decision-grade intel: market sizing, 5-year forecasts, pricing, adoption, usage, revenue, and operational KPIs—plus competitor tracking, regulation, and value chains—across 60 countries broadly.

Market Focus Report

Spot the shifts before they hit your P&L. We track inflection points, adoption curves, pricing moves, and ecosystem plays to show where demand is heading, why it is changing, and what to do next across high-growth markets and disruptive tech

Survey Report

Real-time reads of user behavior. We track shifting priorities, perceptions of today’s and next-gen services, and provider experience, then pace how fast tech moves from trial to adoption, blending buyer, consumer, and channel inputs with social signals (#WhySwitch, #UX).

Bespoke Reports

Partner with our analyst team to build a custom report designed around your business priorities. From analysing market trends to assessing competitors or crafting bespoke datasets, we tailor insights to your needs.

Supplier Intelligence

Discovery & Profiling

Capacity & Footprint

Performance & Risk

Compliance & Governance

Commercial Readiness

Who Supplies Whom

Scorecards & Shortlists

Playbooks & Docs

Category Intelligence

Definition & Scope

Demand & Use Cases

Cost Drivers

Market Structure

Supply Chain Map

Trade & Policy

Operating Norms

Deliverables

Buyer Intelligence

Account Basics

Spend & Scope

Procurement Model

Vendor Requirements

Terms & Policies

Entry Strategy

Pain Points & Triggers

Outputs

Pricing Analysis

Benchmarks

Trends

Should-Cost

Indexation

Landed Cost

Commercial Terms

Deliverables

Brand Analysis

Positioning & Value Prop

Share & Presence

Customer Evidence

Go-to-Market

Digital & Reputation

Compliance & Trust

KPIs & Gaps

Outputs

Full Research Suite comprises of:

Market outlook & trends analysis

Market outlook & trends analysis

Interviews & case studies

Interviews & case studies

Strategic recommendations

Strategic recommendations

Vendor profiles & capabilities analysis

Vendor profiles & capabilities analysis

5-year forecasts

5-year forecasts

8 regions and 60+ country-level data splits

8 regions and 60+ country-level data splits

Market segment data splits

Market segment data splits

12 months of continuous data updates

12 months of continuous data updates

DELIVERED AS:

PDF EXCEL ONLINE

Full Research Suite


$5000

$7500

$10000

Buy Report Now
Similar Industry Reports

Similar Industry Reports

Demand for Bag-In-Box Packaging in USA

Demand for Bag-In-Box Packaging in USA Size and Share Forecast Outlook 2025 to 2035

Packaging Supply Market

Packaging Supply Market Size and Share Forecast Outlook 2025 to 2035

Packaging Testing Services Market

Packaging Testing Services Market Size and Share Forecast Outlook 2025 to 2035

Packaging Tubes Market

Packaging Tubes Market Size and Share Forecast Outlook 2025 to 2035

Packaging Jar Market

Packaging Jar Market Forecast and Outlook 2025 to 2035

Packaging Barrier Film Market

Packaging Barrier Film Market Size and Share Forecast Outlook 2025 to 2035

Packaging Films Market

Packaging Films Market Size and Share Forecast Outlook 2025 to 2035

Packaging Laminate Market

Packaging Laminate Market Size and Share Forecast Outlook 2025 to 2035

Packaging Burst Strength Test Market

Packaging Burst Strength Test Market Size and Share Forecast Outlook 2025 to 2035

Packaging Tapes Market

Packaging Tapes Market Analysis - Size, Share, & Forecast Outlook 2025 to 2035

Packaging Materials Market

Packaging Materials Market Size and Share Forecast Outlook 2025 to 2035

Packaging Labels Market

Packaging Labels Market Size and Share Forecast Outlook 2025 to 2035

Packaging Equipment Market

Packaging Equipment Market Size and Share Forecast Outlook 2025 to 2035

Packaging Resins Market

Packaging Resins Market Size and Share Forecast Outlook 2025 to 2035

Packaging Inspection Systems Market

Packaging Inspection Systems Market Size and Share Forecast Outlook 2025 to 2035

Packaging Design And Simulation Technology Market

Packaging Design And Simulation Technology Market Size and Share Forecast Outlook 2025 to 2035

Packaging Suction Cups Market

Packaging Suction Cups Market Size and Share Forecast Outlook 2025 to 2035

Packaging Straps and Buckles Market

Packaging Straps and Buckles Market Size and Share Forecast Outlook 2025 to 2035

Packaging Coating Market

Packaging Coating Market Analysis - Size, Share, & Forecast Outlook 2025 to 2035

Packaging Testing Equipment Market

Packaging Testing Equipment Market Analysis & Growth 2025 to 2035

Future Market Insights

Bag-in-Box Packaging Market

Chat With MaRIA

Chat With

MaRIA

Hi There, I am MaRIA, Your Market Research Intelligence Assistant. How may I help you?