The global packaging testing services market is valued at USD 9,847 million in 2025 and is set to reach USD 17,235 million by 2035, growing at a CAGR of 5.8%. The market stands at the forefront of a transformative decade that promises to redefine quality assurance infrastructure and compliance excellence across pharmaceutical, food & beverage, electronics, and consumer goods sectors. The market's journey from USD 9,847 million in 2025 to USD 17,235 million by 2035 represents substantial growth, demonstrating the accelerating adoption of advanced testing protocols and sophisticated validation systems across barrier performance testing, migration studies, shelf-life assessment, and regulatory compliance applications.
The first half of the decade (2025-2030) will witness the market climbing from USD 9,847 million to approximately USD 12,894 million, adding USD 3,047 million in value, which constitutes 41% of the total forecast growth period. This phase will be characterized by the rapid adoption of comprehensive testing methodologies, driven by increasing demand for regulatory compliance assurance and enhanced product safety requirements worldwide. Advanced analytical capabilities and multi-parameter testing protocols will become standard expectations rather than premium options.
The latter half (2030-2035) will witness sustained growth from USD 12,894 million to USD 17,235 million, representing an addition of USD 4,341 million or 59% of the decade's expansion. This period will be defined by mass market penetration of specialized testing platforms, integration with comprehensive quality management systems, and seamless compatibility with existing manufacturing and distribution infrastructure. The market trajectory signals fundamental shifts in how brand owners and packaging manufacturers approach product validation solutions, with participants positioned to benefit from sustained demand across multiple industry segments.
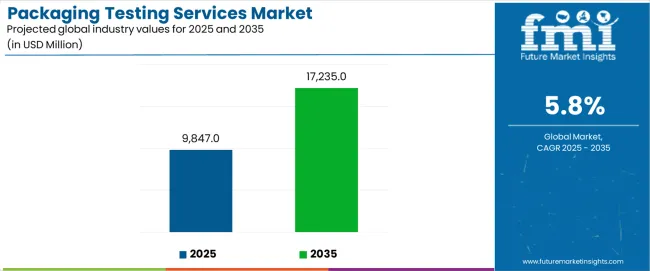
The packaging testing services market demonstrates distinct growth phases with varying market characteristics and competitive dynamics. Between 2025 and 2030, the market progresses through its regulatory compliance adoption phase, expanding from USD 9,847 million to USD 12,894 million with steady annual increments averaging 5.5% growth. This period showcases the transition from basic material testing to comprehensive validation systems with enhanced analytical precision and integrated multi-parameter assessment becoming mainstream features.
The 2025-2030 phase adds USD 3,047 million to market value, representing 41% of total decade expansion. Market maturation factors include standardization of testing protocols, declining costs for advanced analytical equipment, and increasing manufacturer awareness of testing benefits reaching 70-75% effectiveness in quality assurance applications. Competitive landscape evolution during this period features established service providers like SGS SA and Bureau Veritas expanding their testing portfolios while new entrants focus on specialized migration testing solutions and enhanced analytical technology.
From 2030 to 2035, market dynamics shift toward advanced customization and multi-industry deployment, with growth accelerating from USD 12,894 million to USD 17,235 million, adding USD 4,341 million or 59% of total expansion. This phase transition logic centers on universal testing platforms, integration with automated quality management systems, and deployment across diverse manufacturing scenarios, becoming standard rather than specialized validation formats. The competitive environment matures with focus shifting from basic testing services to comprehensive analytical performance and compatibility with real-time monitoring operations.
At-a-Glance Metrics
| Metric | Value |
|---|---|
| Market Value (2025) | USD 9,847 million |
| Market Forecast (2035) | USD 17,235 million |
| Growth Rate | 5.80% CAGR |
| Leading Service Type | Physical Testing |
| Primary End-Use | Food & Beverage Segment |
The market demonstrates strong fundamentals with Physical Testing services capturing a dominant share through superior analytical capabilities and comprehensive validation design capabilities. Food & Beverage applications drive primary demand, supported by increasing regulatory compliance requirements and advanced product safety management solutions. Geographic expansion remains concentrated in developed markets with established testing infrastructure, while emerging economies show accelerating adoption rates driven by manufacturing modernization projects and rising quality assurance activity.
The packaging testing services market represents a compelling intersection of analytical innovation, regulatory compliance enhancement, and quality assurance management. With robust growth projected from USD 9,847 million in 2025 to USD 17,235 million by 2035 at a 5.80% CAGR, this market is driven by increasing pharmaceutical expansion trends, food safety requirements, and commercial demand for comprehensive validation formats.
The market's expansion reflects a fundamental shift in how brand owners and packaging manufacturers approach quality validation infrastructure. Strong growth opportunities exist across diverse applications, from pharmaceutical operations requiring barrier performance testing to manufacturing facilities demanding comprehensive migration studies. Geographic expansion is particularly pronounced in Asia-Pacific markets, led by China (6.2% CAGR) and India (5.9% CAGR), while established markets in North America and Europe drive innovation and specialized segment development.
The dominance of Physical Testing services and Food & Beverage applications underscores the importance of proven analytical technology and regulatory compliance in driving adoption. Testing complexity and equipment investment remain key challenges, creating opportunities for companies that can deliver reliable performance while maintaining operational efficiency.
Market expansion rests on three fundamental shifts driving adoption across manufacturing and regulatory sectors. Regulatory compliance creates compelling advantages through comprehensive testing services that provide thorough product validation with enhanced safety assurance, enabling manufacturers to meet stringent requirements and reduce liability risks while maintaining market access and justifying investment over basic quality control. Manufacturing modernization accelerates as consumer brands worldwide seek advanced testing systems that deliver comprehensive validation directly to production environments, enabling quality assurance that aligns with consumer expectations and maximizes product integrity. Product safety drives adoption from brand owners requiring comprehensive analytical solutions that ensure consumer protection while maintaining performance standards during distribution and retail operations.
The growth faces headwinds from testing complexity variations that differ across analytical facilities regarding equipment capability and protocol standardization, potentially limiting performance reliability in specialized validation categories. Cost considerations also persist regarding advanced analytical equipment and specialized expertise that may increase total testing expenditure in markets with demanding regulatory standards.
Primary Classification: The market segments by service type into Physical Testing, Chemical Testing, Microbiological Testing, and Others categories, representing the evolution from basic material assessment to comprehensive analytical platforms for thorough validation operations.
Secondary Breakdown: End-use segmentation divides the market into Food & Beverage, Pharmaceutical, Personal Care & Cosmetics, Electronics, and Others sectors, reflecting distinct requirements for analytical precision, regulatory compliance, and safety validation.
Regional Classification: Geographic distribution covers North America, Europe, Asia Pacific, Latin America, and the Middle East & Africa, with developed markets leading innovation while emerging economies show accelerating growth patterns driven by manufacturing development programs.
The segmentation structure reveals technology progression from standard material testing toward integrated comprehensive platforms with enhanced analytical and validation capabilities, while application diversity spans from pharmaceutical operations to manufacturing facilities requiring thorough quality assurance and regulatory compliance solutions.
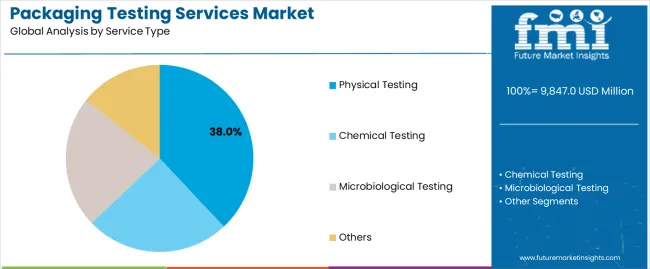
Physical Testing segment is estimated to account for 38% of the packaging testing services market share in 2025. The segment's leading position stems from its fundamental role as a critical component in material validation applications and its extensive use across multiple pharmaceutical and manufacturing sectors. Physical Testing's dominance is attributed to its comprehensive analytical capabilities, including mechanical property assessment, barrier performance evaluation, and structural integrity analysis that make it indispensable for quality assurance operations.
Market Position: Physical Testing systems command the leading position in the packaging testing services market through advanced analytical technologies, including comprehensive material characterization, performance validation protocols, and reliable testing procedures that enable manufacturers to deploy quality solutions across diverse application environments.
Value Drivers: The segment benefits from manufacturer preference for proven testing methodologies that provide comprehensive material assessment without requiring specialized analytical equipment. Efficient protocol implementation enables deployment in pharmaceutical packaging, food containers, and industrial applications where performance validation and regulatory compliance represent critical selection requirements.
Competitive Advantages: Physical Testing systems differentiate through excellent analytical precision, proven validation capabilities, and compatibility with standard manufacturing equipment that enhance quality capabilities while maintaining economical testing profiles suitable for diverse material validation applications.
Key market characteristics:
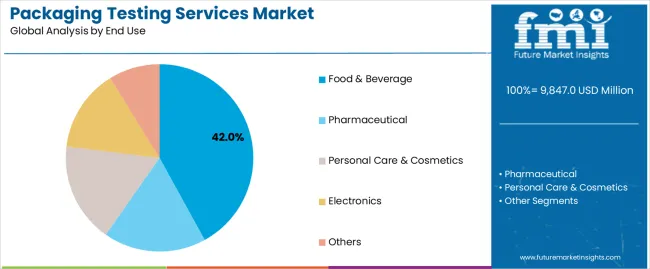
Food & Beverage segment is projected to hold 42% of the packaging testing services market share in 2025. The segment's market leadership is driven by the extensive use of packaging testing services in food containers, beverage packaging, flexible films, and protective barriers, where analytical validation serves as both a safety component and regulatory requirement. The food industry's consistent investment in quality assurance supports the segment's dominant position.
Market Context: Food & Beverage applications dominate the market due to widespread adoption of comprehensive testing protocols and increasing focus on consumer safety, product integrity, and regulatory compliance that enhance brand protection while maintaining product quality.
Appeal Factors: Food manufacturers prioritize migration testing, shelf-life validation, and integration with quality management systems that enable coordinated deployment across multiple production facilities. The segment benefits from substantial regulatory requirements and safety standards that emphasize comprehensive analytical validation for consumer protection applications.
Growth Drivers: Food safety regulations incorporate packaging testing services as standard requirements for container validation and product protection. At the same time, consumer brand initiatives are increasing demand for comprehensive testing systems that comply with food contact standards and enhance consumer confidence in product safety.
Market Challenges: Testing complexity variations and analytical cost considerations may limit deployment flexibility in ultra-high-volume production or extremely cost-sensitive scenarios.
Application dynamics include:
Growth Accelerators: Regulatory compliance drives primary adoption as comprehensive testing services provide exceptional validation capabilities that enable product safety without excessive analytical complexity, supporting cost reduction and quality enhancement that require thorough testing formats. Manufacturing innovation accelerates market growth as consumer brands seek advanced analytical solutions that maintain product integrity during production while enhancing consumer protection through refined validation design. Safety expectations increase worldwide, creating sustained demand for comprehensive testing systems that complement product development and provide competitive advantages in quality assurance.
Growth Inhibitors: Testing complexity challenges differ across analytical facilities regarding equipment capability and protocol efficiency, which may limit market penetration and throughput in high-volume categories with demanding validation requirements. Analytical cost premium persists regarding specialized equipment and expert personnel that may increase total testing expenditure in price-sensitive applications with tight budget specifications. Market fragmentation across multiple testing protocols and analytical standards creates compatibility concerns between different laboratory equipment and existing quality infrastructure.
Market Evolution Patterns: Adoption accelerates in pharmaceutical and food sectors where comprehensive validation justifies analytical investments, with geographic concentration in developed markets transitioning toward mainstream adoption in emerging economies driven by manufacturing modernization and regulatory compliance expansion. Technology development focuses on enhanced analytical precision, improved testing efficiency, and integration with automated quality systems that optimize validation performance and operational effectiveness. The market could face disruption if alternative validation methods or technology innovations significantly challenge traditional testing advantages in quality assurance applications.
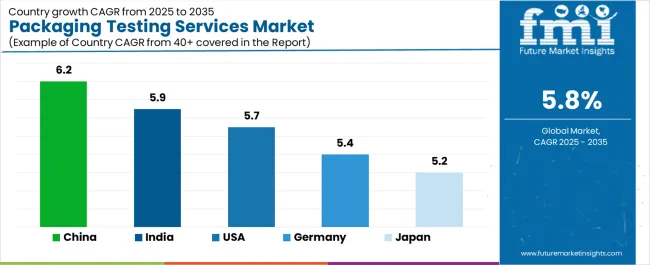
The packaging testing services market demonstrates varied regional dynamics with Growth Leaders including China (6.2% CAGR) and India (5.9% CAGR) driving expansion through manufacturing growth and regulatory modernization. Steady Performers encompass the USA (5.7% CAGR), Germany (5.4% CAGR), and Japan (5.2% CAGR), benefiting from established testing sectors and advanced analytical adoption.
| Country | CAGR (2025-2035) |
|---|---|
| China | 6.2% |
| India | 5.9% |
| USA | 5.7% |
| Germany | 5.4% |
| Japan | 5.2% |
Regional synthesis reveals Asia-Pacific markets leading growth through manufacturing expansion and regulatory development, while European countries maintain steady expansion supported by specialized analytical applications and pharmaceutical requirements. North American markets show strong growth driven by food safety and pharmaceutical packaging applications.
China establishes regional leadership through explosive manufacturing expansion and comprehensive industrial modernization, integrating advanced testing services as standard components in pharmaceutical packaging and food safety applications. The country's 6.2% CAGR through 2035 reflects industrial growth promoting quality assurance and domestic manufacturing activity that mandate the use of comprehensive testing systems in production operations. Growth concentrates in major manufacturing hubs, including Shanghai, Guangzhou, and Beijing, where industrial networks showcase integrated testing services that appeal to domestic brands seeking enhanced validation quality and international compliance standards.
Chinese manufacturers are developing innovative testing solutions that combine local analytical advantages with international validation specifications, including advanced migration studies and comprehensive barrier performance capabilities.
Strategic Market Indicators:
The Indian market emphasizes pharmaceutical applications, including rapid manufacturing development and comprehensive regulatory expansion that increasingly incorporates packaging testing services for drug containers and medical device applications. The country is projected to show a 5.9% CAGR through 2035, driven by massive pharmaceutical activity under manufacturing initiatives and commercial demand for affordable, high-quality validation systems. Indian testing laboratories prioritize cost-effectiveness with comprehensive services delivering analytical excellence through economical protocol usage and efficient testing capabilities.
Technology deployment channels include major pharmaceutical companies, food manufacturers, and regulatory agencies that support high-volume usage for domestic and export applications.
Performance Metrics:
The U.S. market emphasizes advanced testing features, including innovative analytical technologies and integration with comprehensive quality platforms that manage product validation, regulatory compliance, and safety assessment applications through unified testing systems. The country is projected to show a 5.7% CAGR through 2035, driven by pharmaceutical expansion under drug development trends and commercial demand for advanced, comprehensive testing systems. American manufacturers prioritize consumer safety with testing services delivering thorough validation through refined analytics and regulatory innovation.
Technology deployment channels include major pharmaceutical companies, food manufacturers, and specialty testing laboratories that support custom development for advanced operations.
Performance Metrics:
In Munich, Frankfurt, and Hamburg, German testing laboratories and pharmaceutical manufacturers are implementing advanced analytical systems to enhance validation capabilities and support regulatory compliance that aligns with quality protocols and manufacturing standards. The German market demonstrates sustained growth with a 5.4% CAGR through 2035, driven by pharmaceutical innovation programs and manufacturing investments that emphasize comprehensive testing systems for product and regulatory applications. German testing facilities are prioritizing analytical services that provide exceptional validation quality while maintaining compliance with environmental standards and minimizing analytical waste, particularly important in pharmaceutical packaging and specialty manufacturing operations.
Market expansion benefits from regulatory quality programs that mandate enhanced validation in testing specifications, creating sustained demand across Germany's pharmaceutical and manufacturing sectors, where analytical excellence and precision represent critical requirements.
Strategic Market Indicators:
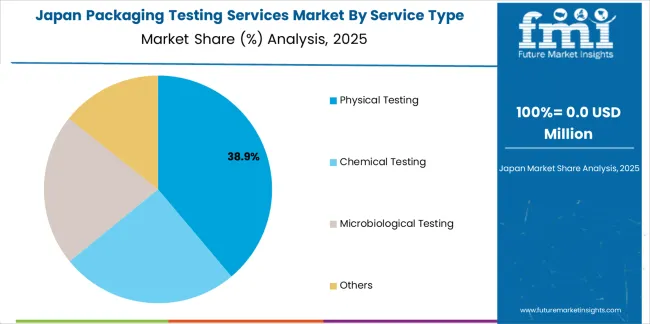
Japan's sophisticated testing market demonstrates meticulous analytical deployment, growing at 5.2% CAGR, with documented operational excellence in product validation and regulatory compliance applications through integration with existing quality systems and precision infrastructure. The country leverages engineering expertise in analytical technology and testing precision to maintain market leadership. Testing centers, including Tokyo, Osaka, and Yokohama, showcase advanced installations where analytical systems integrate with comprehensive validation platforms and quality design systems to optimize product safety and regulatory engagement.
Japanese testing laboratories prioritize analytical precision and protocol consistency in service development, creating demand for advanced testing systems with comprehensive features, including ultra-precise measurement and integration with pharmaceutical manufacturing protocols. The market benefits from established quality infrastructure and willingness to invest in specialized analytical technologies that provide superior validation quality and regulatory compliance.
Market Intelligence Brief:
The packaging testing services market in Europe is projected to grow from USD 2,753 million in 2025 to USD 4,421 million by 2035, registering a CAGR of 4.8% over the forecast period. Germany is expected to maintain its leadership position with a 35.7% market share in 2025, declining slightly to 35.2% by 2035, supported by its analytical excellence and major testing centers, including Bavaria and North Rhine-Westphalia.
France follows with a 24.8% share in 2025, projected to reach 25.3% by 2035, driven by comprehensive pharmaceutical testing and regulatory initiatives. The United Kingdom holds a 18.9% share in 2025, expected to maintain 19.2% by 2035 through established pharmaceutical sectors and manufacturing testing adoption. Italy commands a 12.1% share, while Spain accounts for 7.3% in 2025. The Rest of Europe region is anticipated to gain momentum, expanding its collective share from 1.2% to 1.8% by 2035, attributed to increasing manufacturing development in Eastern European countries and emerging Nordic pharmaceutical brands implementing comprehensive testing programs.
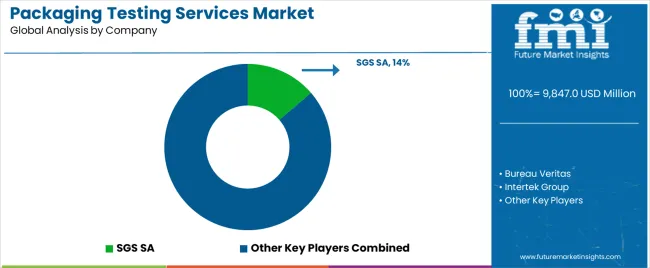
The packaging testing services market operates with moderate concentration, featuring approximately 18-25 participants, where leading companies control roughly 42-48% of the global market share through established laboratory networks and comprehensive analytical capabilities. Competition emphasizes testing precision, regulatory expertise, and analytical efficiency rather than price-based rivalry.
Market leaders encompass SGS SA, Bureau Veritas, and Intertek Group, which maintain competitive advantages through extensive analytical expertise, global laboratory networks, and comprehensive technical support capabilities that create client loyalty and support validation requirements. These companies leverage decades of testing experience and ongoing analytical technology investments to develop advanced testing services with exceptional precision and regulatory features. SGS SA leads with 14% share.
Specialty challengers include Eurofins Scientific, TÜV SÜD, and ALS Limited, which compete through specialized analytical innovation focus and efficient testing solutions that appeal to manufacturers seeking comprehensive validation formats and custom analytical flexibility. These companies differentiate through technical expertise emphasis and specialized application focus.
Market dynamics favor participants that combine reliable analytical performance with advanced laboratory support, including specialized equipment and regulatory expertise. Competitive pressure intensifies as traditional testing laboratories expand into packaging validation services. At the same time, specialized analytical providers challenge established players through innovative testing protocols and cost-effective solutions targeting emerging pharmaceutical segments.
| Item | Value |
|---|---|
| Quantitative Units | USD 9,847 million |
| Service Type | Physical Testing, Chemical Testing, Microbiological Testing, Others |
| End-Use | Food & Beverage, Pharmaceutical, Personal Care & Cosmetics, Electronics, Others |
| Regions Covered | North America, Europe, Asia Pacific, Latin America, Middle East & Africa |
| Countries Covered | U.S., Germany, Japan, China, India, and 25+ additional countries |
| Key Companies Profiled | SGS SA, Bureau Veritas, Intertek Group, Eurofins Scientific, TÜV SÜD, ALS Limited |
| Additional Attributes | Dollar sales by service type and end-use categories, regional adoption trends across North America, Europe, and Asia-Pacific, competitive landscape with testing laboratories and analytical providers, manufacturer preferences for testing precision and regulatory compliance, integration with quality management systems and analytical equipment, innovations in testing technology and analytical protocols, and development of specialized validation solutions with enhanced analytical capabilities and comprehensive regulatory features |
The global packaging testing services market is estimated to be valued at USD 9,847.0 million in 2025.
The market size for the packaging testing services market is projected to reach USD 17,235.0 million by 2035.
The packaging testing services market is expected to grow at a 5.8% CAGR between 2025 and 2035.
The key product types in packaging testing services market are physical testing , chemical testing, microbiological testing and others.
In terms of end use, food & beverage segment to command 42.0% share in the packaging testing services market in 2025.


Our Research Products

The "Full Research Suite" delivers actionable market intel, deep dives on markets or technologies, so clients act faster, cut risk, and unlock growth.

The Leaderboard benchmarks and ranks top vendors, classifying them as Established Leaders, Leading Challengers, or Disruptors & Challengers.

Locates where complements amplify value and substitutes erode it, forecasting net impact by horizon

We deliver granular, decision-grade intel: market sizing, 5-year forecasts, pricing, adoption, usage, revenue, and operational KPIs—plus competitor tracking, regulation, and value chains—across 60 countries broadly.

Spot the shifts before they hit your P&L. We track inflection points, adoption curves, pricing moves, and ecosystem plays to show where demand is heading, why it is changing, and what to do next across high-growth markets and disruptive tech

Real-time reads of user behavior. We track shifting priorities, perceptions of today’s and next-gen services, and provider experience, then pace how fast tech moves from trial to adoption, blending buyer, consumer, and channel inputs with social signals (#WhySwitch, #UX).

Partner with our analyst team to build a custom report designed around your business priorities. From analysing market trends to assessing competitors or crafting bespoke datasets, we tailor insights to your needs.
Supplier Intelligence
Discovery & Profiling
Capacity & Footprint
Performance & Risk
Compliance & Governance
Commercial Readiness
Who Supplies Whom
Scorecards & Shortlists
Playbooks & Docs
Category Intelligence
Definition & Scope
Demand & Use Cases
Cost Drivers
Market Structure
Supply Chain Map
Trade & Policy
Operating Norms
Deliverables
Buyer Intelligence
Account Basics
Spend & Scope
Procurement Model
Vendor Requirements
Terms & Policies
Entry Strategy
Pain Points & Triggers
Outputs
Pricing Analysis
Benchmarks
Trends
Should-Cost
Indexation
Landed Cost
Commercial Terms
Deliverables
Brand Analysis
Positioning & Value Prop
Share & Presence
Customer Evidence
Go-to-Market
Digital & Reputation
Compliance & Trust
KPIs & Gaps
Outputs
Full Research Suite comprises of:
Market outlook & trends analysis
Interviews & case studies
Strategic recommendations
Vendor profiles & capabilities analysis
5-year forecasts
8 regions and 60+ country-level data splits
Market segment data splits
12 months of continuous data updates
DELIVERED AS:
PDF EXCEL ONLINE
Key Players & Market Share in Packaging Testing Services Industry
Packaging Supply Market Size and Share Forecast Outlook 2025 to 2035
Packaging Tubes Market Size and Share Forecast Outlook 2025 to 2035
Packaging Jar Market Forecast and Outlook 2025 to 2035
Packaging Barrier Film Market Size and Share Forecast Outlook 2025 to 2035
Packaging Films Market Size and Share Forecast Outlook 2025 to 2035
Packaging Laminate Market Size and Share Forecast Outlook 2025 to 2035
Packaging Burst Strength Test Market Size and Share Forecast Outlook 2025 to 2035
Packaging Tapes Market Analysis - Size, Share, & Forecast Outlook 2025 to 2035
Packaging Materials Market Size and Share Forecast Outlook 2025 to 2035
Packaging Labels Market Size and Share Forecast Outlook 2025 to 2035
Packaging Equipment Market Size and Share Forecast Outlook 2025 to 2035
Packaging Resins Market Size and Share Forecast Outlook 2025 to 2035
Packaging Inspection Systems Market Size and Share Forecast Outlook 2025 to 2035
Packaging Design And Simulation Technology Market Size and Share Forecast Outlook 2025 to 2035
Packaging Suction Cups Market Size and Share Forecast Outlook 2025 to 2035
Packaging Straps and Buckles Market Size and Share Forecast Outlook 2025 to 2035
Packaging Coating Market Analysis - Size, Share, & Forecast Outlook 2025 to 2035
Packaging Bins Market Trends - Growth & Demand 2025 to 2035
Packaging Inserts Market Insights - Growth & Forecast 2025 to 2035

Thank you!
You will receive an email from our Business Development Manager. Please be sure to check your SPAM/JUNK folder too.
Chat With
MaRIA