Reports

- Global Locations -

Headquarters

Future Market Insights, Inc.

Christiana Corporate, 200
Continental Drive, Suite 401,
Newark, Delaware - 19713,
United States

T: +1-845-579-5705

Americas

Future Market Insights, Inc.

616 Corporate Way, Suite 2-9018,
Valley Cottage, NY 10989, United States

T: +1-347-918-3531

MEA

Future Market Insights

1602-6 Jumeirah Bay X2 Tower, Plot No: JLT-PH2-X2A,
Jumeirah Lakes Towers, Dubai,
United Arab Emirates

Europe

Future Market Insights

3rd Floor, 207 Regent Street,
W1B 3HH London
United Kingdom

T: + 44 (0) 20 8123 9659
D: +44 (0) 20 3287 4268

Asia Pacific

Future Market Insights

IndiaLand Global Tech Park, Unit UG-1, Behind Grand HighStreet, Phase 1, Hinjawadi, MH, Pune – 411057, India

Packaging Coating Market Outlook from 2024 to 2034

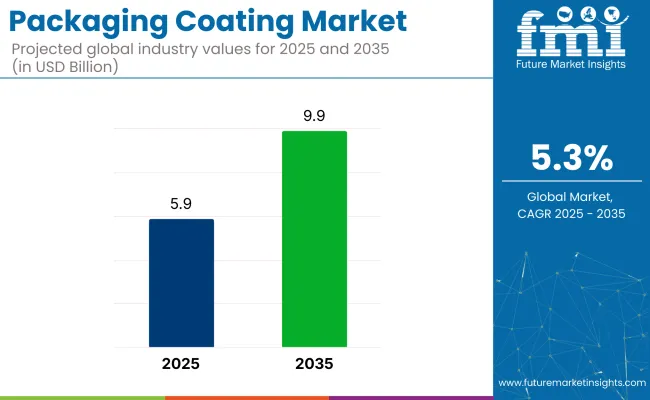
Based on recent research conducted by Future Market Insights, the global packaging coating market is poised to reach a valuation of US$ 5.4 billion by 2024. Forecasts suggest a substantial rise to US$ 9.2 billion by 2034, showcasing a notable growth trajectory. This anticipated expansion mirrors a CAGR of 5.4% during the forecast period.

Attributes Key Insights
Packaging Coating Market Estimated Size in 2024 US$ 5.4 billion
Projected Market Value in 2034 US$ 9.2 billion
Value-based CAGR from 2024 to 2034 5.4%

Don't pay for what you don't need

Customize your report by selecting specific countries or regions and save 30%!

Market Motivators Enhancing Market Growth

  • Rising demand for convenience packaging owing to features, including heat seal coatings and peelable coatings, to fuel the market growth.
  • Rising demand for sustainable packaging are in high demand, fuelling the market prospects.
  • Growth in e-commerce has led to increased demand for protective coatings that provide tamper evidence, moisture resistance, and durability.
  • Technological advancements are leading to the development of coatings with enhanced functionalities.

2019 to 2023 Historical Analysis vs. 2024 to 2034 Market Forecast Projections

A 7.1% CAGR between 2019 and 2023 was observed for the packaging coating landscape. The global market is achieving heights to grow at a moderate CAGR of 5.4% over the forecast period 2024 to 2034.

The market saw a steady growth during the historical period, due to the factors including increasing urbanization, changing consumer lifestyles, and rising demand for packaged goods across various industries.

Stringent regulations regarding food safety, health, and environmental impact influenced the choice of packaging coatings. The rapid growth of e-commerce contributed to increased demand for protective coatings that provide durability and resistance during shipping and handling.

Continued investment in research and development will lead to the introduction of innovative coating technologies with advanced functionalities. The integration of digitalization and Industry 4.0 principles into packaging production processes will drive efficiency, flexibility, and customization in coating applications.

The adoption of smart packaging solutions equipped with sensors and RFID technology will create avenues for coatings that enable connectivity, traceability, and real time monitoring. The pharmaceutical packaging market will expand further, driven by factors such as population aging, and the need for packaging coatings.

Ismail Sutaria
Ismail Sutaria

Principal Consultant

Talk to Analyst

Find your sweet spots for generating winning opportunities in this market.

Major Contributors of Packaging Coating Market

  • Collaborations and Partnerships packaging manufacturers, coating suppliers, and research institutions is fostering innovation in the packaging coating industry.
  • Investments in research and development in the packaging coating industry are leading to the introduction of new coating formulations and technologies.
  • Brand owners are increasingly using packaging as a means of brand differentiation and consumer engagement.
  • Shift towards flexible packaging is driving demand for coatings that provide barrier properties, and sealability to protect the contents and maintain product freshness.

Factors Hampering Packaging Coating Market

  • Raw material price volatility may result from factors such as changes in supply and demand dynamics, geopolitical tensions, or currency fluctuations.
  • Stringent regulatory requirements can pose challenges for packaging coating manufacturers.
  • Shift towards alternative packaging materials may face competition from companies that offer similar functionalities and sustainability benefits.
  • Consumer preferences for minimalist packaging may limit the demand for elaborate packaging coatings.

Get the data you need at a Fraction of the cost

Personalize your report by choosing insights you need
and save 40%!

Comparative View of Adjacent Industries

Future Market Insights has compared two other industries, coated paper packaging box market, and clay coated paper market. Focus on extended shelf life of packaged products help prevent spoilage and preserve product quality.

Increasing e-commerce Industry is driving demand for packaging solutions that offer protection, branding, as well as sustainability. Preference for premium packaging offer a high quality, luxurious appearance and can be customized with printing, embossing, and special finishes.

Packaging Coating Market:

Attributes Packaging Coating Market
CAGR from 2024 to 2034 5.4%
Key Trends
  • Increased use of recycled materials is driving the adoption of recycled and recyclable materials in packaging.
  • Rise of active and intelligent packaging offer added functionality beyond basic protection and containment.
Opportunity
  • Demand for anti-counterfeiting solutions has led to an increased demand for anti-counterfeiting packaging solutions.
  • Consumer preferences for healthier and natural products are accelerating the demand for packaging coatings that are free from harmful chemicals.

Coated Paper Packaging Box Market:

Attributes Coated Paper Packaging Box Market
CAGR from 2022 to 2032 4.5%
Key Trends
  • Rise in online retail and e-commerce has led to increased demand for packaging materials that offer protection, branding, and printability.
  • Coated paper packaging boxes, made from renewable materials are seen as environmentally friendly alternatives to plastic and foam packaging.
Opportunity
  • Regulatory compliance and sustainability initiatives are driving the adoption of eco-friendly packaging materials.
  • Customization allow brands to incorporate logos, graphics, and messaging to create memorable brand experiences and stand out on retail shelves.

Clay Coated Paper Market:

Attributes Clay Coated Paper Market
CAGR from 2024 to 2034 3.0%
Key Trends
  • The versatility, printability, and barrier properties of clay coated paper make it suitable for a wide range of packaging applications.
  • The food and beverage industry is a significant end user of clay coated paper, for applications such as food packaging, and disposable cups.
Opportunity
  • Clay coated paper offers excellent print quality, color reproduction, and surface smoothness, making it preferred for high end printing applications.
  • Preference for sustainable packaging is increasingly preferred by environmentally conscious consumers and businesses.

Country-wise Insights

Innovation in Functionality to Augment the Market Growth in the United States

Country The United States
CAGR through 2034 5.7%

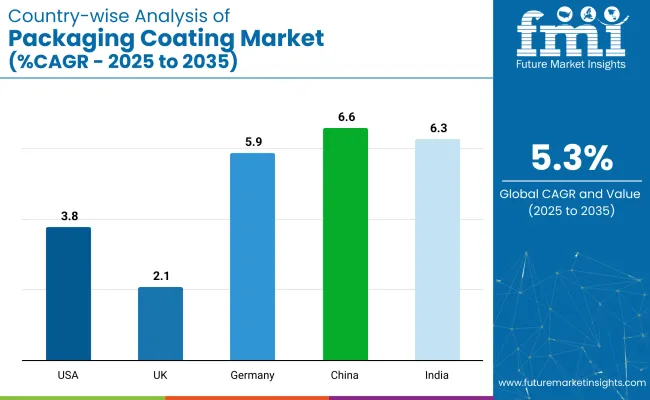
The packaging coating market in the United States will expand at a CAGR of 5.7% through 2034. Brands in the country are continually innovating in packaging design and functionality to differentiate their products and enhance consumer experience.

Packaging coatings play a crucial role in enabling innovations such as interactive packaging, smart packaging, and sustainable packaging solutions. The e-commerce sector in the United States has experienced rapid growth. There is a higher demand for protective packaging coatings that ensure product safety, integrity, and branding during shipping and handling.

Emphasis on Food Safety to Fuel the Market Aspects in the United Kingdom

Country The United Kingdom
CAGR through 2034 6.5%

The packaging coating market in the United Kingdom to expand at a CAGR of 6.5% through 2034. Stringent regulations govern food safety, health, and packaging materials in the country.

Packaging coatings must comply with these regulations to ensure consumer safety and regulatory compliance. Coatings that meet food contact safety standards and provide barrier properties are essential for food packaging applications.

The pharmaceutical and healthcare sectors in the country are experiencing growth driven by increased healthcare spending, and advancements in medical treatments. Packaging coatings that provide barrier properties, tamper evidence, and product safety are essential for pharmaceutical and healthcare packaging applications.

Expansion of Specialty and Niche Markets to Create Opportunities for the Market in China

Country China
CAGR through 2034 6.2%

Packaging coating trends in China are taking a turn for the better. A 6.2% CAGR is forecast for the country from 2024 to 2034. The country has a diverse and dynamic consumer market with a demand for specialty and niche products across various industries, including cosmetics, personal care, electronics, and pet care.

Packaging coatings that cater to the specific requirements of these markets, including luxury finishes, specialty effects, and custom branding. The Chinese government has implemented initiatives and regulations aimed at reducing environmental pollution, and improving packaging safety and quality.

Packaging coatings that meet regulatory standards for food contact materials and health, are in demand to ensure compliance and consumer trust.

Health Concerns Will Accelerate the Market Growth in Japan

Country Japan
CAGR through 2034 7.1%

The packaging coating market in Japan is poised to expand at a CAGR of 7.1% through 2034. Japanese consumers prioritize product safety, hygiene, and quality when it comes to packaged goods.

Packaging coatings that provide barrier properties, tamper evidence, and product protection are essential for maintaining product freshness, integrity, and safety throughout the supply chain.

Japanese consumers value high quality as well as aesthetically pleasing packaging that conveys product quality, authenticity, and craftsmanship. Packaging coatings play a crucial role in enhancing the visual appeal and branding of packaged products, allowing brands to create unique and distinctive packaging designs that resonate with Japanese consumers.

Rapid Industrialization to Stimulate the the Market Prospects in Korea

Country Korea
CAGR through 2034 6.9%

The packaging coating market in Korea will expand at a CAGR of 6.9% through 2034. Rapid industrialization and economic growth in Korea have led to increased consumer spending and demand for packaged goods across various sectors.

The expansion of industries such as manufacturing, retail, and logistics fuels the need for packaging coatings to protect and enhance the presentation of products. The healthcare and pharmaceutical sectors in the country are growing due to aging population, and advancements in medical treatments.

Packaging coatings that provide barrier properties, tamper evidence, and product safety are essential for pharmaceutical packaging applications to ensure product efficacy and compliance with regulatory standards.

Category-wise Insights

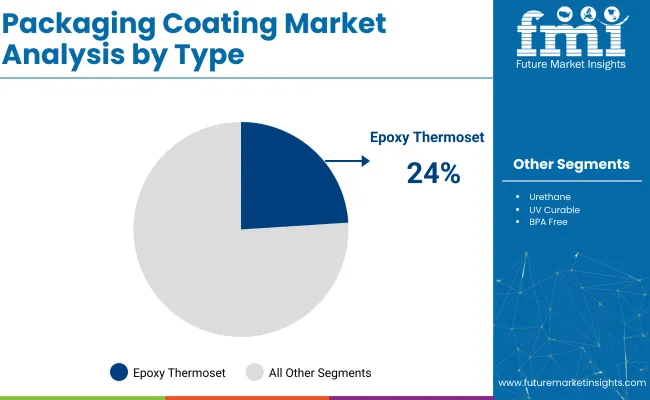
The below table highlights how epoxy thermoset segment is leading the market in terms of type, and will account for a CAGR of 5.2% through 2034. Based on end user, the food and beverage segment is gaining heights and will to account for a CAGR of 5.0% through 2034.

Category CAGR through 2034
Epoxy Thermoset 5.2%
Food and Beverage 5.0%

Epoxy Thermoset Segment Witnesses High Demand for Packaging Coating

Based on type, the epoxy thermoset segment will dominate the packaging coating market. Epoxy thermoset coatings exhibit high chemical resistance, making them suitable for packaging applications where exposure to acids, alkalis, and other corrosive substances is a concern.

The property ensures the integrity and safety of packaged products, particularly in industries such as chemicals and pharmaceuticals. Epoxy thermoset coatings offer excellent barrier properties against moisture, oxygen, and other environmental factors.

The coatings help to protect packaged products from degradation, spoilage, and contamination, making them ideal for food, pharmaceutical, and other sensitive products.

Food and Beverage Segment to Hold High Demand for Packaging Coating

In terms of end user, the food and beverage segment will dominate the packaging coating market. Packaging coatings allow brands to differentiate their products through attractive designs, vibrant colors, and high quality printing.

In the competitive food and beverage market, visually appealing packaging plays a key role in attracting the attention of consumers, communicating brand identity, and influencing purchase decisions.

Consumers prefer food and beverage products with longer shelf life, freshness, and quality. Packaging coatings with barrier properties, oxygen and moisture resistance, and UV protection help extend the shelf life of packaged products. The protection is led by preventing spoilage, oxidation, and deterioration, thereby meeting consumer expectations and reducing food waste.

Competitive Landscape

The competitive landscape of the packaging coating market is characterized by a diverse range of players, including multinational corporations, regional players, and niche manufacturers.

Company Portfolio

  • PPG Industries is a leading global supplier of paints, coatings, and specialty materials. The company offers a comprehensive portfolio of packaging coatings for applications such as metal packaging, food and beverage packaging, and industrial packaging.
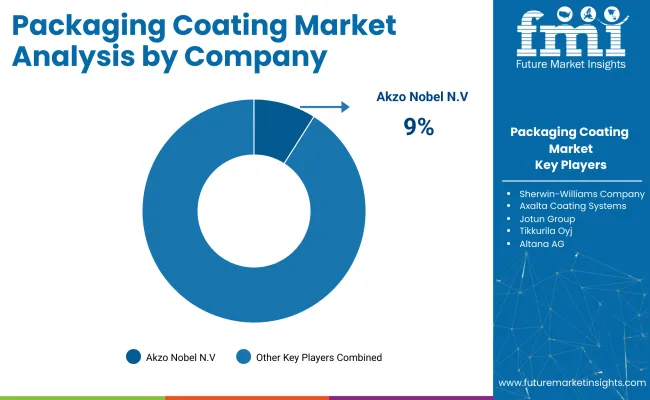
  • AkzoNobel is a multinational company specializing in paints and coatings. It provides innovative packaging coating solutions for metal packaging, flexible packaging, and paperboard packaging applications.

Key Coverage in the Packaging Coating Industry Report

  • Packaging coating trends
  • Coating solutions for packaging
  • Sustainable packaging coatings
  • Innovative packaging coating technologies
  • Protective coatings for packaging
  • Printing Inks Market
  • Adhesives and Sealants Market
  • Flexible Packaging Market

Report Scope

Attribute Details
Estimated Market Size in 2024 US$ 5.4 billion
Projected Market Valuation in 2034 US$ 9.2 billion
Value-based CAGR 2024 to 2034 5.4%
Forecast Period 2024 to 2034
Historical Data Available for 2019 to 2023
Market Analysis Value in US$ Billion
Key Regions Covered
  • North America
  • Latin America
  • Western Europe
  • Eastern Europe
  • South Asia and Pacific
  • East Asia
  • The Middle East & Africa
Key Market Segments Covered
  • Type
  • Application
  • End User
  • Region
Key Countries Profiled
  • The United States
  • Canada
  • Brazil
  • Mexico
  • Germany
  • France
  • France
  • Spain
  • Italy
  • Russia
  • Poland
  • Czech Republic
  • Romania
  • India
  • Bangladesh
  • Australia
  • New Zealand
  • China
  • Japan
  • South Korea
  • GCC countries
  • South Africa
  • Israel
Key Companies Profiled
  • Akzo Nobel N.V.
  • PPG Industries, Inc.
  • Sherwin-Williams Company
  • Axalta Coating Systems
  • RPM International Inc.
  • Kansai Paint Co., Ltd.
  • Jotun Group
  • Tikkurila Oyj
  • Nippon Paint Holdings Co., Ltd.
  • Altana AG
  • Fujikura Kasei Co., Ltd.
  • Toyo Ink SC Holdings Co., Ltd.
  • Dymax Corporation
  • Michelman, Inc.
  • Follmann GmbH & Co. KG

Segmentation Analysis of the Packaging Coating Market

By Type:

  • Epoxy Thermoset
  • Urethane
  • UV Curable
  • BPA Free
  • Soft Touch UV Curable and Urethane

By Application:

  • Food Cans
  • Beverage Cans
  • Caps and Closures
  • Aerosols and Tubes
  • Industrial Packaging
  • Promotional Packaging
  • Specialty Packaging

By End User:

  • Food and Beverages
  • Cosmetics
  • Pharmaceuticals
  • Consumer Electronics
  • Automotive Components

By Region:

  • North America
  • Latin America
  • Western Europe
  • Eastern Europe
  • South Asia and Pacific
  • East Asia
  • The Middle East and Africa

Frequently Asked Questions

What is the anticipated value of the Packaging Coating market in 2024?

The packaging coating market is projected to reach a valuation of US$ 5.4 billion in 2024.

What is the expected CAGR for the Packaging Coating market until 2034?

The packaging coating industry is set to expand by a CAGR of 5.4% through 2034.

How much valuation is projected for the Packaging Coating market in 2034?

The packaging coating market is forecast to reach US$ 9.2 billion by 2034.

Which country is projected to lead the Packaging Coating market?

Japan is set to be the top performing market, exhibiting a CAGR of 7.1% through 2034.

Which is the dominant type in the Packaging Coating domain?

Epoxy thermoset segment is preferred, and will account for a CAGR of 5.2% through 2034.

Table of Content

1. Executive Summary

    1.1. Global Market Outlook

    1.2. Demand-side Trends

    1.3. Supply-side Trends

    1.4. Technology Roadmap Analysis

    1.5. Analysis and Recommendations

2. Market Overview

    2.1. Market Coverage / Taxonomy

    2.2. Market Definition / Scope / Limitations

3. Market Background

    3.1. Market Dynamics

        3.1.1. Drivers

        3.1.2. Restraints

        3.1.3. Opportunity

        3.1.4. Trends

    3.2. Scenario Forecast

        3.2.1. Demand in Optimistic Scenario

        3.2.2. Demand in Likely Scenario

        3.2.3. Demand in Conservative Scenario

    3.3. Opportunity Map Analysis

    3.4. Product Life Cycle Analysis

    3.5. Supply Chain Analysis

        3.5.1. Supply Side Participants and their Roles

            3.5.1.1. Manufacturer

        3.5.2. Value Added and Value Created at Node in the Supply Chain

        3.5.3. List of Raw Material Suppliers

        3.5.4. List of Existing and Potential Buyer’s

    3.6. Investment Feasibility Matrix

    3.7. Value Chain Analysis

        3.7.1. Profit Margin Analysis

    3.8. PESTLE and Porter’s Analysis

    3.9. Regulatory Landscape

        3.9.1. By Key Regions

        3.9.2. By Key Countries

    3.10. Regional Parent Market Outlook

    3.11. Production and Consumption Statistics

    3.12. Import and Export Statistics

4. Global Market Analysis 2019 to 2023 and Forecast, 2024 to 2034

    4.1. Historical Market Size Value (US$ Million) & Volume (Tons) Analysis, 2019 to 2023

    4.2. Current and Future Market Size Value (US$ Million) & Volume (Tons) Projections, 2024 to 2034

        4.2.1. Y-o-Y Growth Trend Analysis

        4.2.2. Absolute $ Opportunity Analysis

5. Global Market Analysis 2019 to 2023 and Forecast 2024 to 2034, By Type

    5.1. Introduction / Key Findings

    5.2. Historical Market Size Value (US$ Million) & Volume (Tons) Analysis By Type, 2019 to 2023

    5.3. Current and Future Market Size Value (US$ Million) & Volume (Tons) Analysis and Forecast By Type, 2024 to 2034

        5.3.1. Epoxy Thermoset

        5.3.2. Urethane

        5.3.3. UV-Curable

        5.3.4. BPA Free

        5.3.5. Soft Touch UV-Curable & Urethane

    5.4. Y-o-Y Growth Trend Analysis By Type, 2019 to 2023

    5.5. Absolute $ Opportunity Analysis By Type, 2024 to 2034

6. Global Market Analysis 2019 to 2023 and Forecast 2024 to 2034, By Application

    6.1. Introduction / Key Findings

    6.2. Historical Market Size Value (US$ Million) & Volume (Tons) Analysis By Application, 2019 to 2023

    6.3. Current and Future Market Size Value (US$ Million) & Volume (Tons) Analysis and Forecast By Application, 2024 to 2034

        6.3.1. Food Cans

        6.3.2. Beverage Cans

        6.3.3. Caps & Closures

        6.3.4. Aerosols & Tubes

        6.3.5. Industrial Packaging

        6.3.6. Promotional Packaging

        6.3.7. Specialty Packaging

    6.4. Y-o-Y Growth Trend Analysis By Application, 2019 to 2023

    6.5. Absolute $ Opportunity Analysis By Application, 2024 to 2034

7. Global Market Analysis 2019 to 2023 and Forecast 2024 to 2034, By End User

    7.1. Introduction / Key Findings

    7.2. Historical Market Size Value (US$ Million) & Volume (Tons) Analysis By End User, 2019 to 2023

    7.3. Current and Future Market Size Value (US$ Million) & Volume (Tons) Analysis and Forecast By End User, 2024 to 2034

        7.3.1. Food & Beverages

        7.3.2. Cosmetics

        7.3.3. Pharmaceuticals

        7.3.4. Consumer Electronics

        7.3.5. Automotive Components

    7.4. Y-o-Y Growth Trend Analysis By End User, 2019 to 2023

    7.5. Absolute $ Opportunity Analysis By End User, 2024 to 2034

8. Global Market Analysis 2019 to 2023 and Forecast 2024 to 2034, By Region

    8.1. Introduction

    8.2. Historical Market Size Value (US$ Million) & Volume (Tons) Analysis By Region, 2019 to 2023

    8.3. Current Market Size Value (US$ Million) & Volume (Tons) Analysis and Forecast By Region, 2024 to 2034

        8.3.1. North America

        8.3.2. Latin America

        8.3.3. Western Europe

        8.3.4. Eastern Europe

        8.3.5. South Asia and Pacific

        8.3.6. East Asia

        8.3.7. Middle East and Africa

    8.4. Market Attractiveness Analysis By Region

9. North America Market Analysis 2019 to 2023 and Forecast 2024 to 2034, By Country

    9.1. Historical Market Size Value (US$ Million) & Volume (Tons) Trend Analysis By Market Taxonomy, 2019 to 2023

    9.2. Market Size Value (US$ Million) & Volume (Tons) Forecast By Market Taxonomy, 2024 to 2034

        9.2.1. By Country

            9.2.1.1. USA

            9.2.1.2. Canada

        9.2.2. By Type

        9.2.3. By Application

        9.2.4. By End User

    9.3. Market Attractiveness Analysis

        9.3.1. By Country

        9.3.2. By Type

        9.3.3. By Application

        9.3.4. By End User

    9.4. Key Takeaways

10. Latin America Market Analysis 2019 to 2023 and Forecast 2024 to 2034, By Country

    10.1. Historical Market Size Value (US$ Million) & Volume (Tons) Trend Analysis By Market Taxonomy, 2019 to 2023

    10.2. Market Size Value (US$ Million) & Volume (Tons) Forecast By Market Taxonomy, 2024 to 2034

        10.2.1. By Country

            10.2.1.1. Brazil

            10.2.1.2. Mexico

            10.2.1.3. Rest of Latin America

        10.2.2. By Type

        10.2.3. By Application

        10.2.4. By End User

    10.3. Market Attractiveness Analysis

        10.3.1. By Country

        10.3.2. By Type

        10.3.3. By Application

        10.3.4. By End User

    10.4. Key Takeaways

11. Western Europe Market Analysis 2019 to 2023 and Forecast 2024 to 2034, By Country

    11.1. Historical Market Size Value (US$ Million) & Volume (Tons) Trend Analysis By Market Taxonomy, 2019 to 2023

    11.2. Market Size Value (US$ Million) & Volume (Tons) Forecast By Market Taxonomy, 2024 to 2034

        11.2.1. By Country

            11.2.1.1. Germany

            11.2.1.2. UK

            11.2.1.3. France

            11.2.1.4. Spain

            11.2.1.5. Italy

            11.2.1.6. Rest of Western Europe

        11.2.2. By Type

        11.2.3. By Application

        11.2.4. By End User

    11.3. Market Attractiveness Analysis

        11.3.1. By Country

        11.3.2. By Type

        11.3.3. By Application

        11.3.4. By End User

    11.4. Key Takeaways

12. Eastern Europe Market Analysis 2019 to 2023 and Forecast 2024 to 2034, By Country

    12.1. Historical Market Size Value (US$ Million) & Volume (Tons) Trend Analysis By Market Taxonomy, 2019 to 2023

    12.2. Market Size Value (US$ Million) & Volume (Tons) Forecast By Market Taxonomy, 2024 to 2034

        12.2.1. By Country

            12.2.1.1. Poland

            12.2.1.2. Russia

            12.2.1.3. Czech Republic

            12.2.1.4. Romania

            12.2.1.5. Rest of Eastern Europe

        12.2.2. By Type

        12.2.3. By Application

        12.2.4. By End User

    12.3. Market Attractiveness Analysis

        12.3.1. By Country

        12.3.2. By Type

        12.3.3. By Application

        12.3.4. By End User

    12.4. Key Takeaways

13. South Asia and Pacific Market Analysis 2019 to 2023 and Forecast 2024 to 2034, By Country

    13.1. Historical Market Size Value (US$ Million) & Volume (Tons) Trend Analysis By Market Taxonomy, 2019 to 2023

    13.2. Market Size Value (US$ Million) & Volume (Tons) Forecast By Market Taxonomy, 2024 to 2034

        13.2.1. By Country

            13.2.1.1. India

            13.2.1.2. Bangladesh

            13.2.1.3. Australia

            13.2.1.4. New Zealand

            13.2.1.5. Rest of South Asia and Pacific

        13.2.2. By Type

        13.2.3. By Application

        13.2.4. By End User

    13.3. Market Attractiveness Analysis

        13.3.1. By Country

        13.3.2. By Type

        13.3.3. By Application

        13.3.4. By End User

    13.4. Key Takeaways

14. East Asia Market Analysis 2019 to 2023 and Forecast 2024 to 2034, By Country

    14.1. Historical Market Size Value (US$ Million) & Volume (Tons) Trend Analysis By Market Taxonomy, 2019 to 2023

    14.2. Market Size Value (US$ Million) & Volume (Tons) Forecast By Market Taxonomy, 2024 to 2034

        14.2.1. By Country

            14.2.1.1. China

            14.2.1.2. Japan

            14.2.1.3. South Korea

        14.2.2. By Type

        14.2.3. By Application

        14.2.4. By End User

    14.3. Market Attractiveness Analysis

        14.3.1. By Country

        14.3.2. By Type

        14.3.3. By Application

        14.3.4. By End User

    14.4. Key Takeaways

15. Middle East and Africa Market Analysis 2019 to 2023 and Forecast 2024 to 2034, By Country

    15.1. Historical Market Size Value (US$ Million) & Volume (Tons) Trend Analysis By Market Taxonomy, 2019 to 2023

    15.2. Market Size Value (US$ Million) & Volume (Tons) Forecast By Market Taxonomy, 2024 to 2034

        15.2.1. By Country

            15.2.1.1. GCC Countries

            15.2.1.2. South Africa

            15.2.1.3. Israel

            15.2.1.4. Rest of MEA

        15.2.2. By Type

        15.2.3. By Application

        15.2.4. By End User

    15.3. Market Attractiveness Analysis

        15.3.1. By Country

        15.3.2. By Type

        15.3.3. By Application

        15.3.4. By End User

    15.4. Key Takeaways

16. Key Countries Market Analysis

    16.1. USA

        16.1.1. Pricing Analysis

        16.1.2. Market Share Analysis, 2023

            16.1.2.1. By Type

            16.1.2.2. By Application

            16.1.2.3. By End User

    16.2. Canada

        16.2.1. Pricing Analysis

        16.2.2. Market Share Analysis, 2023

            16.2.2.1. By Type

            16.2.2.2. By Application

            16.2.2.3. By End User

    16.3. Brazil

        16.3.1. Pricing Analysis

        16.3.2. Market Share Analysis, 2023

            16.3.2.1. By Type

            16.3.2.2. By Application

            16.3.2.3. By End User

    16.4. Mexico

        16.4.1. Pricing Analysis

        16.4.2. Market Share Analysis, 2023

            16.4.2.1. By Type

            16.4.2.2. By Application

            16.4.2.3. By End User

    16.5. Germany

        16.5.1. Pricing Analysis

        16.5.2. Market Share Analysis, 2023

            16.5.2.1. By Type

            16.5.2.2. By Application

            16.5.2.3. By End User

    16.6. UK

        16.6.1. Pricing Analysis

        16.6.2. Market Share Analysis, 2023

            16.6.2.1. By Type

            16.6.2.2. By Application

            16.6.2.3. By End User

    16.7. France

        16.7.1. Pricing Analysis

        16.7.2. Market Share Analysis, 2023

            16.7.2.1. By Type

            16.7.2.2. By Application

            16.7.2.3. By End User

    16.8. Spain

        16.8.1. Pricing Analysis

        16.8.2. Market Share Analysis, 2023

            16.8.2.1. By Type

            16.8.2.2. By Application

            16.8.2.3. By End User

    16.9. Italy

        16.9.1. Pricing Analysis

        16.9.2. Market Share Analysis, 2023

            16.9.2.1. By Type

            16.9.2.2. By Application

            16.9.2.3. By End User

    16.10. Poland

        16.10.1. Pricing Analysis

        16.10.2. Market Share Analysis, 2023

            16.10.2.1. By Type

            16.10.2.2. By Application

            16.10.2.3. By End User

    16.11. Russia

        16.11.1. Pricing Analysis

        16.11.2. Market Share Analysis, 2023

            16.11.2.1. By Type

            16.11.2.2. By Application

            16.11.2.3. By End User

    16.12. Czech Republic

        16.12.1. Pricing Analysis

        16.12.2. Market Share Analysis, 2023

            16.12.2.1. By Type

            16.12.2.2. By Application

            16.12.2.3. By End User

    16.13. Romania

        16.13.1. Pricing Analysis

        16.13.2. Market Share Analysis, 2023

            16.13.2.1. By Type

            16.13.2.2. By Application

            16.13.2.3. By End User

    16.14. India

        16.14.1. Pricing Analysis

        16.14.2. Market Share Analysis, 2023

            16.14.2.1. By Type

            16.14.2.2. By Application

            16.14.2.3. By End User

    16.15. Bangladesh

        16.15.1. Pricing Analysis

        16.15.2. Market Share Analysis, 2023

            16.15.2.1. By Type

            16.15.2.2. By Application

            16.15.2.3. By End User

    16.16. Australia

        16.16.1. Pricing Analysis

        16.16.2. Market Share Analysis, 2023

            16.16.2.1. By Type

            16.16.2.2. By Application

            16.16.2.3. By End User

    16.17. New Zealand

        16.17.1. Pricing Analysis

        16.17.2. Market Share Analysis, 2023

            16.17.2.1. By Type

            16.17.2.2. By Application

            16.17.2.3. By End User

    16.18. China

        16.18.1. Pricing Analysis

        16.18.2. Market Share Analysis, 2023

            16.18.2.1. By Type

            16.18.2.2. By Application

            16.18.2.3. By End User

    16.19. Japan

        16.19.1. Pricing Analysis

        16.19.2. Market Share Analysis, 2023

            16.19.2.1. By Type

            16.19.2.2. By Application

            16.19.2.3. By End User

    16.20. South Korea

        16.20.1. Pricing Analysis

        16.20.2. Market Share Analysis, 2023

            16.20.2.1. By Type

            16.20.2.2. By Application

            16.20.2.3. By End User

    16.21. GCC Countries

        16.21.1. Pricing Analysis

        16.21.2. Market Share Analysis, 2023

            16.21.2.1. By Type

            16.21.2.2. By Application

            16.21.2.3. By End User

    16.22. South Africa

        16.22.1. Pricing Analysis

        16.22.2. Market Share Analysis, 2023

            16.22.2.1. By Type

            16.22.2.2. By Application

            16.22.2.3. By End User

    16.23. Israel

        16.23.1. Pricing Analysis

        16.23.2. Market Share Analysis, 2023

            16.23.2.1. By Type

            16.23.2.2. By Application

            16.23.2.3. By End User

17. Market Structure Analysis

    17.1. Competition Dashboard

    17.2. Competition Benchmarking

    17.3. Market Share Analysis of Top Players

        17.3.1. By Regional

        17.3.2. By Type

        17.3.3. By Application

        17.3.4. By End User

18. Competition Analysis

    18.1. Competition Deep Dive

        18.1.1. Akzo Nobel N.V.

            18.1.1.1. Overview

            18.1.1.2. Product Portfolio

            18.1.1.3. Profitability by Market Segments

            18.1.1.4. Sales Footprint

            18.1.1.5. Strategy Overview

                18.1.1.5.1. Marketing Strategy

                18.1.1.5.2. Product Strategy

                18.1.1.5.3. Channel Strategy

        18.1.2. PPG Industries, Inc.

            18.1.2.1. Overview

            18.1.2.2. Product Portfolio

            18.1.2.3. Profitability by Market Segments

            18.1.2.4. Sales Footprint

            18.1.2.5. Strategy Overview

                18.1.2.5.1. Marketing Strategy

                18.1.2.5.2. Product Strategy

                18.1.2.5.3. Channel Strategy

        18.1.3. Sherwin-Williams Company

            18.1.3.1. Overview

            18.1.3.2. Product Portfolio

            18.1.3.3. Profitability by Market Segments

            18.1.3.4. Sales Footprint

            18.1.3.5. Strategy Overview

                18.1.3.5.1. Marketing Strategy

                18.1.3.5.2. Product Strategy

                18.1.3.5.3. Channel Strategy

        18.1.4. Axalta Coating Systems

            18.1.4.1. Overview

            18.1.4.2. Product Portfolio

            18.1.4.3. Profitability by Market Segments

            18.1.4.4. Sales Footprint

            18.1.4.5. Strategy Overview

                18.1.4.5.1. Marketing Strategy

                18.1.4.5.2. Product Strategy

                18.1.4.5.3. Channel Strategy

        18.1.5. RPM International Inc.

            18.1.5.1. Overview

            18.1.5.2. Product Portfolio

            18.1.5.3. Profitability by Market Segments

            18.1.5.4. Sales Footprint

            18.1.5.5. Strategy Overview

                18.1.5.5.1. Marketing Strategy

                18.1.5.5.2. Product Strategy

                18.1.5.5.3. Channel Strategy

        18.1.6. Kansai Paint Co., Ltd.

            18.1.6.1. Overview

            18.1.6.2. Product Portfolio

            18.1.6.3. Profitability by Market Segments

            18.1.6.4. Sales Footprint

            18.1.6.5. Strategy Overview

                18.1.6.5.1. Marketing Strategy

                18.1.6.5.2. Product Strategy

                18.1.6.5.3. Channel Strategy

        18.1.7. Jotun Group

            18.1.7.1. Overview

            18.1.7.2. Product Portfolio

            18.1.7.3. Profitability by Market Segments

            18.1.7.4. Sales Footprint

            18.1.7.5. Strategy Overview

                18.1.7.5.1. Marketing Strategy

                18.1.7.5.2. Product Strategy

                18.1.7.5.3. Channel Strategy

        18.1.8. Tikkurila Oyj

            18.1.8.1. Overview

            18.1.8.2. Product Portfolio

            18.1.8.3. Profitability by Market Segments

            18.1.8.4. Sales Footprint

            18.1.8.5. Strategy Overview

                18.1.8.5.1. Marketing Strategy

                18.1.8.5.2. Product Strategy

                18.1.8.5.3. Channel Strategy

        18.1.9. Nippon Paint Holdings Co., Ltd.

            18.1.9.1. Overview

            18.1.9.2. Product Portfolio

            18.1.9.3. Profitability by Market Segments

            18.1.9.4. Sales Footprint

            18.1.9.5. Strategy Overview

                18.1.9.5.1. Marketing Strategy

                18.1.9.5.2. Product Strategy

                18.1.9.5.3. Channel Strategy

        18.1.10. Altana AG

            18.1.10.1. Overview

            18.1.10.2. Product Portfolio

            18.1.10.3. Profitability by Market Segments

            18.1.10.4. Sales Footprint

            18.1.10.5. Strategy Overview

                18.1.10.5.1. Marketing Strategy

                18.1.10.5.2. Product Strategy

                18.1.10.5.3. Channel Strategy

        18.1.11. Fujikura Kasei Co., Ltd.

            18.1.11.1. Overview

            18.1.11.2. Product Portfolio

            18.1.11.3. Profitability by Market Segments

            18.1.11.4. Sales Footprint

            18.1.11.5. Strategy Overview

                18.1.11.5.1. Marketing Strategy

                18.1.11.5.2. Product Strategy

                18.1.11.5.3. Channel Strategy

        18.1.12. Toyo Ink SC Holdings Co., Ltd.

            18.1.12.1. Overview

            18.1.12.2. Product Portfolio

            18.1.12.3. Profitability by Market Segments

            18.1.12.4. Sales Footprint

            18.1.12.5. Strategy Overview

                18.1.12.5.1. Marketing Strategy

                18.1.12.5.2. Product Strategy

                18.1.12.5.3. Channel Strategy

        18.1.13. Dymax Corporation

            18.1.13.1. Overview

            18.1.13.2. Product Portfolio

            18.1.13.3. Profitability by Market Segments

            18.1.13.4. Sales Footprint

            18.1.13.5. Strategy Overview

                18.1.13.5.1. Marketing Strategy

                18.1.13.5.2. Product Strategy

                18.1.13.5.3. Channel Strategy

        18.1.14. Michelman, Inc.

            18.1.14.1. Overview

            18.1.14.2. Product Portfolio

            18.1.14.3. Profitability by Market Segments

            18.1.14.4. Sales Footprint

            18.1.14.5. Strategy Overview

                18.1.14.5.1. Marketing Strategy

                18.1.14.5.2. Product Strategy

                18.1.14.5.3. Channel Strategy

        18.1.15. Follmann GmbH & Co. KG

            18.1.15.1. Overview

            18.1.15.2. Product Portfolio

            18.1.15.3. Profitability by Market Segments

            18.1.15.4. Sales Footprint

            18.1.15.5. Strategy Overview

                18.1.15.5.1. Marketing Strategy

                18.1.15.5.2. Product Strategy

                18.1.15.5.3. Channel Strategy

19. Assumptions & Acronyms Used

20. Research Methodology

List of Tables

Table 1: Global Market Value (US$ Million) Forecast by Region, 2019 to 2034

Table 2: Global Market Volume (Tons) Forecast by Region, 2019 to 2034

Table 3: Global Market Value (US$ Million) Forecast by Type, 2019 to 2034

Table 4: Global Market Volume (Tons) Forecast by Type, 2019 to 2034

Table 5: Global Market Value (US$ Million) Forecast by Application, 2019 to 2034

Table 6: Global Market Volume (Tons) Forecast by Application, 2019 to 2034

Table 7: Global Market Value (US$ Million) Forecast by End User, 2019 to 2034

Table 8: Global Market Volume (Tons) Forecast by End User, 2019 to 2034

Table 9: North America Market Value (US$ Million) Forecast by Country, 2019 to 2034

Table 10: North America Market Volume (Tons) Forecast by Country, 2019 to 2034

Table 11: North America Market Value (US$ Million) Forecast by Type, 2019 to 2034

Table 12: North America Market Volume (Tons) Forecast by Type, 2019 to 2034

Table 13: North America Market Value (US$ Million) Forecast by Application, 2019 to 2034

Table 14: North America Market Volume (Tons) Forecast by Application, 2019 to 2034

Table 15: North America Market Value (US$ Million) Forecast by End User, 2019 to 2034

Table 16: North America Market Volume (Tons) Forecast by End User, 2019 to 2034

Table 17: Latin America Market Value (US$ Million) Forecast by Country, 2019 to 2034

Table 18: Latin America Market Volume (Tons) Forecast by Country, 2019 to 2034

Table 19: Latin America Market Value (US$ Million) Forecast by Type, 2019 to 2034

Table 20: Latin America Market Volume (Tons) Forecast by Type, 2019 to 2034

Table 21: Latin America Market Value (US$ Million) Forecast by Application, 2019 to 2034

Table 22: Latin America Market Volume (Tons) Forecast by Application, 2019 to 2034

Table 23: Latin America Market Value (US$ Million) Forecast by End User, 2019 to 2034

Table 24: Latin America Market Volume (Tons) Forecast by End User, 2019 to 2034

Table 25: Western Europe Market Value (US$ Million) Forecast by Country, 2019 to 2034

Table 26: Western Europe Market Volume (Tons) Forecast by Country, 2019 to 2034

Table 27: Western Europe Market Value (US$ Million) Forecast by Type, 2019 to 2034

Table 28: Western Europe Market Volume (Tons) Forecast by Type, 2019 to 2034

Table 29: Western Europe Market Value (US$ Million) Forecast by Application, 2019 to 2034

Table 30: Western Europe Market Volume (Tons) Forecast by Application, 2019 to 2034

Table 31: Western Europe Market Value (US$ Million) Forecast by End User, 2019 to 2034

Table 32: Western Europe Market Volume (Tons) Forecast by End User, 2019 to 2034

Table 33: Eastern Europe Market Value (US$ Million) Forecast by Country, 2019 to 2034

Table 34: Eastern Europe Market Volume (Tons) Forecast by Country, 2019 to 2034

Table 35: Eastern Europe Market Value (US$ Million) Forecast by Type, 2019 to 2034

Table 36: Eastern Europe Market Volume (Tons) Forecast by Type, 2019 to 2034

Table 37: Eastern Europe Market Value (US$ Million) Forecast by Application, 2019 to 2034

Table 38: Eastern Europe Market Volume (Tons) Forecast by Application, 2019 to 2034

Table 39: Eastern Europe Market Value (US$ Million) Forecast by End User, 2019 to 2034

Table 40: Eastern Europe Market Volume (Tons) Forecast by End User, 2019 to 2034

Table 41: South Asia and Pacific Market Value (US$ Million) Forecast by Country, 2019 to 2034

Table 42: South Asia and Pacific Market Volume (Tons) Forecast by Country, 2019 to 2034

Table 43: South Asia and Pacific Market Value (US$ Million) Forecast by Type, 2019 to 2034

Table 44: South Asia and Pacific Market Volume (Tons) Forecast by Type, 2019 to 2034

Table 45: South Asia and Pacific Market Value (US$ Million) Forecast by Application, 2019 to 2034

Table 46: South Asia and Pacific Market Volume (Tons) Forecast by Application, 2019 to 2034

Table 47: South Asia and Pacific Market Value (US$ Million) Forecast by End User, 2019 to 2034

Table 48: South Asia and Pacific Market Volume (Tons) Forecast by End User, 2019 to 2034

Table 49: East Asia Market Value (US$ Million) Forecast by Country, 2019 to 2034

Table 50: East Asia Market Volume (Tons) Forecast by Country, 2019 to 2034

Table 51: East Asia Market Value (US$ Million) Forecast by Type, 2019 to 2034

Table 52: East Asia Market Volume (Tons) Forecast by Type, 2019 to 2034

Table 53: East Asia Market Value (US$ Million) Forecast by Application, 2019 to 2034

Table 54: East Asia Market Volume (Tons) Forecast by Application, 2019 to 2034

Table 55: East Asia Market Value (US$ Million) Forecast by End User, 2019 to 2034

Table 56: East Asia Market Volume (Tons) Forecast by End User, 2019 to 2034

Table 57: Middle East and Africa Market Value (US$ Million) Forecast by Country, 2019 to 2034

Table 58: Middle East and Africa Market Volume (Tons) Forecast by Country, 2019 to 2034

Table 59: Middle East and Africa Market Value (US$ Million) Forecast by Type, 2019 to 2034

Table 60: Middle East and Africa Market Volume (Tons) Forecast by Type, 2019 to 2034

Table 61: Middle East and Africa Market Value (US$ Million) Forecast by Application, 2019 to 2034

Table 62: Middle East and Africa Market Volume (Tons) Forecast by Application, 2019 to 2034

Table 63: Middle East and Africa Market Value (US$ Million) Forecast by End User, 2019 to 2034

Table 64: Middle East and Africa Market Volume (Tons) Forecast by End User, 2019 to 2034

List of Charts

Figure 1: Global Market Value (US$ Million) by Type, 2024 to 2034

Figure 2: Global Market Value (US$ Million) by Application, 2024 to 2034

Figure 3: Global Market Value (US$ Million) by End User, 2024 to 2034

Figure 4: Global Market Value (US$ Million) by Region, 2024 to 2034

Figure 5: Global Market Value (US$ Million) Analysis by Region, 2019 to 2034

Figure 6: Global Market Volume (Tons) Analysis by Region, 2019 to 2034

Figure 7: Global Market Value Share (%) and BPS Analysis by Region, 2024 to 2034

Figure 8: Global Market Y-o-Y Growth (%) Projections by Region, 2024 to 2034

Figure 9: Global Market Value (US$ Million) Analysis by Type, 2019 to 2034

Figure 10: Global Market Volume (Tons) Analysis by Type, 2019 to 2034

Figure 11: Global Market Value Share (%) and BPS Analysis by Type, 2024 to 2034

Figure 12: Global Market Y-o-Y Growth (%) Projections by Type, 2024 to 2034

Figure 13: Global Market Value (US$ Million) Analysis by Application, 2019 to 2034

Figure 14: Global Market Volume (Tons) Analysis by Application, 2019 to 2034

Figure 15: Global Market Value Share (%) and BPS Analysis by Application, 2024 to 2034

Figure 16: Global Market Y-o-Y Growth (%) Projections by Application, 2024 to 2034

Figure 17: Global Market Value (US$ Million) Analysis by End User, 2019 to 2034

Figure 18: Global Market Volume (Tons) Analysis by End User, 2019 to 2034

Figure 19: Global Market Value Share (%) and BPS Analysis by End User, 2024 to 2034

Figure 20: Global Market Y-o-Y Growth (%) Projections by End User, 2024 to 2034

Figure 21: Global Market Attractiveness by Type, 2024 to 2034

Figure 22: Global Market Attractiveness by Application, 2024 to 2034

Figure 23: Global Market Attractiveness by End User, 2024 to 2034

Figure 24: Global Market Attractiveness by Region, 2024 to 2034

Figure 25: North America Market Value (US$ Million) by Type, 2024 to 2034

Figure 26: North America Market Value (US$ Million) by Application, 2024 to 2034

Figure 27: North America Market Value (US$ Million) by End User, 2024 to 2034

Figure 28: North America Market Value (US$ Million) by Country, 2024 to 2034

Figure 29: North America Market Value (US$ Million) Analysis by Country, 2019 to 2034

Figure 30: North America Market Volume (Tons) Analysis by Country, 2019 to 2034

Figure 31: North America Market Value Share (%) and BPS Analysis by Country, 2024 to 2034

Figure 32: North America Market Y-o-Y Growth (%) Projections by Country, 2024 to 2034

Figure 33: North America Market Value (US$ Million) Analysis by Type, 2019 to 2034

Figure 34: North America Market Volume (Tons) Analysis by Type, 2019 to 2034

Figure 35: North America Market Value Share (%) and BPS Analysis by Type, 2024 to 2034

Figure 36: North America Market Y-o-Y Growth (%) Projections by Type, 2024 to 2034

Figure 37: North America Market Value (US$ Million) Analysis by Application, 2019 to 2034

Figure 38: North America Market Volume (Tons) Analysis by Application, 2019 to 2034

Figure 39: North America Market Value Share (%) and BPS Analysis by Application, 2024 to 2034

Figure 40: North America Market Y-o-Y Growth (%) Projections by Application, 2024 to 2034

Figure 41: North America Market Value (US$ Million) Analysis by End User, 2019 to 2034

Figure 42: North America Market Volume (Tons) Analysis by End User, 2019 to 2034

Figure 43: North America Market Value Share (%) and BPS Analysis by End User, 2024 to 2034

Figure 44: North America Market Y-o-Y Growth (%) Projections by End User, 2024 to 2034

Figure 45: North America Market Attractiveness by Type, 2024 to 2034

Figure 46: North America Market Attractiveness by Application, 2024 to 2034

Figure 47: North America Market Attractiveness by End User, 2024 to 2034

Figure 48: North America Market Attractiveness by Country, 2024 to 2034

Figure 49: Latin America Market Value (US$ Million) by Type, 2024 to 2034

Figure 50: Latin America Market Value (US$ Million) by Application, 2024 to 2034

Figure 51: Latin America Market Value (US$ Million) by End User, 2024 to 2034

Figure 52: Latin America Market Value (US$ Million) by Country, 2024 to 2034

Figure 53: Latin America Market Value (US$ Million) Analysis by Country, 2019 to 2034

Figure 54: Latin America Market Volume (Tons) Analysis by Country, 2019 to 2034

Figure 55: Latin America Market Value Share (%) and BPS Analysis by Country, 2024 to 2034

Figure 56: Latin America Market Y-o-Y Growth (%) Projections by Country, 2024 to 2034

Figure 57: Latin America Market Value (US$ Million) Analysis by Type, 2019 to 2034

Figure 58: Latin America Market Volume (Tons) Analysis by Type, 2019 to 2034

Figure 59: Latin America Market Value Share (%) and BPS Analysis by Type, 2024 to 2034

Figure 60: Latin America Market Y-o-Y Growth (%) Projections by Type, 2024 to 2034

Figure 61: Latin America Market Value (US$ Million) Analysis by Application, 2019 to 2034

Figure 62: Latin America Market Volume (Tons) Analysis by Application, 2019 to 2034

Figure 63: Latin America Market Value Share (%) and BPS Analysis by Application, 2024 to 2034

Figure 64: Latin America Market Y-o-Y Growth (%) Projections by Application, 2024 to 2034

Figure 65: Latin America Market Value (US$ Million) Analysis by End User, 2019 to 2034

Figure 66: Latin America Market Volume (Tons) Analysis by End User, 2019 to 2034

Figure 67: Latin America Market Value Share (%) and BPS Analysis by End User, 2024 to 2034

Figure 68: Latin America Market Y-o-Y Growth (%) Projections by End User, 2024 to 2034

Figure 69: Latin America Market Attractiveness by Type, 2024 to 2034

Figure 70: Latin America Market Attractiveness by Application, 2024 to 2034

Figure 71: Latin America Market Attractiveness by End User, 2024 to 2034

Figure 72: Latin America Market Attractiveness by Country, 2024 to 2034

Figure 73: Western Europe Market Value (US$ Million) by Type, 2024 to 2034

Figure 74: Western Europe Market Value (US$ Million) by Application, 2024 to 2034

Figure 75: Western Europe Market Value (US$ Million) by End User, 2024 to 2034

Figure 76: Western Europe Market Value (US$ Million) by Country, 2024 to 2034

Figure 77: Western Europe Market Value (US$ Million) Analysis by Country, 2019 to 2034

Figure 78: Western Europe Market Volume (Tons) Analysis by Country, 2019 to 2034

Figure 79: Western Europe Market Value Share (%) and BPS Analysis by Country, 2024 to 2034

Figure 80: Western Europe Market Y-o-Y Growth (%) Projections by Country, 2024 to 2034

Figure 81: Western Europe Market Value (US$ Million) Analysis by Type, 2019 to 2034

Figure 82: Western Europe Market Volume (Tons) Analysis by Type, 2019 to 2034

Figure 83: Western Europe Market Value Share (%) and BPS Analysis by Type, 2024 to 2034

Figure 84: Western Europe Market Y-o-Y Growth (%) Projections by Type, 2024 to 2034

Figure 85: Western Europe Market Value (US$ Million) Analysis by Application, 2019 to 2034

Figure 86: Western Europe Market Volume (Tons) Analysis by Application, 2019 to 2034

Figure 87: Western Europe Market Value Share (%) and BPS Analysis by Application, 2024 to 2034

Figure 88: Western Europe Market Y-o-Y Growth (%) Projections by Application, 2024 to 2034

Figure 89: Western Europe Market Value (US$ Million) Analysis by End User, 2019 to 2034

Figure 90: Western Europe Market Volume (Tons) Analysis by End User, 2019 to 2034

Figure 91: Western Europe Market Value Share (%) and BPS Analysis by End User, 2024 to 2034

Figure 92: Western Europe Market Y-o-Y Growth (%) Projections by End User, 2024 to 2034

Figure 93: Western Europe Market Attractiveness by Type, 2024 to 2034

Figure 94: Western Europe Market Attractiveness by Application, 2024 to 2034

Figure 95: Western Europe Market Attractiveness by End User, 2024 to 2034

Figure 96: Western Europe Market Attractiveness by Country, 2024 to 2034

Figure 97: Eastern Europe Market Value (US$ Million) by Type, 2024 to 2034

Figure 98: Eastern Europe Market Value (US$ Million) by Application, 2024 to 2034

Figure 99: Eastern Europe Market Value (US$ Million) by End User, 2024 to 2034

Figure 100: Eastern Europe Market Value (US$ Million) by Country, 2024 to 2034

Figure 101: Eastern Europe Market Value (US$ Million) Analysis by Country, 2019 to 2034

Figure 102: Eastern Europe Market Volume (Tons) Analysis by Country, 2019 to 2034

Figure 103: Eastern Europe Market Value Share (%) and BPS Analysis by Country, 2024 to 2034

Figure 104: Eastern Europe Market Y-o-Y Growth (%) Projections by Country, 2024 to 2034

Figure 105: Eastern Europe Market Value (US$ Million) Analysis by Type, 2019 to 2034

Figure 106: Eastern Europe Market Volume (Tons) Analysis by Type, 2019 to 2034

Figure 107: Eastern Europe Market Value Share (%) and BPS Analysis by Type, 2024 to 2034

Figure 108: Eastern Europe Market Y-o-Y Growth (%) Projections by Type, 2024 to 2034

Figure 109: Eastern Europe Market Value (US$ Million) Analysis by Application, 2019 to 2034

Figure 110: Eastern Europe Market Volume (Tons) Analysis by Application, 2019 to 2034

Figure 111: Eastern Europe Market Value Share (%) and BPS Analysis by Application, 2024 to 2034

Figure 112: Eastern Europe Market Y-o-Y Growth (%) Projections by Application, 2024 to 2034

Figure 113: Eastern Europe Market Value (US$ Million) Analysis by End User, 2019 to 2034

Figure 114: Eastern Europe Market Volume (Tons) Analysis by End User, 2019 to 2034

Figure 115: Eastern Europe Market Value Share (%) and BPS Analysis by End User, 2024 to 2034

Figure 116: Eastern Europe Market Y-o-Y Growth (%) Projections by End User, 2024 to 2034

Figure 117: Eastern Europe Market Attractiveness by Type, 2024 to 2034

Figure 118: Eastern Europe Market Attractiveness by Application, 2024 to 2034

Figure 119: Eastern Europe Market Attractiveness by End User, 2024 to 2034

Figure 120: Eastern Europe Market Attractiveness by Country, 2024 to 2034

Figure 121: South Asia and Pacific Market Value (US$ Million) by Type, 2024 to 2034

Figure 122: South Asia and Pacific Market Value (US$ Million) by Application, 2024 to 2034

Figure 123: South Asia and Pacific Market Value (US$ Million) by End User, 2024 to 2034

Figure 124: South Asia and Pacific Market Value (US$ Million) by Country, 2024 to 2034

Figure 125: South Asia and Pacific Market Value (US$ Million) Analysis by Country, 2019 to 2034

Figure 126: South Asia and Pacific Market Volume (Tons) Analysis by Country, 2019 to 2034

Figure 127: South Asia and Pacific Market Value Share (%) and BPS Analysis by Country, 2024 to 2034

Figure 128: South Asia and Pacific Market Y-o-Y Growth (%) Projections by Country, 2024 to 2034

Figure 129: South Asia and Pacific Market Value (US$ Million) Analysis by Type, 2019 to 2034

Figure 130: South Asia and Pacific Market Volume (Tons) Analysis by Type, 2019 to 2034

Figure 131: South Asia and Pacific Market Value Share (%) and BPS Analysis by Type, 2024 to 2034

Figure 132: South Asia and Pacific Market Y-o-Y Growth (%) Projections by Type, 2024 to 2034

Figure 133: South Asia and Pacific Market Value (US$ Million) Analysis by Application, 2019 to 2034

Figure 134: South Asia and Pacific Market Volume (Tons) Analysis by Application, 2019 to 2034

Figure 135: South Asia and Pacific Market Value Share (%) and BPS Analysis by Application, 2024 to 2034

Figure 136: South Asia and Pacific Market Y-o-Y Growth (%) Projections by Application, 2024 to 2034

Figure 137: South Asia and Pacific Market Value (US$ Million) Analysis by End User, 2019 to 2034

Figure 138: South Asia and Pacific Market Volume (Tons) Analysis by End User, 2019 to 2034

Figure 139: South Asia and Pacific Market Value Share (%) and BPS Analysis by End User, 2024 to 2034

Figure 140: South Asia and Pacific Market Y-o-Y Growth (%) Projections by End User, 2024 to 2034

Figure 141: South Asia and Pacific Market Attractiveness by Type, 2024 to 2034

Figure 142: South Asia and Pacific Market Attractiveness by Application, 2024 to 2034

Figure 143: South Asia and Pacific Market Attractiveness by End User, 2024 to 2034

Figure 144: South Asia and Pacific Market Attractiveness by Country, 2024 to 2034

Figure 145: East Asia Market Value (US$ Million) by Type, 2024 to 2034

Figure 146: East Asia Market Value (US$ Million) by Application, 2024 to 2034

Figure 147: East Asia Market Value (US$ Million) by End User, 2024 to 2034

Figure 148: East Asia Market Value (US$ Million) by Country, 2024 to 2034

Figure 149: East Asia Market Value (US$ Million) Analysis by Country, 2019 to 2034

Figure 150: East Asia Market Volume (Tons) Analysis by Country, 2019 to 2034

Figure 151: East Asia Market Value Share (%) and BPS Analysis by Country, 2024 to 2034

Figure 152: East Asia Market Y-o-Y Growth (%) Projections by Country, 2024 to 2034

Figure 153: East Asia Market Value (US$ Million) Analysis by Type, 2019 to 2034

Figure 154: East Asia Market Volume (Tons) Analysis by Type, 2019 to 2034

Figure 155: East Asia Market Value Share (%) and BPS Analysis by Type, 2024 to 2034

Figure 156: East Asia Market Y-o-Y Growth (%) Projections by Type, 2024 to 2034

Figure 157: East Asia Market Value (US$ Million) Analysis by Application, 2019 to 2034

Figure 158: East Asia Market Volume (Tons) Analysis by Application, 2019 to 2034

Figure 159: East Asia Market Value Share (%) and BPS Analysis by Application, 2024 to 2034

Figure 160: East Asia Market Y-o-Y Growth (%) Projections by Application, 2024 to 2034

Figure 161: East Asia Market Value (US$ Million) Analysis by End User, 2019 to 2034

Figure 162: East Asia Market Volume (Tons) Analysis by End User, 2019 to 2034

Figure 163: East Asia Market Value Share (%) and BPS Analysis by End User, 2024 to 2034

Figure 164: East Asia Market Y-o-Y Growth (%) Projections by End User, 2024 to 2034

Figure 165: East Asia Market Attractiveness by Type, 2024 to 2034

Figure 166: East Asia Market Attractiveness by Application, 2024 to 2034

Figure 167: East Asia Market Attractiveness by End User, 2024 to 2034

Figure 168: East Asia Market Attractiveness by Country, 2024 to 2034

Figure 169: Middle East and Africa Market Value (US$ Million) by Type, 2024 to 2034

Figure 170: Middle East and Africa Market Value (US$ Million) by Application, 2024 to 2034

Figure 171: Middle East and Africa Market Value (US$ Million) by End User, 2024 to 2034

Figure 172: Middle East and Africa Market Value (US$ Million) by Country, 2024 to 2034

Figure 173: Middle East and Africa Market Value (US$ Million) Analysis by Country, 2019 to 2034

Figure 174: Middle East and Africa Market Volume (Tons) Analysis by Country, 2019 to 2034

Figure 175: Middle East and Africa Market Value Share (%) and BPS Analysis by Country, 2024 to 2034

Figure 176: Middle East and Africa Market Y-o-Y Growth (%) Projections by Country, 2024 to 2034

Figure 177: Middle East and Africa Market Value (US$ Million) Analysis by Type, 2019 to 2034

Figure 178: Middle East and Africa Market Volume (Tons) Analysis by Type, 2019 to 2034

Figure 179: Middle East and Africa Market Value Share (%) and BPS Analysis by Type, 2024 to 2034

Figure 180: Middle East and Africa Market Y-o-Y Growth (%) Projections by Type, 2024 to 2034

Figure 181: Middle East and Africa Market Value (US$ Million) Analysis by Application, 2019 to 2034

Figure 182: Middle East and Africa Market Volume (Tons) Analysis by Application, 2019 to 2034

Figure 183: Middle East and Africa Market Value Share (%) and BPS Analysis by Application, 2024 to 2034

Figure 184: Middle East and Africa Market Y-o-Y Growth (%) Projections by Application, 2024 to 2034

Figure 185: Middle East and Africa Market Value (US$ Million) Analysis by End User, 2019 to 2034

Figure 186: Middle East and Africa Market Volume (Tons) Analysis by End User, 2019 to 2034

Figure 187: Middle East and Africa Market Value Share (%) and BPS Analysis by End User, 2024 to 2034

Figure 188: Middle East and Africa Market Y-o-Y Growth (%) Projections by End User, 2024 to 2034

Figure 189: Middle East and Africa Market Attractiveness by Type, 2024 to 2034

Figure 190: Middle East and Africa Market Attractiveness by Application, 2024 to 2034

Figure 191: Middle East and Africa Market Attractiveness by End User, 2024 to 2034

Figure 192: Middle East and Africa Market Attractiveness by Country, 2024 to 2034

Recommendations

Packaging

Clay Coated Paper Market

Published : March 2024

Packaging

Packaging Bins Market

Published : May 2023

Packaging

Coated Paper Packaging Box Market

Published : December 2022

Packaging

Packaging Tapes Market

Published : December 2022

Explore Packaging Insights

View Reports