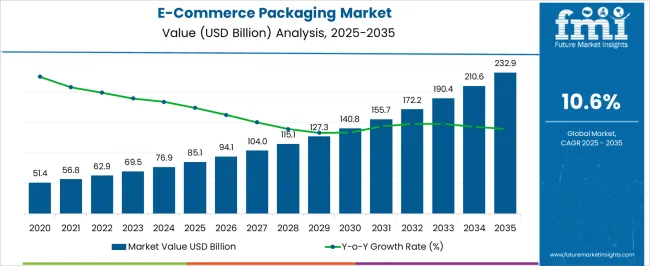
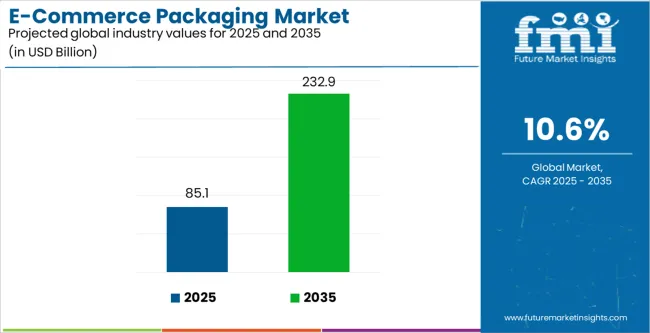
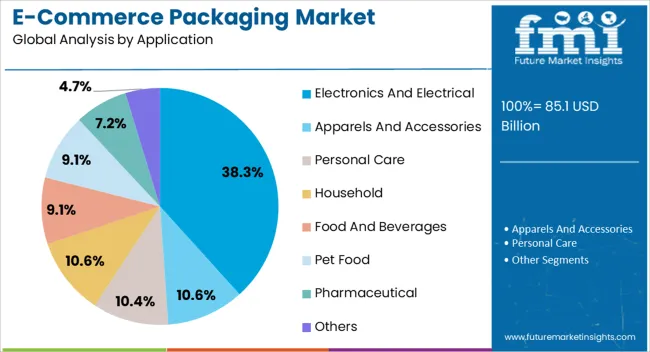
The e-commerce packaging market is estimated to be valued at USD 76.9 billion in 2024. E-commerce packaging is predicted to rise at a CAGR of 10.6% from 2024 to 2034. The global e-commerce packaging market is anticipated to reach USD 210 billion by 2034.
The e-commerce packaging market is experiencing growth globally, driven by the increasing adoption of online shopping. As consumers shift towards convenient and seamless online transactions, the demand for efficient, secure, and sustainable packaging solutions is on the rise.
The surge in e-commerce activities, driven by technological advancements, changing consumer behavior, and the convenience of online shopping, is a primary driver. Customization, sustainability, and the integration of technology into packaging solutions are key trends shaping the market.
Attributes | Key Insights |
---|---|
Estimated Market Size in 2024 | USD 76.9 billion |
Projected Market Value in 2034 | USD 210 billion |
Value-based CAGR from 2024 to 2034 | 10.6% |
From 2019 to 2023, the E-commerce packaging market experienced a CAGR of 11.4% in market value. The widespread adoption of smart packaging technologies, including the prevalence of QR codes and RFID tags, has emerged as a prominent trend in e-commerce packaging market.
These technologies not only furnish consumers with additional product information but also contribute to an elevated and enriched shopping experience overall.
E-commerce packaging is expected to increasingly rely on recyclable materials, biodegradable options, and circular economy practices to address environmental concerns.
The integration of technology into packaging will continue to advance. Smart packaging features will likely become more sophisticated, providing real-time tracking, product authentication, and interactive content for consumers. Projections indicate that the global e-commerce packaging market is expected to experience a CAGR of 10.6% from 2024 to 2034.
Historical CAGR from 2019 to 2023 | 11.4% |
---|---|
Forecast CAGR from 2024 to 2034 | 10.6% |
The following table shows the top five countries by revenue, led by South Korea and Japan. Japanese consumers place a high value on the quality of products and their packaging.
E-commerce businesses operating in Japan prioritize packaging solutions that not only protect the products during transit but also reflect a commitment to quality and excellence.
Countries | The Forecast CAGRs from 2024 to 2034 |
---|---|
United States | 10.8% |
United Kingdom | 11.7% |
China | 11.3% |
Japan | 11.8% |
South Korea | 12.8% |
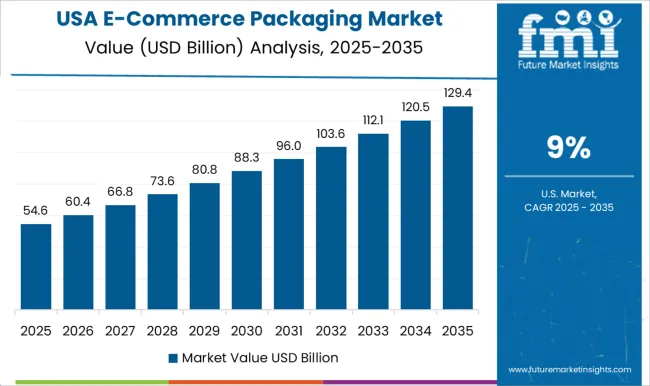
The e-commerce packaging market in the United States is expected to grow with a CAGR of 10.8% from 2024 to 2034. The growth of the market in the country is attributed to a continuous increase in e-commerce adoption, with more consumers turning to online shopping platforms.
Growing emphasis on sustainability in the packaging industry, including e-commerce. Consumers are increasingly conscious of environmental issues, prompting businesses to adopt eco-friendly packaging materials. The demand for sustainable packaging options is likely to influence the market.
The e-commerce packaging market in China is expected to grow with a CAGR of 11.3% from 2024 to 2034. The presence of a large consumer base, increased internet penetration, and a growing middle class drive the market growth in China. The surge in online retail transactions has likely contributed to a parallel growth in the demand for specialized e-commerce packaging.
China is known for its rapid adoption of technology. Innovations in packaging technology, including smart packaging with features such as QR codes, NFC tags, or augmented reality elements, might contribute to the growth of the e-commerce packaging market.
The e-commerce packaging market in the United Kingdom is expected to grow with a CAGR of 11.7% from 2024 to 2034. The surge in e-commerce adoption within the United Kingdom has prompted a notable shift in consumer behavior towards online shopping. This change is driving heightened demand for customized e-commerce packaging solutions that cater specifically to the unique requirements of digital retailers.
The United Kingdom has seen a significant rise in e-commerce adoption, with consumers increasingly turning to online shopping. This trend has likely contributed to an increased demand for specialized e-commerce packaging solutions tailored to the needs of online retailers.
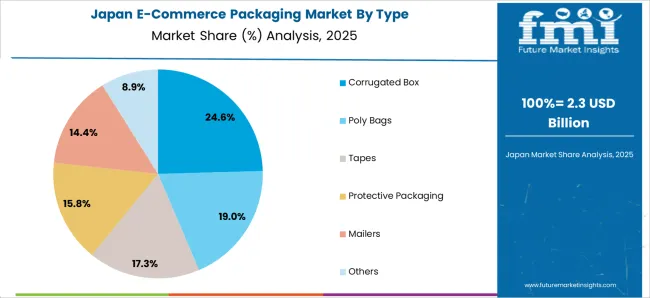
Growing consumer inclination towards online shopping. This surge in online retail activities has likely led to an expanded demand for specialized e-commerce packaging solutions in Japan.
E-commerce packaging in Japan may focus on visually appealing designs, contributing to a positive unboxing experience for customers. Japanese culture often places importance on aesthetics and presentation in packaging. The e-commerce packaging market in Japan is expected to grow with a CAGR of 11.8% from 2024 to 2034.
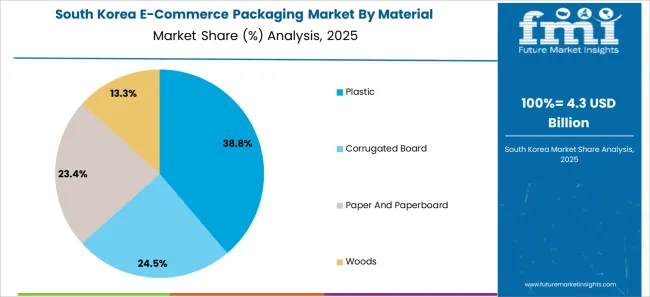
The e-commerce packaging market in South Korea is expected to grow with a CAGR of 12.8% from 2024 to 2034. South Korea has witnessed rapid growth in e-commerce, driven by factors such as increased internet penetration, smartphone usage, and a tech-savvy consumer base. The surge in online shopping has led to a proportional increase in the demand for efficient and tailored e-commerce packaging solutions. The urbanization trend in South Korea, coupled with busy lifestyles, has encouraged more consumers to turn to online platforms for their shopping needs. As a result, the demand for convenient and secure packaging that accommodates various product types has risen significantly.
South Korea engages in significant cross-border e-commerce, contributing to the need for packaging solutions that can withstand international shipping and comply with diverse regulatory requirements.
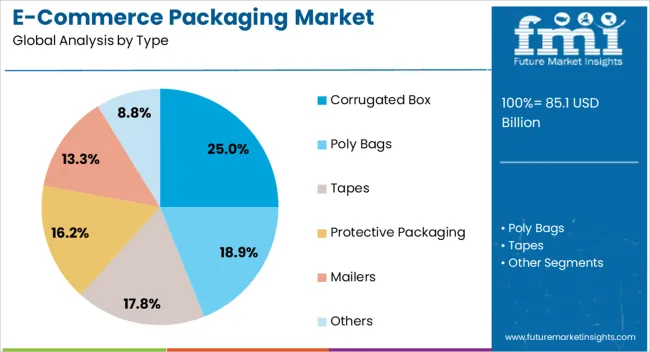
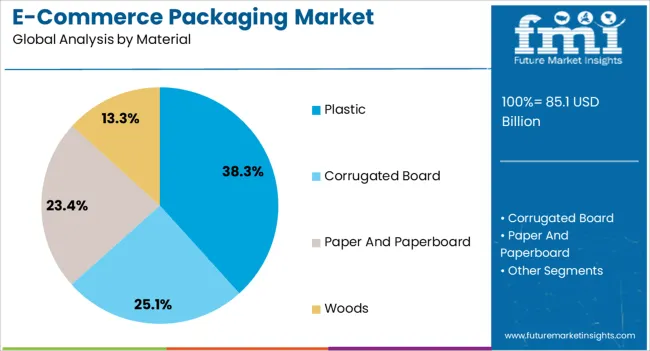
The below section shows the leading segment. The corrugated box segment is expected to register a CAGR of 10.4% from 2024 to 2034. Based on material, the plastic segment is anticipated to hold a dominant share through 2034. It is set to exhibit a CAGR of 10.1% from 2024 to 2034.
Category | CAGR |
---|---|
Corrugated Box | 10.4% |
Plastic | 10.1% |
Based on product, the corrugated box segment is anticipated to thrive at a CAGR of 10.4% from 2024 to 2034. Corrugated boxes can be easily customized to suit various product sizes and shapes. The versatility of corrugated packaging allows for the creation of boxes that fit snugly around the products, providing a protective cushion and reducing the risk of damage during shipping.
Corrugated boxes are generally cost-effective compared to alternative packaging materials. This is particularly important for e-commerce businesses that often operate on thin profit margins and need packaging solutions that offer a balance between affordability and functionality.
The emphasis on sustainability and eco-friendly packaging has led to an increased preference for corrugated boxes. They are made from recyclable materials, and many corrugated boxes themselves are recyclable. This aligns with the growing consumer and industry awareness of environmental concerns.
Based on material, the plastic segment is projected to rise at a 10.1% CAGR through 2034. Plastic materials, such as polyethylene (PE) and polypropylene (PP), are highly versatile and flexible. They can be molded and shaped to accommodate various product sizes and shapes, providing an adaptable packaging solution for the diverse range of products sold in e-commerce.
Plastic packaging is generally lightweight, which contributes to cost savings in shipping. This is particularly important in the e-commerce sector, where shipping costs can significantly impact overall expenses. Lightweight packaging can also reduce the carbon footprint associated with transportation.
Plastic packaging provides a high level of protection against moisture, dust, and other environmental elements. This is crucial for products that may be sensitive to such conditions during transportation and storage.
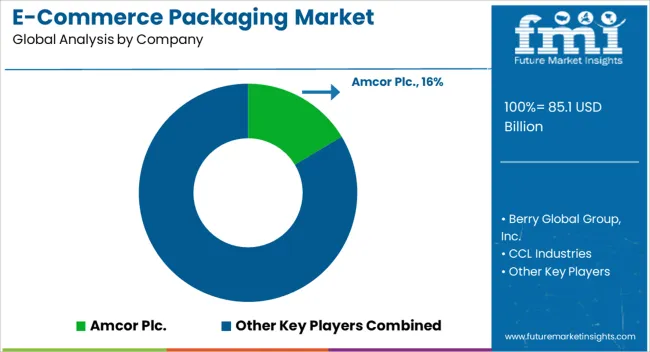
Companies in the e-commerce packaging sector are engaged in mergers and acquisitions to strengthen their market position, expand their product portfolios, or acquire new technologies.
Such strategic moves aim to enhance competitiveness and capture a larger share of the market. Some companies in the e-commerce packaging market have been actively working on developing and implementing sustainable packaging solutions.
Attributes | Details |
---|---|
Estimated Market Size in 2024 | USD 76.9 billion |
Projected Market Valuation in 2034 | USD 210 billion |
Value-based CAGR 2024 to 2034 | 10.6% |
Forecast Period | 2024 to 2034 |
Historical Data Available for | 2019 to 2023 |
Market Analysis | Value in USD billion |
Key Regions Covered | North America; Latin America; Western Europe; Eastern Europe; South Asia and Pacific; East Asia; Middle East and Africa |
Key Market Segments Covered | Product, Material, Application, Region |
Key Countries Profiled | The United States, Canada, Brazil, Mexico, Germany, The United Kingdom, France, Spain, Italy, Russia, Poland, Czech Republic, Romania, India, Bangladesh, Australia, New Zealand, China, Japan, South Korea, GCC countries, South Africa, Israel |
Key Companies Profiled | Amcor Plc.; Berry Global Group, Inc.; CCL Industries; Coveris; Sealed Air; Sonoco Products Company; WINPAK Ltd.; Alpha Packaging; Constantia Flexibles; Mondi; Gerresheimer AG; Silver Spur Corp.; Greif; Transcontinental Inc.; ALPLA |
Table 1: Global Market Value (US$ Million) Forecast by Region, 2019 to 2034
Table 2: Global Market Volume (Units) Forecast by Region, 2019 to 2034
Table 3: Global Market Value (US$ Million) Forecast by Product, 2019 to 2034
Table 4: Global Market Volume (Units) Forecast by Product, 2019 to 2034
Table 5: Global Market Value (US$ Million) Forecast by Material, 2019 to 2034
Table 6: Global Market Volume (Units) Forecast by Material, 2019 to 2034
Table 7: Global Market Value (US$ Million) Forecast by Application, 2019 to 2034
Table 8: Global Market Volume (Units) Forecast by Application, 2019 to 2034
Table 9: North America Market Value (US$ Million) Forecast by Country, 2019 to 2034
Table 10: North America Market Volume (Units) Forecast by Country, 2019 to 2034
Table 11: North America Market Value (US$ Million) Forecast by Product, 2019 to 2034
Table 12: North America Market Volume (Units) Forecast by Product, 2019 to 2034
Table 13: North America Market Value (US$ Million) Forecast by Material, 2019 to 2034
Table 14: North America Market Volume (Units) Forecast by Material, 2019 to 2034
Table 15: North America Market Value (US$ Million) Forecast by Application, 2019 to 2034
Table 16: North America Market Volume (Units) Forecast by Application, 2019 to 2034
Table 17: Latin America Market Value (US$ Million) Forecast by Country, 2019 to 2034
Table 18: Latin America Market Volume (Units) Forecast by Country, 2019 to 2034
Table 19: Latin America Market Value (US$ Million) Forecast by Product, 2019 to 2034
Table 20: Latin America Market Volume (Units) Forecast by Product, 2019 to 2034
Table 21: Latin America Market Value (US$ Million) Forecast by Material, 2019 to 2034
Table 22: Latin America Market Volume (Units) Forecast by Material, 2019 to 2034
Table 23: Latin America Market Value (US$ Million) Forecast by Application, 2019 to 2034
Table 24: Latin America Market Volume (Units) Forecast by Application, 2019 to 2034
Table 25: Western Europe Market Value (US$ Million) Forecast by Country, 2019 to 2034
Table 26: Western Europe Market Volume (Units) Forecast by Country, 2019 to 2034
Table 27: Western Europe Market Value (US$ Million) Forecast by Product, 2019 to 2034
Table 28: Western Europe Market Volume (Units) Forecast by Product, 2019 to 2034
Table 29: Western Europe Market Value (US$ Million) Forecast by Material, 2019 to 2034
Table 30: Western Europe Market Volume (Units) Forecast by Material, 2019 to 2034
Table 31: Western Europe Market Value (US$ Million) Forecast by Application, 2019 to 2034
Table 32: Western Europe Market Volume (Units) Forecast by Application, 2019 to 2034
Table 33: Eastern Europe Market Value (US$ Million) Forecast by Country, 2019 to 2034
Table 34: Eastern Europe Market Volume (Units) Forecast by Country, 2019 to 2034
Table 35: Eastern Europe Market Value (US$ Million) Forecast by Product, 2019 to 2034
Table 36: Eastern Europe Market Volume (Units) Forecast by Product, 2019 to 2034
Table 37: Eastern Europe Market Value (US$ Million) Forecast by Material, 2019 to 2034
Table 38: Eastern Europe Market Volume (Units) Forecast by Material, 2019 to 2034
Table 39: Eastern Europe Market Value (US$ Million) Forecast by Application, 2019 to 2034
Table 40: Eastern Europe Market Volume (Units) Forecast by Application, 2019 to 2034
Table 41: South Asia and Pacific Market Value (US$ Million) Forecast by Country, 2019 to 2034
Table 42: South Asia and Pacific Market Volume (Units) Forecast by Country, 2019 to 2034
Table 43: South Asia and Pacific Market Value (US$ Million) Forecast by Product, 2019 to 2034
Table 44: South Asia and Pacific Market Volume (Units) Forecast by Product, 2019 to 2034
Table 45: South Asia and Pacific Market Value (US$ Million) Forecast by Material, 2019 to 2034
Table 46: South Asia and Pacific Market Volume (Units) Forecast by Material, 2019 to 2034
Table 47: South Asia and Pacific Market Value (US$ Million) Forecast by Application, 2019 to 2034
Table 48: South Asia and Pacific Market Volume (Units) Forecast by Application, 2019 to 2034
Table 49: East Asia Market Value (US$ Million) Forecast by Country, 2019 to 2034
Table 50: East Asia Market Volume (Units) Forecast by Country, 2019 to 2034
Table 51: East Asia Market Value (US$ Million) Forecast by Product, 2019 to 2034
Table 52: East Asia Market Volume (Units) Forecast by Product, 2019 to 2034
Table 53: East Asia Market Value (US$ Million) Forecast by Material, 2019 to 2034
Table 54: East Asia Market Volume (Units) Forecast by Material, 2019 to 2034
Table 55: East Asia Market Value (US$ Million) Forecast by Application, 2019 to 2034
Table 56: East Asia Market Volume (Units) Forecast by Application, 2019 to 2034
Table 57: Middle East and Africa Market Value (US$ Million) Forecast by Country, 2019 to 2034
Table 58: Middle East and Africa Market Volume (Units) Forecast by Country, 2019 to 2034
Table 59: Middle East and Africa Market Value (US$ Million) Forecast by Product, 2019 to 2034
Table 60: Middle East and Africa Market Volume (Units) Forecast by Product, 2019 to 2034
Table 61: Middle East and Africa Market Value (US$ Million) Forecast by Material, 2019 to 2034
Table 62: Middle East and Africa Market Volume (Units) Forecast by Material, 2019 to 2034
Table 63: Middle East and Africa Market Value (US$ Million) Forecast by Application, 2019 to 2034
Table 64: Middle East and Africa Market Volume (Units) Forecast by Application, 2019 to 2034
Figure 1: Global Market Value (US$ Million) by Product, 2024 to 2034
Figure 2: Global Market Value (US$ Million) by Material, 2024 to 2034
Figure 3: Global Market Value (US$ Million) by Application, 2024 to 2034
Figure 4: Global Market Value (US$ Million) by Region, 2024 to 2034
Figure 5: Global Market Value (US$ Million) Analysis by Region, 2019 to 2034
Figure 6: Global Market Volume (Units) Analysis by Region, 2019 to 2034
Figure 7: Global Market Value Share (%) and BPS Analysis by Region, 2024 to 2034
Figure 8: Global Market Y-o-Y Growth (%) Projections by Region, 2024 to 2034
Figure 9: Global Market Value (US$ Million) Analysis by Product, 2019 to 2034
Figure 10: Global Market Volume (Units) Analysis by Product, 2019 to 2034
Figure 11: Global Market Value Share (%) and BPS Analysis by Product, 2024 to 2034
Figure 12: Global Market Y-o-Y Growth (%) Projections by Product, 2024 to 2034
Figure 13: Global Market Value (US$ Million) Analysis by Material, 2019 to 2034
Figure 14: Global Market Volume (Units) Analysis by Material, 2019 to 2034
Figure 15: Global Market Value Share (%) and BPS Analysis by Material, 2024 to 2034
Figure 16: Global Market Y-o-Y Growth (%) Projections by Material, 2024 to 2034
Figure 17: Global Market Value (US$ Million) Analysis by Application, 2019 to 2034
Figure 18: Global Market Volume (Units) Analysis by Application, 2019 to 2034
Figure 19: Global Market Value Share (%) and BPS Analysis by Application, 2024 to 2034
Figure 20: Global Market Y-o-Y Growth (%) Projections by Application, 2024 to 2034
Figure 21: Global Market Attractiveness by Product, 2024 to 2034
Figure 22: Global Market Attractiveness by Material, 2024 to 2034
Figure 23: Global Market Attractiveness by Application, 2024 to 2034
Figure 24: Global Market Attractiveness by Region, 2024 to 2034
Figure 25: North America Market Value (US$ Million) by Product, 2024 to 2034
Figure 26: North America Market Value (US$ Million) by Material, 2024 to 2034
Figure 27: North America Market Value (US$ Million) by Application, 2024 to 2034
Figure 28: North America Market Value (US$ Million) by Country, 2024 to 2034
Figure 29: North America Market Value (US$ Million) Analysis by Country, 2019 to 2034
Figure 30: North America Market Volume (Units) Analysis by Country, 2019 to 2034
Figure 31: North America Market Value Share (%) and BPS Analysis by Country, 2024 to 2034
Figure 32: North America Market Y-o-Y Growth (%) Projections by Country, 2024 to 2034
Figure 33: North America Market Value (US$ Million) Analysis by Product, 2019 to 2034
Figure 34: North America Market Volume (Units) Analysis by Product, 2019 to 2034
Figure 35: North America Market Value Share (%) and BPS Analysis by Product, 2024 to 2034
Figure 36: North America Market Y-o-Y Growth (%) Projections by Product, 2024 to 2034
Figure 37: North America Market Value (US$ Million) Analysis by Material, 2019 to 2034
Figure 38: North America Market Volume (Units) Analysis by Material, 2019 to 2034
Figure 39: North America Market Value Share (%) and BPS Analysis by Material, 2024 to 2034
Figure 40: North America Market Y-o-Y Growth (%) Projections by Material, 2024 to 2034
Figure 41: North America Market Value (US$ Million) Analysis by Application, 2019 to 2034
Figure 42: North America Market Volume (Units) Analysis by Application, 2019 to 2034
Figure 43: North America Market Value Share (%) and BPS Analysis by Application, 2024 to 2034
Figure 44: North America Market Y-o-Y Growth (%) Projections by Application, 2024 to 2034
Figure 45: North America Market Attractiveness by Product, 2024 to 2034
Figure 46: North America Market Attractiveness by Material, 2024 to 2034
Figure 47: North America Market Attractiveness by Application, 2024 to 2034
Figure 48: North America Market Attractiveness by Country, 2024 to 2034
Figure 49: Latin America Market Value (US$ Million) by Product, 2024 to 2034
Figure 50: Latin America Market Value (US$ Million) by Material, 2024 to 2034
Figure 51: Latin America Market Value (US$ Million) by Application, 2024 to 2034
Figure 52: Latin America Market Value (US$ Million) by Country, 2024 to 2034
Figure 53: Latin America Market Value (US$ Million) Analysis by Country, 2019 to 2034
Figure 54: Latin America Market Volume (Units) Analysis by Country, 2019 to 2034
Figure 55: Latin America Market Value Share (%) and BPS Analysis by Country, 2024 to 2034
Figure 56: Latin America Market Y-o-Y Growth (%) Projections by Country, 2024 to 2034
Figure 57: Latin America Market Value (US$ Million) Analysis by Product, 2019 to 2034
Figure 58: Latin America Market Volume (Units) Analysis by Product, 2019 to 2034
Figure 59: Latin America Market Value Share (%) and BPS Analysis by Product, 2024 to 2034
Figure 60: Latin America Market Y-o-Y Growth (%) Projections by Product, 2024 to 2034
Figure 61: Latin America Market Value (US$ Million) Analysis by Material, 2019 to 2034
Figure 62: Latin America Market Volume (Units) Analysis by Material, 2019 to 2034
Figure 63: Latin America Market Value Share (%) and BPS Analysis by Material, 2024 to 2034
Figure 64: Latin America Market Y-o-Y Growth (%) Projections by Material, 2024 to 2034
Figure 65: Latin America Market Value (US$ Million) Analysis by Application, 2019 to 2034
Figure 66: Latin America Market Volume (Units) Analysis by Application, 2019 to 2034
Figure 67: Latin America Market Value Share (%) and BPS Analysis by Application, 2024 to 2034
Figure 68: Latin America Market Y-o-Y Growth (%) Projections by Application, 2024 to 2034
Figure 69: Latin America Market Attractiveness by Product, 2024 to 2034
Figure 70: Latin America Market Attractiveness by Material, 2024 to 2034
Figure 71: Latin America Market Attractiveness by Application, 2024 to 2034
Figure 72: Latin America Market Attractiveness by Country, 2024 to 2034
Figure 73: Western Europe Market Value (US$ Million) by Product, 2024 to 2034
Figure 74: Western Europe Market Value (US$ Million) by Material, 2024 to 2034
Figure 75: Western Europe Market Value (US$ Million) by Application, 2024 to 2034
Figure 76: Western Europe Market Value (US$ Million) by Country, 2024 to 2034
Figure 77: Western Europe Market Value (US$ Million) Analysis by Country, 2019 to 2034
Figure 78: Western Europe Market Volume (Units) Analysis by Country, 2019 to 2034
Figure 79: Western Europe Market Value Share (%) and BPS Analysis by Country, 2024 to 2034
Figure 80: Western Europe Market Y-o-Y Growth (%) Projections by Country, 2024 to 2034
Figure 81: Western Europe Market Value (US$ Million) Analysis by Product, 2019 to 2034
Figure 82: Western Europe Market Volume (Units) Analysis by Product, 2019 to 2034
Figure 83: Western Europe Market Value Share (%) and BPS Analysis by Product, 2024 to 2034
Figure 84: Western Europe Market Y-o-Y Growth (%) Projections by Product, 2024 to 2034
Figure 85: Western Europe Market Value (US$ Million) Analysis by Material, 2019 to 2034
Figure 86: Western Europe Market Volume (Units) Analysis by Material, 2019 to 2034
Figure 87: Western Europe Market Value Share (%) and BPS Analysis by Material, 2024 to 2034
Figure 88: Western Europe Market Y-o-Y Growth (%) Projections by Material, 2024 to 2034
Figure 89: Western Europe Market Value (US$ Million) Analysis by Application, 2019 to 2034
Figure 90: Western Europe Market Volume (Units) Analysis by Application, 2019 to 2034
Figure 91: Western Europe Market Value Share (%) and BPS Analysis by Application, 2024 to 2034
Figure 92: Western Europe Market Y-o-Y Growth (%) Projections by Application, 2024 to 2034
Figure 93: Western Europe Market Attractiveness by Product, 2024 to 2034
Figure 94: Western Europe Market Attractiveness by Material, 2024 to 2034
Figure 95: Western Europe Market Attractiveness by Application, 2024 to 2034
Figure 96: Western Europe Market Attractiveness by Country, 2024 to 2034
Figure 97: Eastern Europe Market Value (US$ Million) by Product, 2024 to 2034
Figure 98: Eastern Europe Market Value (US$ Million) by Material, 2024 to 2034
Figure 99: Eastern Europe Market Value (US$ Million) by Application, 2024 to 2034
Figure 100: Eastern Europe Market Value (US$ Million) by Country, 2024 to 2034
Figure 101: Eastern Europe Market Value (US$ Million) Analysis by Country, 2019 to 2034
Figure 102: Eastern Europe Market Volume (Units) Analysis by Country, 2019 to 2034
Figure 103: Eastern Europe Market Value Share (%) and BPS Analysis by Country, 2024 to 2034
Figure 104: Eastern Europe Market Y-o-Y Growth (%) Projections by Country, 2024 to 2034
Figure 105: Eastern Europe Market Value (US$ Million) Analysis by Product, 2019 to 2034
Figure 106: Eastern Europe Market Volume (Units) Analysis by Product, 2019 to 2034
Figure 107: Eastern Europe Market Value Share (%) and BPS Analysis by Product, 2024 to 2034
Figure 108: Eastern Europe Market Y-o-Y Growth (%) Projections by Product, 2024 to 2034
Figure 109: Eastern Europe Market Value (US$ Million) Analysis by Material, 2019 to 2034
Figure 110: Eastern Europe Market Volume (Units) Analysis by Material, 2019 to 2034
Figure 111: Eastern Europe Market Value Share (%) and BPS Analysis by Material, 2024 to 2034
Figure 112: Eastern Europe Market Y-o-Y Growth (%) Projections by Material, 2024 to 2034
Figure 113: Eastern Europe Market Value (US$ Million) Analysis by Application, 2019 to 2034
Figure 114: Eastern Europe Market Volume (Units) Analysis by Application, 2019 to 2034
Figure 115: Eastern Europe Market Value Share (%) and BPS Analysis by Application, 2024 to 2034
Figure 116: Eastern Europe Market Y-o-Y Growth (%) Projections by Application, 2024 to 2034
Figure 117: Eastern Europe Market Attractiveness by Product, 2024 to 2034
Figure 118: Eastern Europe Market Attractiveness by Material, 2024 to 2034
Figure 119: Eastern Europe Market Attractiveness by Application, 2024 to 2034
Figure 120: Eastern Europe Market Attractiveness by Country, 2024 to 2034
Figure 121: South Asia and Pacific Market Value (US$ Million) by Product, 2024 to 2034
Figure 122: South Asia and Pacific Market Value (US$ Million) by Material, 2024 to 2034
Figure 123: South Asia and Pacific Market Value (US$ Million) by Application, 2024 to 2034
Figure 124: South Asia and Pacific Market Value (US$ Million) by Country, 2024 to 2034
Figure 125: South Asia and Pacific Market Value (US$ Million) Analysis by Country, 2019 to 2034
Figure 126: South Asia and Pacific Market Volume (Units) Analysis by Country, 2019 to 2034
Figure 127: South Asia and Pacific Market Value Share (%) and BPS Analysis by Country, 2024 to 2034
Figure 128: South Asia and Pacific Market Y-o-Y Growth (%) Projections by Country, 2024 to 2034
Figure 129: South Asia and Pacific Market Value (US$ Million) Analysis by Product, 2019 to 2034
Figure 130: South Asia and Pacific Market Volume (Units) Analysis by Product, 2019 to 2034
Figure 131: South Asia and Pacific Market Value Share (%) and BPS Analysis by Product, 2024 to 2034
Figure 132: South Asia and Pacific Market Y-o-Y Growth (%) Projections by Product, 2024 to 2034
Figure 133: South Asia and Pacific Market Value (US$ Million) Analysis by Material, 2019 to 2034
Figure 134: South Asia and Pacific Market Volume (Units) Analysis by Material, 2019 to 2034
Figure 135: South Asia and Pacific Market Value Share (%) and BPS Analysis by Material, 2024 to 2034
Figure 136: South Asia and Pacific Market Y-o-Y Growth (%) Projections by Material, 2024 to 2034
Figure 137: South Asia and Pacific Market Value (US$ Million) Analysis by Application, 2019 to 2034
Figure 138: South Asia and Pacific Market Volume (Units) Analysis by Application, 2019 to 2034
Figure 139: South Asia and Pacific Market Value Share (%) and BPS Analysis by Application, 2024 to 2034
Figure 140: South Asia and Pacific Market Y-o-Y Growth (%) Projections by Application, 2024 to 2034
Figure 141: South Asia and Pacific Market Attractiveness by Product, 2024 to 2034
Figure 142: South Asia and Pacific Market Attractiveness by Material, 2024 to 2034
Figure 143: South Asia and Pacific Market Attractiveness by Application, 2024 to 2034
Figure 144: South Asia and Pacific Market Attractiveness by Country, 2024 to 2034
Figure 145: East Asia Market Value (US$ Million) by Product, 2024 to 2034
Figure 146: East Asia Market Value (US$ Million) by Material, 2024 to 2034
Figure 147: East Asia Market Value (US$ Million) by Application, 2024 to 2034
Figure 148: East Asia Market Value (US$ Million) by Country, 2024 to 2034
Figure 149: East Asia Market Value (US$ Million) Analysis by Country, 2019 to 2034
Figure 150: East Asia Market Volume (Units) Analysis by Country, 2019 to 2034
Figure 151: East Asia Market Value Share (%) and BPS Analysis by Country, 2024 to 2034
Figure 152: East Asia Market Y-o-Y Growth (%) Projections by Country, 2024 to 2034
Figure 153: East Asia Market Value (US$ Million) Analysis by Product, 2019 to 2034
Figure 154: East Asia Market Volume (Units) Analysis by Product, 2019 to 2034
Figure 155: East Asia Market Value Share (%) and BPS Analysis by Product, 2024 to 2034
Figure 156: East Asia Market Y-o-Y Growth (%) Projections by Product, 2024 to 2034
Figure 157: East Asia Market Value (US$ Million) Analysis by Material, 2019 to 2034
Figure 158: East Asia Market Volume (Units) Analysis by Material, 2019 to 2034
Figure 159: East Asia Market Value Share (%) and BPS Analysis by Material, 2024 to 2034
Figure 160: East Asia Market Y-o-Y Growth (%) Projections by Material, 2024 to 2034
Figure 161: East Asia Market Value (US$ Million) Analysis by Application, 2019 to 2034
Figure 162: East Asia Market Volume (Units) Analysis by Application, 2019 to 2034
Figure 163: East Asia Market Value Share (%) and BPS Analysis by Application, 2024 to 2034
Figure 164: East Asia Market Y-o-Y Growth (%) Projections by Application, 2024 to 2034
Figure 165: East Asia Market Attractiveness by Product, 2024 to 2034
Figure 166: East Asia Market Attractiveness by Material, 2024 to 2034
Figure 167: East Asia Market Attractiveness by Application, 2024 to 2034
Figure 168: East Asia Market Attractiveness by Country, 2024 to 2034
Figure 169: Middle East and Africa Market Value (US$ Million) by Product, 2024 to 2034
Figure 170: Middle East and Africa Market Value (US$ Million) by Material, 2024 to 2034
Figure 171: Middle East and Africa Market Value (US$ Million) by Application, 2024 to 2034
Figure 172: Middle East and Africa Market Value (US$ Million) by Country, 2024 to 2034
Figure 173: Middle East and Africa Market Value (US$ Million) Analysis by Country, 2019 to 2034
Figure 174: Middle East and Africa Market Volume (Units) Analysis by Country, 2019 to 2034
Figure 175: Middle East and Africa Market Value Share (%) and BPS Analysis by Country, 2024 to 2034
Figure 176: Middle East and Africa Market Y-o-Y Growth (%) Projections by Country, 2024 to 2034
Figure 177: Middle East and Africa Market Value (US$ Million) Analysis by Product, 2019 to 2034
Figure 178: Middle East and Africa Market Volume (Units) Analysis by Product, 2019 to 2034
Figure 179: Middle East and Africa Market Value Share (%) and BPS Analysis by Product, 2024 to 2034
Figure 180: Middle East and Africa Market Y-o-Y Growth (%) Projections by Product, 2024 to 2034
Figure 181: Middle East and Africa Market Value (US$ Million) Analysis by Material, 2019 to 2034
Figure 182: Middle East and Africa Market Volume (Units) Analysis by Material, 2019 to 2034
Figure 183: Middle East and Africa Market Value Share (%) and BPS Analysis by Material, 2024 to 2034
Figure 184: Middle East and Africa Market Y-o-Y Growth (%) Projections by Material, 2024 to 2034
Figure 185: Middle East and Africa Market Value (US$ Million) Analysis by Application, 2019 to 2034
Figure 186: Middle East and Africa Market Volume (Units) Analysis by Application, 2019 to 2034
Figure 187: Middle East and Africa Market Value Share (%) and BPS Analysis by Application, 2024 to 2034
Figure 188: Middle East and Africa Market Y-o-Y Growth (%) Projections by Application, 2024 to 2034
Figure 189: Middle East and Africa Market Attractiveness by Product, 2024 to 2034
Figure 190: Middle East and Africa Market Attractiveness by Material, 2024 to 2034
Figure 191: Middle East and Africa Market Attractiveness by Application, 2024 to 2034
Figure 192: Middle East and Africa Market Attractiveness by Country, 2024 to 2034
As of 2024, the market for e-commerce packaging is expected to be valued at USD 76.9 billion.
By 2034, the market value of e-commerce packaging is expected to reach USD 210 billion.
From 2024 to 2034, the e-commerce packaging market is expected to flourish at a CAGR of 10.6%
The corrugated box segment is expected to account for a CAGR of 10.4% from 2024 to 2034.
South Korea is likely the top-performing market, with a CAGR of 12.8%.
Explore Similar Insights
Thank you!
You will receive an email from our Business Development Manager. Please be sure to check your SPAM/JUNK folder too.