Sustainable Packaging Market Size and Share Forecast Outlook 2025 to 2035

The sustainable packaging market is projected to grow from USD 301.8 billion in 2025 to USD 530.4 billion by 2035, registering a CAGR of 5.8% during the forecast period. Sales in 2024 reached USD 285.2 billion. Market expansion has been fueled by heightened consumer awareness, ESG-led procurement policies, and demand for recyclable, compostable, and bio-based materials.
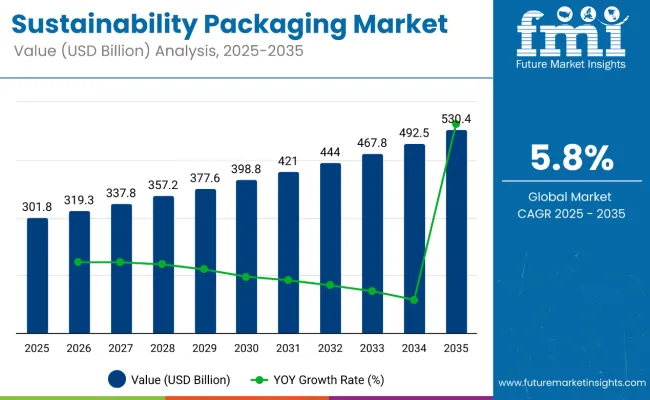
Quick Stats of Sustainable Packaging Market

  • Market Value (2025): USD 301.8 billion
  • Forecast Value (2035): USD 530.4 billion
  • Forecast CAGR: 5.8%
  • Material Leader in 2025: Paper & Paperboard Materials (42% market share)
  • Top Packaging: Boxes & Cartons (36% share)
  • Key Growth Region: South Asia (India is the fastest-growing market with 6.9% CAGR)
Metric Value
Industry Size (2025E) USD 301.8 Billion
Industry Value (2035F) USD 530.4 Billion
CAGR (2025 to 2035) 5.8%

Brand owners across the food & beverage, personal care, and e-commerce sectors have increased the adoption of recyclable mono-materials and minimalistic packaging formats. Smart packaging and digital printing have also been integrated to improve sustainability scores and brand traceability.

In April 2025, Ranpak Holdings Corp, a global leader in sustainable packaging automation technology and solutions, today announced the integration of PaperWrap, an innovative solution that replaces traditional plastic stretch film for pallet wrapping, to its portfolio. The partnership between Ranpak and PaperWrap will offer more sustainable and efficient approach to securing goods for transportation. “At Ranpak, sustainability is at the core of everything we do,” said Omar Asali, Chairman and CEO of Ranpak.

“This new partnership with PaperWrap represents a significant milestone as we continue to evaluate the most sustainable materials possible and deliver resources that will help businesses transition away from single-use plastics. Together, we are driving the future of sustainable packaging and creating a positive impact for generations to come.

Sustainability efforts in this market have been catalyzed by regulatory enforcement and retailer mandates favoring non-toxic, compostable, and recyclable formats. Investments have been directed into bioplastics, molded fiber, and paper-based laminates that meet certifications such as ASTM D6400 and EN 13432.

Rapid innovation in barrier coatings, including PVOH and water-based solutions, has enabled food packaging manufacturers to reduce dependency on multilayer plastics. Across Asia and Europe, eco-labeling and carbon impact disclosures have gained traction, pushing brands to improve packaging transparency.

The sustainable packaging demand is anticipated to grow over the next decade, driven by the ongoing expansion of various end-use industries and the increasing emphasis on sustainable packaging solutions. The market's trajectory suggests a steady rise in demand for innovative, eco-friendly packaging that caters to both consumer preferences and regulatory requirements.

Companies investing in research and development to create durable, cost-effective, and environmentally friendly packaging are expected to gain a competitive edge. The integration of advanced materials and ergonomic designs will likely play a crucial role in shaping the future of the sustainable packaging market.

Semi-Annual Market Update

The below table presents the expected CAGR for the global sustainable packaging market over several semi-annual periods spanning from 2024 to 2034.

Particular Value CAGR
H1(2024 to 2034) 5.7%
H2(2024 to 2034) 5.9%
H1(2025 to2035) 4.8%
H2(2025 to2035) 6.8%

In the first half (H1) of the decade from 2024 to 2034, the business is predicted to surge at a CAGR of 5.7%, followed by a slightly higher growth rate of 5.9% in the second half (H2) of the same decade.

Moving into the subsequent period, from H1 2025 to H2 2035, the CAGR is projected to decrease slightly to 4.8% in the first half and remain relatively moderate at 6.8% in the second half. In the first half (H1) the market witnessed a decrease of 90 BPS while in the second half (H2), the market witnessed an increase of 90 BPS.

Analyzing Sustainable Packaging Market by Top Investment Segment

The market is segmented based on material type, packaging format, process type, end-use industry, and region. By material type, the market includes paper & paperboard, bioplastics, recycled plastics, glass, aluminum, and plant-based fibers. In terms of packaging format, the market is categorized into boxes & cartons, pouches & sachets, bottles & jars, trays & clamshells, wraps & films, and bags & sacks.

By process type, the market comprises recyclable packaging, compostable packaging, biodegradable packaging, reusable/refillable packaging, and upcycled packaging. In terms of end-use industry, the market includes food & beverage, personal care & cosmetics, pharmaceuticals, consumer electronics, household products, and e-commerce & retail. Regionally, the market is analyzed across North America, Latin America, East Asia, South Asia & Pacific, Eastern Europe, Western Europe, Oceania, and the Middle East & Africa.
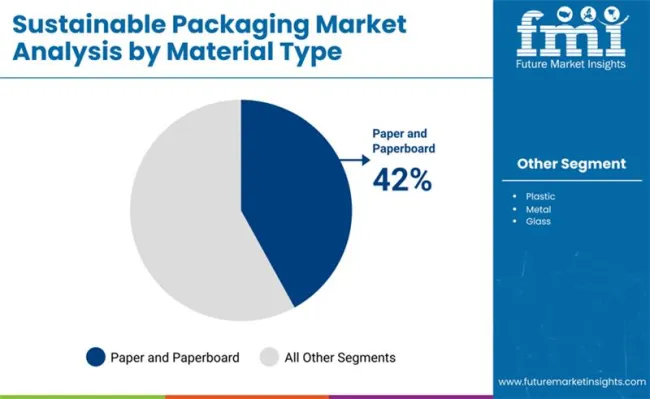
Paper and Paperboard Chosen for Recyclability and Eco-Friendly Appeal

Paper and paperboard materials have been projected to dominate the sustainable packaging market with a 42% share in 2025, supported by their high recyclability and consumer preference for biodegradable formats. These materials have been utilized across multiple packaging applications due to their flexibility, cost-effectiveness, and minimal environmental impact.

They have been increasingly adopted by FMCG brands to reduce plastic dependency and meet environmental compliance targets. Regulatory backing for fiber-based alternatives has further accelerated their integration into packaging supply chains. Packaging companies have adopted FSC-certified and PEFC-certified paper sources to enhance sustainability claims.

Coatings made from water-based or compostable polymers have been applied to paperboard to improve barrier properties while maintaining eco-certifications. Light weighting and high-strength corrugated grades have been used to improve durability in transit. Several retailers have mandated paper-based outer packaging to simplify recycling at the consumer level.

Customization and branding have been enabled through improved printability and digital finishing on paperboard substrates. High-definition graphics and tactile finishes have supported premium product positioning. Easy folding, nesting, and stacking features have enhanced operational efficiency in warehousing and display.

Retail-ready formats have been optimized to reduce labor and handling costs in supply chains. Foodservice operators and e-commerce platforms have transitioned to molded fiber and rigid paperboard containers to reduce landfill waste. Government bans on expanded polystyrene and single-use plastics have driven conversions to compostable paperboard packaging. Zero-waste retail models have adopted paperboard containers for bulk and refillable packaging systems. Paper & paperboard have continued to lead sustainable material innovation through recyclability, design flexibility, and lower carbon footprints.
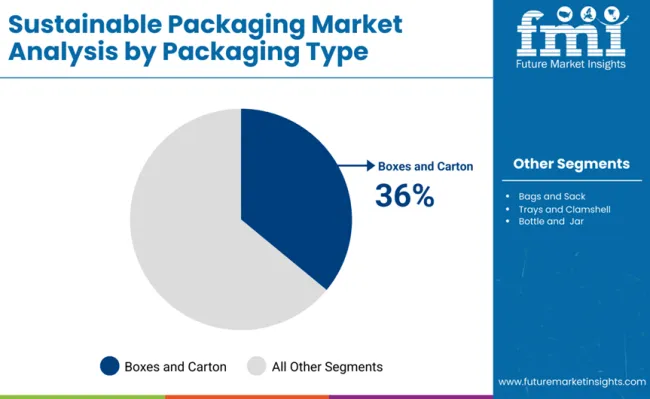
Boxes and Cartons Selected for Structure, Protection, and Brand Storytelling

Boxes and cartons have been expected to capture 36% of the sustainable packaging market in 2025, driven by their structural integrity, branding surface area, and compatibility with recycled and renewable materials. These formats have been used extensively across food, cosmetic, pharmaceutical, and e-commerce applications due to their scalability and product protection. Corrugated and folding cartons have provided stacking strength and crush resistance for secondary and tertiary packaging.

Retailers have relied on printed cartons to elevate unboxing experiences and deliver messaging around sustainability. Advances in digital printing and die-cutting have enabled personalized and short-run packaging solutions. Carton board substrates with compostable linings or plastic-free coatings have gained traction for ready-to-eat meals and perishables. Nested packaging formats have been optimized for storage and transport efficiency. Tamper-evident closures and locking mechanisms have been incorporated to address regulatory requirements.

Several multinational brands have pledged to use only recyclable, reusable, or compostable cartons by 2030, spurring demand across global markets. Packaging vendors have invested in automation systems tailored to folding carton production for high-volume runs. Cartons made from post-consumer recycled content have achieved compliance with food-grade standards in key jurisdictions.

Box-in-box systems and paper-based inserts have reduced the need for non-renewable internal fillers. Sustainability certifications such as FSC and Carbon Neutral have been commonly displayed on carton packaging to align with ethical sourcing initiatives.

Cartons have offered superior product-to-package ratios, reducing material use without compromising protection. The format’s adaptability to shelf-ready and e-commerce channels has maintained its dominance in high-growth sectors. As regulations around packaging waste tighten, boxes & cartons have remained the most scalable and visible format for sustainable packaging adoption.

Key Industry Highlights

Consumer Awareness and Demand for Green Packaging

The market for sustainable packaging is in a sweet position with an impetus through growing consumer awareness on environmental issues and waste reduction. Consumers are seeking environmentally friendly, biodegradable, and recyclable packaging materials which are compelling businesses to turn to sustainable materials including paper, plant-based plastics, and compostable films.issues raised by plastic waste and land-filled trash have compelled producers toward adopting minimalist, reusable, and carbon-neutral packaging in their efforts to keep pace with their consumer demands and corporate sustainability agendas.

The rise of green consumerism compelled these big food & beverage, personal care, and e-commerce companies to invest heavily into alternatives that are plastic-free or recyclable. The social media campaign against single-use plastics has also placed pressure on businesses to adopt sustainable packaging practices. With increasingly environmentally aware consumer behavior becoming mainstream, need for innovative, eco-friendly packaging solutions will probably become a driving force for fast growth in the market.

Strong Government Policies and Business Sustainability Initiatives

Governments from around the world are implementing harsh rules and plastics prohibition worldwide against packaging waste and greenhouse emissions that restrict the environment; therefore, sustainable packaging continues to develop at an accelerated speed.

Certain worldwide policies such as EU Green Deal, Extended Producer Responsibility (EPR), and USA Plastic Waste Reduction Act pursue enforcing companies to opt for the biodegradable, recyclable, and reusable package material. Tax credits to green packaging or a penalty on excessive use of plastics has been implemented in the majority of countries, hence forcing companies to shift to new packaging norms.

Therefore, with increasing need for more environmentally friendly packaging materials perpetually in the aftermath of business compliance and governmental incentives, this will be increasing steadily around the world.

High Costs of Sustainable Packaging Materials and Production

The biggest challenge of sustainable packaging is high expense and increased cost of production of green material and process. Green alternatives to Styrofoam and plastic such as bioplastics, recycled paper packaging, or compostable films are very expensive taking into consideration factors that affect availability of raw materials, high production processes, and low volume of production.

Large companies, however, can afford to absorb these expenses while their comparatively smaller counterparts may struggle to justify this cost. Unless costs are minimized through economies of scale, material innovation, or government subsidies, the cost mark of sustainable packaging solutions will discourage their mass adoption in most instances, particularly in emerging markets.

Market Concentration

Tier 1 companies comprise market leaders capturing significant market share in global market. These market leaders are characterized by high production capacity and a wide product portfolio. These market leaders are distinguished by their extensive expertise in manufacturing across multiple packaging formats and a broad geographical reach, underpinned by a robust consumer base.

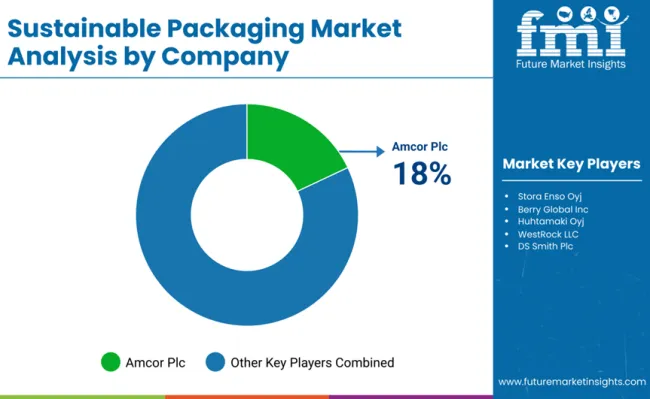
They provide a wide range of series including recycling and manufacturing utilizing the latest technology and meeting the regulatory standards providing the highest quality. Prominent companies within tier 1 includeAmcor Plc, Stora Enso Oyj, Berry Global Inc., Huhtamaki Oyj, WestRock LLC, DS Smith Plc.

Tier 2 companies include mid-size players having presence in specific regions and highly influencing the local market. These are characterized by a strong presence overseas and strong market knowledge. These market players have good technology and ensure regulatory compliance but may not have advanced technology and wide global reach.

Prominent companies in tier 2 includeThe Mondi Group plc, International Paper Company, Detmold Group, Sealed Air Corporation, Dart Container Corporation, Duni AB, Vegware Ltd., Pactiv LLC, RKW Group, Novolex Holdings, Inc.

Tier 3 includes the majority of small-scale companies operating at the local presence and serving niche markets. These companies are notably oriented towards fulfilling local market demands and are consequently classified within the tier 3 share segment.

They are small-scale players and have limited geographical reach.Tier 3, within this context, is recognized as an unorganized market, denoting a sector characterized by a lack of extensive structure and formalization when compared to organized competitors.
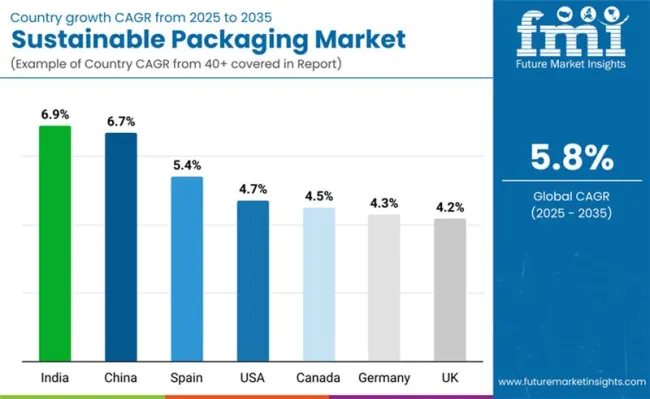
Country-wise Insights

The section below covers the future forecast for the sustainable packaging marketin terms of countries. Information on key countries in several parts of the globe, including North America, Latin America, East Asia, South Asia and Pacific, Western Europe, Eastern Europe and MEA is provided. USA is expected to account for a CAGR of 4.7% through 2035. In Europe, Spainis projected to witness a CAGR of 5.4% by 2035.

Countries Value CAGR (2025 to 2035)
USA 4.7%
Germany 4.3%
China 6.7%
UK 4.2%
Spain 5.4%
India 6.9%
Canada 4.5%

USA Market Driver: Expansion of E-Commerce and Green Packaging Innovation

In the United States, e-commerce expansion and need for eco-friendly shipping options are the most significant growth drivers of the sustainable packaging market. The higher the expansion of Amazon, Walmart, and Shopify-based businesses, the more there is a need for packaging that is environmentally friendly, lightweight, and recyclable.

Conventional plastic packaging is being substituted more and more with commercially available biodegradable fillers, recycled cardboard boxes, and water-based ink printing for waste reduction. In addition, the demand for plastic-free bare minimum packaging has evolved as a strong marketing strategy for firms trading in plant-based and compostable substitutes.

The legislative actions in America, including a state-wide prohibition of plastic bags and business commitments to sustainability, are therefore being employed to drive the circular economy of packaging. Big businesses are instead investing in new technologies such as edible packaging, refillable packs, and dissolvable films as strategies for sustainability. With green shopping habits and online shopping expansion in the USA, demand for sustainable, long-lasting, and biodegradable packaging material will increase.

Germany Market Driver: Robust Environmental Regulations and Circular Economy Model

Germany boasts some of the world's highest recycling rates, and businesses are thus encouraged to use sustainable materials such as FSC-certified paper, compostable bioplastics, and mono-materials that can be readily recycled. Moreover, German consumers are most eco-conscious and prefer brands with packaging that assures plastic-free and minimalist in content.

Refillable packaging systems, zero-packaging, and plant-based film applications in practice align with government policy and consumer demand in their food, cosmetic, and retail sectors. With increasing demand for sustainable and circular packaging solutions across industries amid Germany's steady advancements in green packaging, the trend must persist.
Competitive Outlook

The Sustainable Packaging Market is experiencing rapid growth due to increasing consumer awareness, stringent environmental regulations, and corporate sustainability initiatives. Businesses across industries such as food & beverages, personal care, pharmaceuticals, and e-commerce are transitioning to biodegradable, recyclable, and reusable packaging solutions.

The demand is driven by government policies banning single-use plastics, rising adoption of circular economy practices, and advancements in eco-friendly materials like bioplastics and compostable films.

Companies are innovating with minimalist designs, lightweight materials, and plant-based alternatives to reduce carbon footprints. However, challenges such as higher production costs, limited raw material availability, and recyclability concerns remain key hurdles for widespread adoption.

Key Players

  • Amcor Plc
  • Stora Enso Oyj.
  • Berry Global Inc.
  • Huhtamaki Oyj.
  • WestRock LLC
  • DS Smith Plc
  • The Mondi Group plc
  • International Paper Company
  • Detmold Group
  • Sealed Air Corporation
  • Dart Container Corporation
  • Duni AB
  • Vegware Ltd.
  • Pactiv LLC
  • RKW Group
  • Novolex Holdings, Inc.

Report Scope Table - Sustainable Packaging Market

Report Attributes Details
Market Size (2024) USD 285.3 billion
Current Total Market Size (2025) USD 301.8 billion
Projected Market Size (2035) USD 530.4 billion
CAGR (2025 to 2035) 5.8%
Base Year for Estimation 2024
Historical Period 2020 to 2024
Projections Period 2025 to 2035
Quantitative Units USD billion for value and million tons for volume
Material Types Analyzed (Segment 1) Paper and Paperboard (Coated Unbleached, Bleached Paperboard, Molded Fiber Pulp, Kraft Paper, Corrugated Board/Boxboard), Plastic (PLA, PBS, PHAs, Starch-based, PVA, PVOH, PBAT), Metal (Steel, Aluminum), Glass, Fabric, Wood, Others
Packaging Types Analyzed (Segment 2) Bags and Sacks, Trays and Clamshells, Cartons and Boxes, Cans, Bottles and Jars, Films and Wraps, Pouches and Sachets, Drums, Intermediate Bulk Containers (IBC), Vials and Ampoules, Tapes and Labels, Others (Jerry Cans, Bowls, Cutlery)
Distribution Channels Analyzed (Segment 3) Direct Sales, Distributors, Retailers
End Uses Analyzed (Segment 4) Food (Bakery & Confectionery, Dairy, Fresh Produce, Snack Food, Processed Food), Beverages (Non-Alcoholic, Alcoholic), Cosmetics & Personal Care, Chemicals, Healthcare, Agriculture, Others
Regions Covered North America; Latin America; Western Europe; Eastern Europe; South Asia and Pacific; East Asia; Middle East & Africa
Countries Covered United States, Canada, Mexico, Brazil, Argentina, Germany, France, United Kingdom, Italy, Spain, Netherlands, China, India, Japan, South Korea, ANZ, GCC Countries, South Africa
Key Players influencing the Sustainable Packaging Market Amcor Plc, Stora Enso Oyj., Berry Global Inc., Huhtamaki Oyj., WestRock LLC, DS Smith Plc, The Mondi Group plc, International Paper Company, Detmold Group, Sealed Air Corporation
Additional Attributes Innovation in recyclable and biodegradable packaging materials, Adoption trends in food and beverage segments, Market shift toward lightweight and durable packaging, Regional regulatory impact on sustainable material use, Growth in e-commerce packaging solutions
Customization and Pricing Customization and Pricing Available on Request

Key Segments

By Material Type:

The sustainable packaging market is categorized by material type, including paper and paperboard, plastic, metal, glass, fabric, wood, and other materials. The paper and paperboard segment consists of coated unbleached, bleached paperboard, molded fiber pulp, kraft paper, and corrugated board/boxboard.

The plastic segment includes poly lactic acid (PLA), polybutylene succinate (PBS), polyhydroxyalkanoates (PHAs), starch-based plastics, and other plastics such as polyvinyl alcohol (PVA), polyvinyl alcohol (PVOH), and polybutylene adipate terephthalate (PBAT). The metal segment is further divided into steel and aluminum.

By Packaging Type:

Sustainable packaging solutions come in various types, including bags and sacks, trays and clamshells, cartons and boxes, cans, bottles and jars, films and wraps, pouches and sachets, drums, intermediate bulk containers (IBC), vials and ampoules, tapes and labels, and other formats such as jerry cans, bowls, and cutlery.

By Distribution Channel:

The distribution of sustainable packaging products occurs through different channels, including direct sales from manufacturers, distributors, and retailers.

By End Use:

Sustainable packaging is widely used across multiple industries, including food, beverages, cosmetics and personal care, chemicals, healthcare, agriculture, and other industrial applications. The food segment includes bakery and confectionery, dairy, fresh produce, snack food, and other processed food. The beverages category is further divided into non-alcoholic and alcoholic beverages.

By Region:

Key Countries of North America, Latin America, East Asia, South Asia & Pacific, Western Europe, Eastern Europe and Middle East & Africa are covered.

Table of Content

  1. Executive Summary
    • Global Market Outlook
    • Demand-side Trends
    • Supply-side Trends
    • Technology Roadmap Analysis
    • Analysis and Recommendations
  2. Market Overview
    • Market Coverage / Taxonomy
    • Market Definition / Scope / Limitations
  3. Market Background
    • Market Dynamics
      • Drivers
      • Restraints
      • Opportunity
      • Trends
    • Scenario Forecast
      • Demand in Optimistic Scenario
      • Demand in Likely Scenario
      • Demand in Conservative Scenario
    • Opportunity Map Analysis
    • Product Life Cycle Analysis
    • Supply Chain Analysis
      • Supply Side Participants and their Roles
        • Producers
        • Mid-Level Participants (Traders/ Agents/ Brokers)
        • Wholesalers and Distributors
      • Value Added and Value Created at Node in the Supply Chain
      • List of Raw Material Suppliers
      • List of Existing and Potential Buyer’s
    • Investment Feasibility Matrix
    • Value Chain Analysis
      • Profit Margin Analysis
      • Wholesalers and Distributors
      • Retailers
    • PESTLE and Porter’s Analysis
    • Regulatory Landscape
      • By Key Regions
      • By Key Countries
    • Regional Parent Market Outlook
    • Production and Consumption Statistics
    • Import and Export Statistics
  4. Global Market Analysis 2020 to 2024 and Forecast, 2025 to 2035
    • Historical Market Size Value (USD Million) & Volume (Units) Analysis, 2020 to 2024
    • Current and Future Market Size Value (USD Million) & Volume (Units) Projections, 2025 to 2035
      • Y-o-Y Growth Trend Analysis
      • Absolute $ Opportunity Analysis
  5. Global Market Pricing Analysis 2020 to 2024 and Forecast 2025 to 2035
  6. Global Market Analysis 2020 to 2024 and Forecast 2025 to 2035, By Material Type
    • Introduction / Key Findings
    • Historical Market Size Value (USD Million) & Volume (Units) Analysis By Material Type, 2020 to 2024
    • Current and Future Market Size Value (USD Million) & Volume (Units) Analysis and Forecast By Material Type, 2025 to 2035
      • Paper & Paperboard
      • Bioplastics
      • Recycled Plastics
      • Glass
      • Aluminum
      • Plant-Based Fibers
    • Y-o-Y Growth Trend Analysis By Material Type, 2020 to 2024
    • Absolute $ Opportunity Analysis By Material Type, 2025 to 2035
  7. Global Market Analysis 2020 to 2024 and Forecast 2025 to 2035, By Packaging Format
    • Introduction / Key Findings
    • Historical Market Size Value (USD Million) & Volume (Units) Analysis By Packaging Format, 2020 to 2024
    • Current and Future Market Size Value (USD Million) & Volume (Units) Analysis and Forecast By Packaging Format, 2025 to 2035
      • Boxes & Cartons
      • Pouches & Sachets
      • Bottles & Jars
      • Trays & Clamshells
      • Wraps & Films
      • Bags & Sacks
    • Y-o-Y Growth Trend Analysis By Packaging Format, 2020 to 2024
    • Absolute $ Opportunity Analysis By Packaging Format, 2025 to 2035
  8. Global Market Analysis 2020 to 2024 and Forecast 2025 to 2035, By Process Type
    • Introduction / Key Findings
    • Historical Market Size Value (USD Million) & Volume (Units) Analysis By Process Type, 2020 to 2024
    • Current and Future Market Size Value (USD Million) & Volume (Units) Analysis and Forecast By Process Type, 2025 to 2035
      • Recyclable Packaging
      • Compostable Packaging
      • Biodegradable Packaging
      • Reusable/Refillable Packaging
      • Upcycled Packaging
    • Y-o-Y Growth Trend Analysis By Process Type, 2020 to 2024
    • Absolute $ Opportunity Analysis By Process Type, 2025 to 2035
  9. Global Market Analysis 2020 to 2024 and Forecast 2025 to 2035, By End-Use Industry
    • Introduction / Key Findings
    • Historical Market Size Value (USD Million) & Volume (Units) Analysis By End-Use Industry, 2020 to 2024
    • Current and Future Market Size Value (USD Million) & Volume (Units) Analysis and Forecast By End-Use Industry, 2025 to 2035
      • Food & Beverage
      • Personal Care & Cosmetics
      • Pharmaceuticals
      • Consumer Electronics
      • Household Products
      • E-commerce & Retail
    • Y-o-Y Growth Trend Analysis By End-Use Industry, 2020 to 2024
    • Absolute $ Opportunity Analysis By End-Use Industry, 2025 to 2035
  10. Global Market Analysis 2020 to 2024 and Forecast 2025 to 2035, By Region
    • Introduction
    • Historical Market Size Value (USD Million) & Volume (Units) Analysis By Region, 2020 to 2024
    • Current Market Size Value (USD Million) & Volume (Units) Analysis and Forecast By Region, 2025 to 2035
      • North America
      • Latin America
      • Europe
      • East Asia
      • South Asia
      • Oceania
      • MEA
    • Market Attractiveness Analysis By Region
  11. North America Market Analysis 2020 to 2024 and Forecast 2025 to 2035, By Country
    • Historical Market Size Value (USD Million) & Volume (Units) Trend Analysis By Market Taxonomy, 2020 to 2024
    • Market Size Value (USD Million) & Volume (Units) Forecast By Market Taxonomy, 2025 to 2035
      • By Country
        • USA
        • Canada
      • By Material Type
      • By Packaging Format
      • By Process Type
      • By End-Use Industry
    • Market Attractiveness Analysis
      • By Country
      • By Material Type
      • By Packaging Format
      • By Process Type
      • By End-Use Industry
    • Key Takeaways
  12. Latin America Market Analysis 2020 to 2024 and Forecast 2025 to 2035, By Country
    • Historical Market Size Value (USD Million) & Volume (Units) Trend Analysis By Market Taxonomy, 2020 to 2024
    • Market Size Value (USD Million) & Volume (Units) Forecast By Market Taxonomy, 2025 to 2035
      • By Country
        • Brazil
        • Mexico
        • Argentina
        • Chile
        • Peru
        • Rest of Latin America
      • By Material Type
      • By Packaging Format
      • By Process Type
      • By End-Use Industry
    • Market Attractiveness Analysis
      • By Country
      • By Material Type
      • By Packaging Format
      • By Process Type
      • By End-Use Industry
    • Key Takeaways
  13. Europe Market Analysis 2020 to 2024 and Forecast 2025 to 2035, By Country
    • Historical Market Size Value (USD Million) & Volume (Units) Trend Analysis By Market Taxonomy, 2020 to 2024
    • Market Size Value (USD Million) & Volume (Units) Forecast By Market Taxonomy, 2025 to 2035
      • By Country
        • Germany
        • Italy
        • France
        • UK
        • Spain
        • Russia
        • BENELUX
        • Rest of Europe
      • By Material Type
      • By Packaging Format
      • By Process Type
      • By End-Use Industry
    • Market Attractiveness Analysis
      • By Country
      • By Material Type
      • By Packaging Format
      • By Process Type
      • By End-Use Industry
    • Key Takeaways
  14. East Asia Market Analysis 2020 to 2024 and Forecast 2025 to 2035, By Country
    • Historical Market Size Value (USD Million) & Volume (Units) Trend Analysis By Market Taxonomy, 2020 to 2024
    • Market Size Value (USD Million) & Volume (Units) Forecast By Market Taxonomy, 2025 to 2035
      • By Country
        • China
        • Japan
        • South Korea
      • By Material Type
      • By Packaging Format
      • By Process Type
      • By End-Use Industry
    • Market Attractiveness Analysis
      • By Country
      • By Material Type
      • By Packaging Format
      • By Process Type
      • By End-Use Industry
    • Key Takeaways
  15. South Asia Market Analysis 2020 to 2024 and Forecast 2025 to 2035, By Country
    • Historical Market Size Value (USD Million) & Volume (Units) Trend Analysis By Market Taxonomy, 2020 to 2024
    • Market Size Value (USD Million) & Volume (Units) Forecast By Market Taxonomy, 2025 to 2035
      • By Country
        • India
        • Thailand
        • Malaysia
        • Indonesia
        • Rest of South Asia
      • By Material Type
      • By Packaging Format
      • By Process Type
      • By End-Use Industry
    • Market Attractiveness Analysis
      • By Country
      • By Material Type
      • By Packaging Format
      • By Process Type
      • By End-Use Industry
    • Key Takeaways
  16. Oceania Market Analysis 2020 to 2024 and Forecast 2025 to 2035, By Country
    • Historical Market Size Value (USD Million) & Volume (Units) Trend Analysis By Market Taxonomy, 2020 to 2024
    • Market Size Value (USD Million) & Volume (Units) Forecast By Market Taxonomy, 2025 to 2035
      • By Country
        • Australia
        • New Zealand
      • By Material Type
      • By Packaging Format
      • By Process Type
      • By End-Use Industry
    • Market Attractiveness Analysis
      • By Country
      • By Material Type
      • By Packaging Format
      • By Process Type
      • By End-Use Industry
    • Key Takeaways
  17. MEA Market Analysis 2020 to 2024 and Forecast 2025 to 2035, By Country
    • Historical Market Size Value (USD Million) & Volume (Units) Trend Analysis By Market Taxonomy, 2020 to 2024
    • Market Size Value (USD Million) & Volume (Units) Forecast By Market Taxonomy, 2025 to 2035
      • By Country
        • GCC
        • Rest of MEA
      • By Material Type
      • By Packaging Format
      • By Process Type
      • By End-Use Industry
    • Market Attractiveness Analysis
      • By Country
      • By Material Type
      • By Packaging Format
      • By Process Type
      • By End-Use Industry
    • Key Takeaways
  18. Key Countries Market Analysis
    • USA
      • Pricing Analysis
      • Market Share Analysis, 2024
        • By Material Type
        • By Packaging Format
        • By Process Type
        • By End-Use Industry
    • Canada
      • Pricing Analysis
      • Market Share Analysis, 2024
        • By Material Type
        • By Packaging Format
        • By Process Type
        • By End-Use Industry
    • Brazil
      • Pricing Analysis
      • Market Share Analysis, 2024
        • By Material Type
        • By Packaging Format
        • By Process Type
        • By End-Use Industry
    • Mexico
      • Pricing Analysis
      • Market Share Analysis, 2024
        • By Material Type
        • By Packaging Format
        • By Process Type
        • By End-Use Industry
    • Argentina
      • Pricing Analysis
      • Market Share Analysis, 2024
        • By Material Type
        • By Packaging Format
        • By Process Type
        • By End-Use Industry
  19. Market Structure Analysis
    • Competition Dashboard
    • Competition Benchmarking
    • Market Share Analysis of Top Players
      • By Regional
      • By Material Type
      • By Packaging Format
      • By Process Type
      • By End-Use Industry
  20. Competition Analysis
    • Competition Deep Dive
      • Amcor Plc
        • Overview
        • Product Portfolio
        • Profitability by Market Segments (Product/Age /Sales Channel/Region)
        • Sales Footprint
        • Strategy Overview
          • Marketing Strategy
          • Product Strategy
          • Channel Strategy
      • Mondi Group
        • Overview
        • Product Portfolio
        • Profitability by Market Segments (Product/Age /Sales Channel/Region)
        • Sales Footprint
        • Strategy Overview
          • Marketing Strategy
          • Product Strategy
          • Channel Strategy
      • Smurfit Kappa Group
        • Overview
        • Product Portfolio
        • Profitability by Market Segments (Product/Age /Sales Channel/Region)
        • Sales Footprint
        • Strategy Overview
          • Marketing Strategy
          • Product Strategy
          • Channel Strategy
      • Sealed Air Corporation
        • Overview
        • Product Portfolio
        • Profitability by Market Segments (Product/Age /Sales Channel/Region)
        • Sales Footprint
        • Strategy Overview
          • Marketing Strategy
          • Product Strategy
          • Channel Strategy
      • Huhtamaki Oyj
        • Overview
        • Product Portfolio
        • Profitability by Market Segments (Product/Age /Sales Channel/Region)
        • Sales Footprint
        • Strategy Overview
          • Marketing Strategy
          • Product Strategy
          • Channel Strategy
      • Tetra Pak International S.A.
        • Overview
        • Product Portfolio
        • Profitability by Market Segments (Product/Age /Sales Channel/Region)
        • Sales Footprint
        • Strategy Overview
          • Marketing Strategy
          • Product Strategy
          • Channel Strategy
      • DS Smith Plc
        • Overview
        • Product Portfolio
        • Profitability by Market Segments (Product/Age /Sales Channel/Region)
        • Sales Footprint
        • Strategy Overview
          • Marketing Strategy
          • Product Strategy
          • Channel Strategy
      • Berry Global Inc.
        • Overview
        • Product Portfolio
        • Profitability by Market Segments (Product/Age /Sales Channel/Region)
        • Sales Footprint
        • Strategy Overview
          • Marketing Strategy
          • Product Strategy
          • Channel Strategy
      • WestRock Company
        • Overview
        • Product Portfolio
        • Profitability by Market Segments (Product/Age /Sales Channel/Region)
        • Sales Footprint
        • Strategy Overview
          • Marketing Strategy
          • Product Strategy
          • Channel Strategy
      • Constantia Flexibles Group GmbH
        • Overview
        • Product Portfolio
        • Profitability by Market Segments (Product/Age /Sales Channel/Region)
        • Sales Footprint
        • Strategy Overview
          • Marketing Strategy
          • Product Strategy
          • Channel Strategy
  21. Assumptions & Acronyms Used
  22. Research Methodology

List of Tables

  • Table 1: Global Market Value (USD Million) Forecast by Region, 2020-2035
  • Table 2: Global Market Volume (Units) Forecast by Region, 2020-2035
  • Table 3: Global Market Value (USD Million) Forecast by Material Type, 2020-2035
  • Table 4: Global Market Volume (Units) Forecast by Material Type, 2020-2035
  • Table 5: Global Market Value (USD Million) Forecast by Packaging Format, 2020-2035
  • Table 6: Global Market Volume (Units) Forecast by Packaging Format, 2020-2035
  • Table 7: Global Market Value (USD Million) Forecast by Process Type, 2020-2035
  • Table 8: Global Market Volume (Units) Forecast by Process Type, 2020-2035
  • Table 9: Global Market Value (USD Million) Forecast by End-Use Industry, 2020-2035
  • Table 10: Global Market Volume (Units) Forecast by End-Use Industry, 2020-2035
  • Table 11: North America Market Value (USD Million) Forecast by Country, 2020-2035
  • Table 12: North America Market Volume (Units) Forecast by Country, 2020-2035
  • Table 13: North America Market Value (USD Million) Forecast by Material Type, 2020-2035
  • Table 14: North America Market Volume (Units) Forecast by Material Type, 2020-2035
  • Table 15: North America Market Value (USD Million) Forecast by Packaging Format, 2020-2035
  • Table 16: North America Market Volume (Units) Forecast by Packaging Format, 2020-2035
  • Table 17: North America Market Value (USD Million) Forecast by Process Type, 2020-2035
  • Table 18: North America Market Volume (Units) Forecast by Process Type, 2020-2035
  • Table 19: North America Market Value (USD Million) Forecast by End-Use Industry, 2020-2035
  • Table 20: North America Market Volume (Units) Forecast by End-Use Industry, 2020-2035
  • Table 21: Latin America Market Value (USD Million) Forecast by Country, 2020-2035
  • Table 22: Latin America Market Volume (Units) Forecast by Country, 2020-2035
  • Table 23: Latin America Market Value (USD Million) Forecast by Material Type, 2020-2035
  • Table 24: Latin America Market Volume (Units) Forecast by Material Type, 2020-2035
  • Table 25: Latin America Market Value (USD Million) Forecast by Packaging Format, 2020-2035
  • Table 26: Latin America Market Volume (Units) Forecast by Packaging Format, 2020-2035
  • Table 27: Latin America Market Value (USD Million) Forecast by Process Type, 2020-2035
  • Table 28: Latin America Market Volume (Units) Forecast by Process Type, 2020-2035
  • Table 29: Latin America Market Value (USD Million) Forecast by End-Use Industry, 2020-2035
  • Table 30: Latin America Market Volume (Units) Forecast by End-Use Industry, 2020-2035
  • Table 31: Europe Market Value (USD Million) Forecast by Country, 2020-2035
  • Table 32: Europe Market Volume (Units) Forecast by Country, 2020-2035
  • Table 33: Europe Market Value (USD Million) Forecast by Material Type, 2020-2035
  • Table 34: Europe Market Volume (Units) Forecast by Material Type, 2020-2035
  • Table 35: Europe Market Value (USD Million) Forecast by Packaging Format, 2020-2035
  • Table 36: Europe Market Volume (Units) Forecast by Packaging Format, 2020-2035
  • Table 37: Europe Market Value (USD Million) Forecast by Process Type, 2020-2035
  • Table 38: Europe Market Volume (Units) Forecast by Process Type, 2020-2035
  • Table 39: Europe Market Value (USD Million) Forecast by End-Use Industry, 2020-2035
  • Table 40: Europe Market Volume (Units) Forecast by End-Use Industry, 2020-2035
  • Table 41: East Asia Market Value (USD Million) Forecast by Country, 2020-2035
  • Table 42: East Asia Market Volume (Units) Forecast by Country, 2020-2035
  • Table 43: East Asia Market Value (USD Million) Forecast by Material Type, 2020-2035
  • Table 44: East Asia Market Volume (Units) Forecast by Material Type, 2020-2035
  • Table 45: East Asia Market Value (USD Million) Forecast by Packaging Format, 2020-2035
  • Table 46: East Asia Market Volume (Units) Forecast by Packaging Format, 2020-2035
  • Table 47: East Asia Market Value (USD Million) Forecast by Process Type, 2020-2035
  • Table 48: East Asia Market Volume (Units) Forecast by Process Type, 2020-2035
  • Table 49: East Asia Market Value (USD Million) Forecast by End-Use Industry, 2020-2035
  • Table 50: East Asia Market Volume (Units) Forecast by End-Use Industry, 2020-2035
  • Table 51: South Asia Market Value (USD Million) Forecast by Country, 2020-2035
  • Table 52: South Asia Market Volume (Units) Forecast by Country, 2020-2035
  • Table 53: South Asia Market Value (USD Million) Forecast by Material Type, 2020-2035
  • Table 54: South Asia Market Volume (Units) Forecast by Material Type, 2020-2035
  • Table 55: South Asia Market Value (USD Million) Forecast by Packaging Format, 2020-2035
  • Table 56: South Asia Market Volume (Units) Forecast by Packaging Format, 2020-2035
  • Table 57: South Asia Market Value (USD Million) Forecast by Process Type, 2020-2035
  • Table 58: South Asia Market Volume (Units) Forecast by Process Type, 2020-2035
  • Table 59: South Asia Market Value (USD Million) Forecast by End-Use Industry, 2020-2035
  • Table 60: South Asia Market Volume (Units) Forecast by End-Use Industry, 2020-2035
  • Table 61: Oceania Market Value (USD Million) Forecast by Country, 2020-2035
  • Table 62: Oceania Market Volume (Units) Forecast by Country, 2020-2035
  • Table 63: Oceania Market Value (USD Million) Forecast by Material Type, 2020-2035
  • Table 64: Oceania Market Volume (Units) Forecast by Material Type, 2020-2035
  • Table 65: Oceania Market Value (USD Million) Forecast by Packaging Format, 2020-2035
  • Table 66: Oceania Market Volume (Units) Forecast by Packaging Format, 2020-2035
  • Table 67: Oceania Market Value (USD Million) Forecast by Process Type, 2020-2035
  • Table 68: Oceania Market Volume (Units) Forecast by Process Type, 2020-2035
  • Table 69: Oceania Market Value (USD Million) Forecast by End-Use Industry, 2020-2035
  • Table 70: Oceania Market Volume (Units) Forecast by End-Use Industry, 2020-2035
  • Table 71: MEA Market Value (USD Million) Forecast by Country, 2020-2035
  • Table 72: MEA Market Volume (Units) Forecast by Country, 2020-2035
  • Table 73: MEA Market Value (USD Million) Forecast by Material Type, 2020-2035
  • Table 74: MEA Market Volume (Units) Forecast by Material Type, 2020-2035
  • Table 75: MEA Market Value (USD Million) Forecast by Packaging Format, 2020-2035
  • Table 76: MEA Market Volume (Units) Forecast by Packaging Format, 2020-2035
  • Table 77: MEA Market Value (USD Million) Forecast by Process Type, 2020-2035
  • Table 78: MEA Market Volume (Units) Forecast by Process Type, 2020-2035
  • Table 79: MEA Market Value (USD Million) Forecast by End-Use Industry, 2020-2035
  • Table 80: MEA Market Volume (Units) Forecast by End-Use Industry, 2020-2035

List of Figures

  • Figure 1: Global Market Volume (Units) Forecast 2020-2035
  • Figure 2: Global Market Pricing Analysis
  • Figure 3: Global Market Value (USD Million) Forecast 2020-2035
  • Figure 4: Global Market Value Share and BPS Analysis by Material Type, 2025 and 2035
  • Figure 5: Global Market Y-o-Y Growth Comparison by Material Type, 2025-2035
  • Figure 6: Global Market Attractiveness Analysis by Material Type
  • Figure 7: Global Market Value Share and BPS Analysis by Packaging Format, 2025 and 2035
  • Figure 8: Global Market Y-o-Y Growth Comparison by Packaging Format, 2025-2035
  • Figure 9: Global Market Attractiveness Analysis by Packaging Format
  • Figure 10: Global Market Value Share and BPS Analysis by Process Type, 2025 and 2035
  • Figure 11: Global Market Y-o-Y Growth Comparison by Process Type, 2025-2035
  • Figure 12: Global Market Attractiveness Analysis by Process Type
  • Figure 13: Global Market Value Share and BPS Analysis by End-Use Industry, 2025 and 2035
  • Figure 14: Global Market Y-o-Y Growth Comparison by End-Use Industry, 2025-2035
  • Figure 15: Global Market Attractiveness Analysis by End-Use Industry
  • Figure 16: Global Market Value (USD Million) Share and BPS Analysis by Region, 2025 and 2035
  • Figure 17: Global Market Y-o-Y Growth Comparison by Region, 2025-2035
  • Figure 18: Global Market Attractiveness Analysis by Region
  • Figure 19: North America Market Incremental $ Opportunity, 2025-2035
  • Figure 20: Latin America Market Incremental $ Opportunity, 2025-2035
  • Figure 21: Europe Market Incremental $ Opportunity, 2025-2035
  • Figure 22: East Asia Market Incremental $ Opportunity, 2025-2035
  • Figure 23: South Asia Market Incremental $ Opportunity, 2025-2035
  • Figure 24: Oceania Market Incremental $ Opportunity, 2025-2035
  • Figure 25: MEA Market Incremental $ Opportunity, 2025-2035
  • Figure 26: North America Market Value Share and BPS Analysis by Country, 2025 and 2035
  • Figure 27: North America Market Value Share and BPS Analysis by Material Type, 2025 and 2035
  • Figure 28: North America Market Y-o-Y Growth Comparison by Material Type, 2025-2035
  • Figure 29: North America Market Attractiveness Analysis by Material Type
  • Figure 30: North America Market Value Share and BPS Analysis by Packaging Format, 2025 and 2035
  • Figure 31: North America Market Y-o-Y Growth Comparison by Packaging Format, 2025-2035
  • Figure 32: North America Market Attractiveness Analysis by Packaging Format
  • Figure 33: North America Market Value Share and BPS Analysis by Process Type, 2025 and 2035
  • Figure 34: North America Market Y-o-Y Growth Comparison by Process Type, 2025-2035
  • Figure 35: North America Market Attractiveness Analysis by Process Type
  • Figure 36: North America Market Value Share and BPS Analysis by End-Use Industry, 2025 and 2035
  • Figure 37: North America Market Y-o-Y Growth Comparison by End-Use Industry, 2025-2035
  • Figure 38: North America Market Attractiveness Analysis by End-Use Industry
  • Figure 39: Latin America Market Value Share and BPS Analysis by Country, 2025 and 2035
  • Figure 40: Latin America Market Value Share and BPS Analysis by Material Type, 2025 and 2035
  • Figure 41: Latin America Market Y-o-Y Growth Comparison by Material Type, 2025-2035
  • Figure 42: Latin America Market Attractiveness Analysis by Material Type
  • Figure 43: Latin America Market Value Share and BPS Analysis by Packaging Format, 2025 and 2035
  • Figure 44: Latin America Market Y-o-Y Growth Comparison by Packaging Format, 2025-2035
  • Figure 45: Latin America Market Attractiveness Analysis by Packaging Format
  • Figure 46: Latin America Market Value Share and BPS Analysis by Process Type, 2025 and 2035
  • Figure 47: Latin America Market Y-o-Y Growth Comparison by Process Type, 2025-2035
  • Figure 48: Latin America Market Attractiveness Analysis by Process Type
  • Figure 49: Latin America Market Value Share and BPS Analysis by End-Use Industry, 2025 and 2035
  • Figure 50: Latin America Market Y-o-Y Growth Comparison by End-Use Industry, 2025-2035
  • Figure 51: Latin America Market Attractiveness Analysis by End-Use Industry
  • Figure 52: Europe Market Value Share and BPS Analysis by Country, 2025 and 2035
  • Figure 53: Europe Market Value Share and BPS Analysis by Material Type, 2025 and 2035
  • Figure 54: Europe Market Y-o-Y Growth Comparison by Material Type, 2025-2035
  • Figure 55: Europe Market Attractiveness Analysis by Material Type
  • Figure 56: Europe Market Value Share and BPS Analysis by Packaging Format, 2025 and 2035
  • Figure 57: Europe Market Y-o-Y Growth Comparison by Packaging Format, 2025-2035
  • Figure 58: Europe Market Attractiveness Analysis by Packaging Format
  • Figure 59: Europe Market Value Share and BPS Analysis by Process Type, 2025 and 2035
  • Figure 60: Europe Market Y-o-Y Growth Comparison by Process Type, 2025-2035
  • Figure 61: Europe Market Attractiveness Analysis by Process Type
  • Figure 62: Europe Market Value Share and BPS Analysis by End-Use Industry, 2025 and 2035
  • Figure 63: Europe Market Y-o-Y Growth Comparison by End-Use Industry, 2025-2035
  • Figure 64: Europe Market Attractiveness Analysis by End-Use Industry
  • Figure 65: East Asia Market Value Share and BPS Analysis by Country, 2025 and 2035
  • Figure 66: East Asia Market Value Share and BPS Analysis by Material Type, 2025 and 2035
  • Figure 67: East Asia Market Y-o-Y Growth Comparison by Material Type, 2025-2035
  • Figure 68: East Asia Market Attractiveness Analysis by Material Type
  • Figure 69: East Asia Market Value Share and BPS Analysis by Packaging Format, 2025 and 2035
  • Figure 70: East Asia Market Y-o-Y Growth Comparison by Packaging Format, 2025-2035
  • Figure 71: East Asia Market Attractiveness Analysis by Packaging Format
  • Figure 72: East Asia Market Value Share and BPS Analysis by Process Type, 2025 and 2035
  • Figure 73: East Asia Market Y-o-Y Growth Comparison by Process Type, 2025-2035
  • Figure 74: East Asia Market Attractiveness Analysis by Process Type
  • Figure 75: East Asia Market Value Share and BPS Analysis by End-Use Industry, 2025 and 2035
  • Figure 76: East Asia Market Y-o-Y Growth Comparison by End-Use Industry, 2025-2035
  • Figure 77: East Asia Market Attractiveness Analysis by End-Use Industry
  • Figure 78: South Asia Market Value Share and BPS Analysis by Country, 2025 and 2035
  • Figure 79: South Asia Market Value Share and BPS Analysis by Material Type, 2025 and 2035
  • Figure 80: South Asia Market Y-o-Y Growth Comparison by Material Type, 2025-2035
  • Figure 81: South Asia Market Attractiveness Analysis by Material Type
  • Figure 82: South Asia Market Value Share and BPS Analysis by Packaging Format, 2025 and 2035
  • Figure 83: South Asia Market Y-o-Y Growth Comparison by Packaging Format, 2025-2035
  • Figure 84: South Asia Market Attractiveness Analysis by Packaging Format
  • Figure 85: South Asia Market Value Share and BPS Analysis by Process Type, 2025 and 2035
  • Figure 86: South Asia Market Y-o-Y Growth Comparison by Process Type, 2025-2035
  • Figure 87: South Asia Market Attractiveness Analysis by Process Type
  • Figure 88: South Asia Market Value Share and BPS Analysis by End-Use Industry, 2025 and 2035
  • Figure 89: South Asia Market Y-o-Y Growth Comparison by End-Use Industry, 2025-2035
  • Figure 90: South Asia Market Attractiveness Analysis by End-Use Industry
  • Figure 91: Oceania Market Value Share and BPS Analysis by Country, 2025 and 2035
  • Figure 92: Oceania Market Value Share and BPS Analysis by Material Type, 2025 and 2035
  • Figure 93: Oceania Market Y-o-Y Growth Comparison by Material Type, 2025-2035
  • Figure 94: Oceania Market Attractiveness Analysis by Material Type
  • Figure 95: Oceania Market Value Share and BPS Analysis by Packaging Format, 2025 and 2035
  • Figure 96: Oceania Market Y-o-Y Growth Comparison by Packaging Format, 2025-2035
  • Figure 97: Oceania Market Attractiveness Analysis by Packaging Format
  • Figure 98: Oceania Market Value Share and BPS Analysis by Process Type, 2025 and 2035
  • Figure 99: Oceania Market Y-o-Y Growth Comparison by Process Type, 2025-2035
  • Figure 100: Oceania Market Attractiveness Analysis by Process Type
  • Figure 101: Oceania Market Value Share and BPS Analysis by End-Use Industry, 2025 and 2035
  • Figure 102: Oceania Market Y-o-Y Growth Comparison by End-Use Industry, 2025-2035
  • Figure 103: Oceania Market Attractiveness Analysis by End-Use Industry
  • Figure 104: MEA Market Value Share and BPS Analysis by Country, 2025 and 2035
  • Figure 105: MEA Market Value Share and BPS Analysis by Material Type, 2025 and 2035
  • Figure 106: MEA Market Y-o-Y Growth Comparison by Material Type, 2025-2035
  • Figure 107: MEA Market Attractiveness Analysis by Material Type
  • Figure 108: MEA Market Value Share and BPS Analysis by Packaging Format, 2025 and 2035
  • Figure 109: MEA Market Y-o-Y Growth Comparison by Packaging Format, 2025-2035
  • Figure 110: MEA Market Attractiveness Analysis by Packaging Format
  • Figure 111: MEA Market Value Share and BPS Analysis by Process Type, 2025 and 2035
  • Figure 112: MEA Market Y-o-Y Growth Comparison by Process Type, 2025-2035
  • Figure 113: MEA Market Attractiveness Analysis by Process Type
  • Figure 114: MEA Market Value Share and BPS Analysis by End-Use Industry, 2025 and 2035
  • Figure 115: MEA Market Y-o-Y Growth Comparison by End-Use Industry, 2025-2035
  • Figure 116: MEA Market Attractiveness Analysis by End-Use Industry
  • Figure 117: Global Market - Tier Structure Analysis
  • Figure 118: Global Market - Company Share Analysis

Frequently Asked Questions

What is the future of sustainable packaging market?

The sustainable packaging market is projected to witness CAGR of 5.8% between 2025 and 2035.

What was the worth of the sustainable packaging market in 2024?

The sustainable packaging market stood at 285.3 billion in 2024.

What will the worth of sustainable packaging market by 2035 end?

Sustainable packaging market is anticipated to reach USD 530.4 billion by 2035 end.

Which region to showcase the highest CAGR during forecast period?

East Asiais set to record a CAGR of 6.9% in assessment period.

Who are the key players of sustainable packaging market?

The key players operating in the sustainable packaging market include Amcor Plc, Stora Enso Oyj, Berry Global Inc., Huhtamaki Oyj, WestRock LLC, DS Smith Plc.

Explore Similar Insights

Future Market Insights

Sustainable Packaging Market