The New Zealand Sustainable Tourism Market is estimated to be valued at USD 12.7 million in 2025 and is projected to reach USD 57.7 million by 2035, registering a compound annual growth rate (CAGR) of 16.3% over the forecast period.
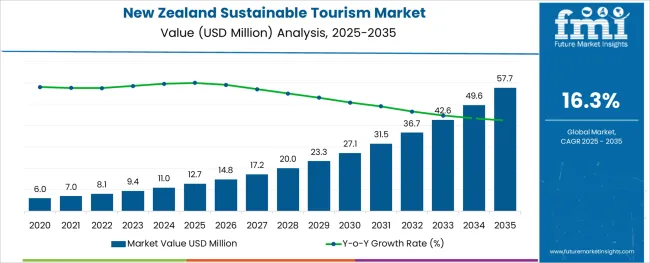
The New Zealand sustainable tourism market is undergoing accelerated transformation as the country balances its global appeal with ecological preservation. Government-backed sustainability programs, carbon-neutral initiatives, and indigenous tourism partnerships are aligning with evolving traveler values centered on environmental responsibility and cultural authenticity.
Tour operators are increasingly redesigning offerings to reduce carbon footprints, promote local sourcing, and educate tourists on conservation. Investments in regenerative tourism infrastructure, eco-certifications, and low-impact mobility options are also being prioritized.
As global travel resumes and climate-aware travelers increase, New Zealand is leveraging its natural landscape and policy leadership to position itself as a premium destination for sustainability-first experiences. The convergence of digital booking tools, responsible travel narratives, and strong domestic participation is expected to reinforce long-term industry resilience and open new channels for growth in off-peak and rural regions.
The market is segmented by Tourism Type, Booking Channel, Tourist Type, Tour Type, Consumer Orientation, and Age Group and region. By Tourism Type, the market is divided into Eco-Tourism, Green Tourism, Soft Tourism, and Community Tourism. In terms of Booking Channel, the market is classified into Online Booking, In-Person Booking, and Phone Booking. Based on Tourist Type, the market is segmented into Domestic and International. By Tour Type, the market is divided into Independent Traveler, Tour Group, and Package Traveler. By Consumer Orientation, the market is segmented into Men and Women. By Age Group, the market is segmented into 26-35 Years, 36-45 Years, 46-55 Years, 66-75 Years, and 15-25 Years. Regionally, the market is classified into North America, Latin America, Western Europe, Eastern Europe, Balkan & Baltic Countries, Russia & Belarus, Central Asia, East Asia, South Asia & Pacific, and the Middle East & Africa.
The market is segmented by Tourism Type, Booking Channel, Tourist Type, Tour Type, Consumer Orientation, and Age Group and region. By Tourism Type, the market is divided into Eco-Tourism, Green Tourism, Soft Tourism, and Community Tourism. In terms of Booking Channel, the market is classified into Online Booking, In-Person Booking, and Phone Booking. Based on Tourist Type, the market is segmented into Domestic and International. By Tour Type, the market is divided into Independent Traveler, Tour Group, and Package Traveler. By Consumer Orientation, the market is segmented into Men and Women. By Age Group, the market is segmented into 26-35 Years, 36-45 Years, 46-55 Years, 66-75 Years, and 15-25 Years. Regionally, the market is classified into North America, Latin America, Western Europe, Eastern Europe, Balkan & Baltic Countries, Russia & Belarus, Central Asia, East Asia, South Asia & Pacific, and the Middle East & Africa.
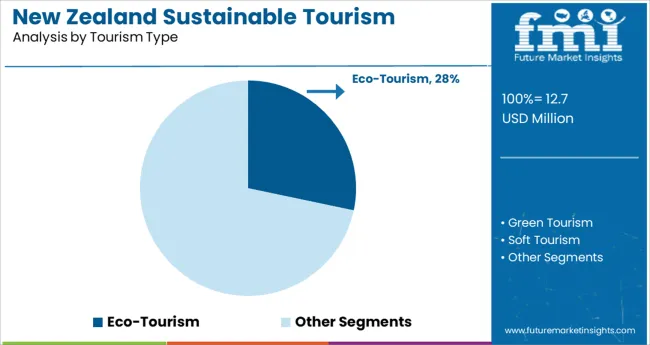
The eco tourism category is projected to contribute 28.30% of revenue in 2025 within the tourism type segment, making it the leading subsegment. This leadership is being driven by New Zealand’s strong environmental stewardship, protected landscapes, and visitor demand for immersive nature experiences with minimal ecological disruption.
Operators have shifted toward guided activities that support wildlife conservation, native biodiversity, and traditional Maori land-use practices. Regulatory encouragement and national park collaborations have enabled controlled growth while preserving ecological integrity.
Consumer interest in forest therapy, carbon-positive activities, and wilderness lodges is contributing to sustained demand. The country’s global branding as a clean green destination and its carbon zero tourism initiatives are expected to keep eco tourism at the forefront of sustainable travel preferences.
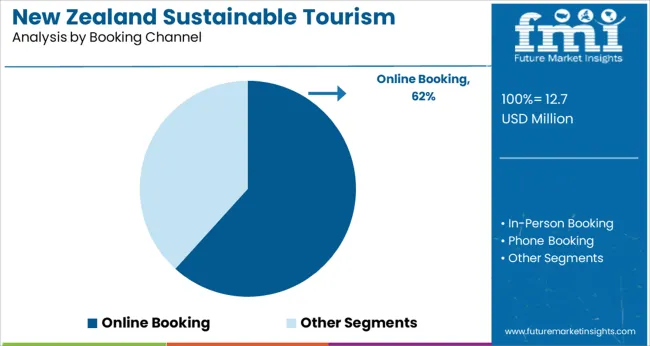
Online booking platforms are expected to account for 61.70% of revenue in 2025 under the booking channel category, affirming their position as the dominant mode of travel engagement. This dominance is being reinforced by travelers’ preference for transparency, mobile accessibility, and dynamic itinerary customization.
Operators have increasingly adopted real-time inventory systems, contactless payments, and eco certification tagging on booking interfaces to attract sustainability-minded consumers. Digital platforms also facilitate direct communication with local operators and communities, enhancing authenticity and trust.
The convenience of online planning tools and increased reliance on digital experiences during and post-pandemic have accelerated this trend. Strategic partnerships between tourism boards, aggregators, and eco travel startups have further strengthened digital reach and booking conversions across international and domestic traveler segments.
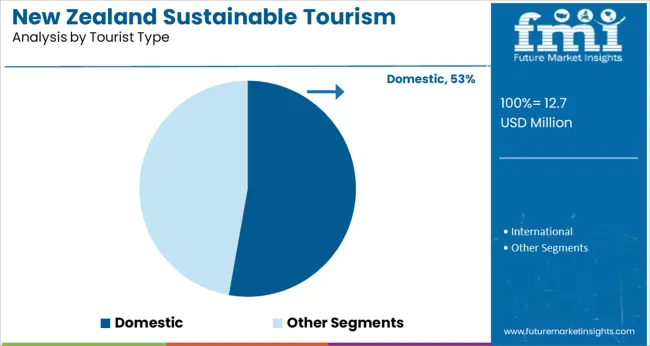
Domestic tourists are projected to contribute 52.80% of total market revenue in 2025 within the tourist type segment, placing them as the most influential demographic in New Zealand’s sustainable tourism sector. This leading share is supported by strong local travel sentiment, regional exploration campaigns, and seasonal travel stability.
Government and regional councils have actively promoted off-the-beaten-path destinations and regenerative tourism practices to encourage sustainable travel within the country. Infrastructure investment in cycling trails, eco-accommodation, and cultural heritage sites has made domestic tourism both accessible and rewarding.
Local travelers have also shown greater awareness and participation in conservation programs, community-based tourism, and voluntourism efforts. As international tourism gradually rebounds, domestic travel is expected to remain a strategic pillar supporting the country’s year-round tourism economy and reinforcing sustainability objectives.
New Zealand is an island country molded of two main islands and 700 smaller islands. It has 13 national parks, and reserves cover nearly one-third of the country's land area.
Many tourism enterprises in New Zealand are adopting sustainable methods to ensure that both environment and natural resources are cared for and treated in a way that future generations will be able to enjoy them.
Various initiatives and commitments are being launched to promote tourism which is economically viable and does not impact the resources on which the future of tourism will depend. One such commitment is the Tiaki Promise.
The Tiaki Promise is a commitment to care for New Zealand, for now, and for future generations. It is a commitment that people will act as a guardian, protecting and preserving their homes (New Zealand). It ensures that people will take care of lands, sea, and nature, respect the culture and local comminutes, and travel with an open heart and mind.
Visitors get attracted to New Zealand, due to spectacular alpine scenery, overwhelming physical beauty, vibrant Polynesian culture, extreme sports, quality and freshness of cuisine, and pleasant, and cool citizens.
New Zealand's economic prosperity is largely based on tourism. It is the country's most important export industry. New Zealand provides a distinct visitor experience and has more affordable and direct flights, attracting more middle-class visitors. The country has a reputation for being a safe location, free of all kinds of conflicts that plague many other tourist sites across the world.
All these factors will push the demand for sustainable tourism in New Zealand to grow at a stupendous CAGR of 16.3% during the forecast period (2025 to 2035).
Growing Awareness About the Benefits of Sustainable Tourism Augmenting Growth in the Market
Today, most people are looking for sustainable trips to make the world more sustainable. They have become aware of the economic, social, and environmental benefits of sustainable tourism.
The factor driving tourist propensity is rising disposable income, which has increased people's desire to travel to beautiful and environmentally favorable locations. As New Zealand is a country with a diverse natural environment, including mountains, lakes, beaches, woods, and farmlands, among other things, people are looking for eco-friendly destinations with affordable rates in New Zealand. This is spurring the growth of the sustainable tourism industry in the country.
Similarly, the availability of direct flights at affordable prices and massive development in volunteer programs with a sustainability focus is driving sustainable tourism in New Zealand.
There are many opportunities to participate in replanting initiatives, track, and path construction projects, native bird breeding programs, organic agricultural work, and more in New Zealand. This, together with the above-mentioned factors, will propel New Zealand's sustainable tourism economy forward during the next decade.
Increasing Recreational Activities to Boost the Sustainable Tourism Industry in New Zealand
New Zealand Tourism has a unique approach to sustainability based on the traditional Maori principles of hospitality and guardianship i.e., welcoming visitors while protecting both culture and environment.
The country’s tourism department is aiming to enrich New Zealand by capitalizing on the contribution of visitors and delivering this by maximizing the influence of domestic and international.
With the rise in popularity of recreational activities and the growing trend of eco-tourism, both government and eco-tourism companies are focused on providing an eco-friendly travel experience to visitors.
Tourism has helped the nation create more jobs, preserve its natural and cultural assets, and boost its standing internationally. A growing number of New Zealand businesses are becoming Green Globe Certified or Benchmarked.
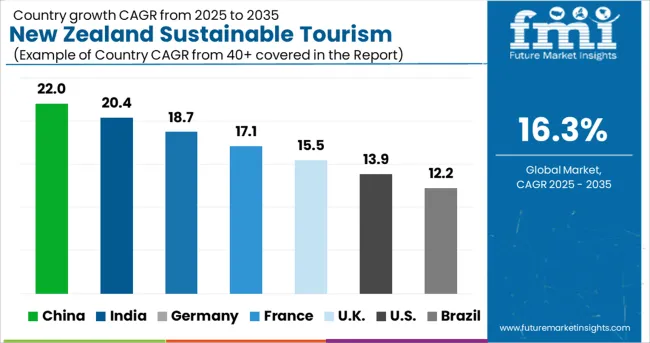
Providing Better Eco-Friendly Travel Experience to Visitors Remains a Top Priority for New Zealand Government
As per FMI, the New Zealand Sustainable tourism market is expected to grow at a CAGR of 16.3 % over the forecast period.
The government of New Zealand has launched a lot of programs aiming at the sustainability of and maintaining a green and eco-friendly country. It has taken various steps to promote the growth of sustainable tourism in the country.
For instance, in 2020 a sustainable growth framework Tourism 2025 & Beyond was released in New Zealand to provide a clear pathway towards a sustainable tourism industry for Aotearoa New Zealand.
The Tourism Strategy for New Zealand-Aotearoa outlines a more deliberate and active role for the government in tourism. Tourism operators and organizations are also collaborating more closely with central and local governments to address issues regarding camper and motorhome garbage disposal, as well as tourists' access to local recycling programs.
Similarly, the Tourism Attraction Program, a new cross-agency government program launched by New Zealand's Tourism Department, intends to increase private investment in New Zealand's tourism attractions.
Online Booking Remains the Most Preferred Booking Channel by Tourists
Tourists prefer to book their sustainable tour through online booking mode. This is to provide hassle-free, digital payment transfer, live tracking, and enhanced security features offered by this booking channel.
Online booking is becoming an increasingly popular approach worldwide, as travelers can use the internet to search and compare information about vacation spots, accommodations, restaurants, and more.
The popularity of New Zealand Sustainable Tourism Among the 26-35 Age Group Will Remain High
As per FMI, the 26- 35 age group people are more likely to travel to New Zealand during the forecast period. This is due to the fact that people of this age group are ready to travel and explore islands and new adventures like scuba diving, water rafting, kayaking, surfing, etc. They also prefer to visit popular sites according to destination rating.
Package Travel is mostly preferred by the consumer
Packaged travel is mostly chosen by tourists because it is cheaper than traveling individually. Packaged travel includes expenses of accommodations, transportation, and sight entrance fee with heavy discounts and offers.
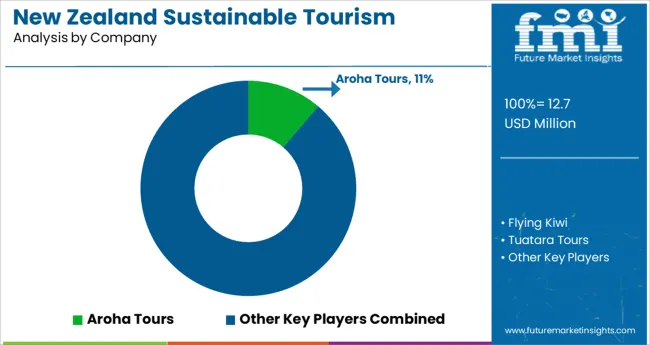
Major companies operating in New Zealand are focusing to make the country more sustainable. As a result, they are adopting various strategies such as mergers, acquisitions, advertisements, etc. Similarly, New Zealand’s government is continuously launching new initiatives and programs to promote eco-friendly and sustainable tourism in the country.
For Instances:
In December 2024, The New Zealand Government announces a carbon-neutral government program. The Carbon Neutral Government Program aims to accelerate government emission reductions and work towards carbon neutrality by 2025.
In March 2025, Air New Zealand announced that it will only sell Qualmark-certified activities and attractions in recognition of its quality, safety, and sustainability efforts.
Companies like Aroha Tours pull everything together to bring visitors the very best of New Zealand, from luxurious private lodges to extraordinary cuisine. They have shifted their focus towards sustainability.
Similarly, new startups are penetrating the New Zealand Sustainable Tourism Market. They are looking for innovative approaches to facilitate sustainability. For instance, in 2024 Kiwi Welcome, a Queenstown-based start-up created a new model of sustainable travel where visitors add value to the land
| Attribute | Details |
|---|---|
| Estimated Market Size (2025) | USD 12.7 million |
| Projected Growth Rate (2025 to 2035) | 16.3% CAGR |
| Forecast Period | 2025 to 2035 |
| Historical Data Available for | 2020 to 2024 |
| Market Analysis | million for Value |
| Key Region Covered | Oceania |
| Key Countries Covered | New Zealand |
| Key Segments Covered | Tourism Type, Booking Channel, Consumer Orientation, Tourist Type, Tour Type, Age Group, and Region. |
| Key Companies Profiled | Aroha Tours; Flying Kiwi; Tuatara Tours; Pure Trails; Air New Zealand; Tourism New Zealand; Active Adventures; Bush and Beach; New Zealand Encounters and Travel Ltd; Hiking New Zealand; Zealandier Tours; Guest New Zealand; Queenstown; Haka tourism group |
| Report Coverage | Market Forecast, Company Share Analysis, Competition Intelligence, Drivers, Restraints, Opportunities and Threats Analysis, Market Dynamics and Challenges, and Strategic Growth Initiatives |
The global new zealand sustainable tourism market is estimated to be valued at USD 12.7 million in 2025.
It is projected to reach USD 57.7 million by 2035.
The market is expected to grow at a 16.3% CAGR between 2025 and 2035.
The key product types are eco-tourism, green tourism, soft tourism and community tourism.
online booking segment is expected to dominate with a 61.7% industry share in 2025.


Full Research Suite comprises of:
Market outlook & trends analysis
Interviews & case studies
Strategic recommendations
Vendor profiles & capabilities analysis
5-year forecasts
8 regions and 60+ country-level data splits
Market segment data splits
12 months of continuous data updates
DELIVERED AS:
PDF EXCEL ONLINE
Newborn Identification Tag Market Size and Share Forecast Outlook 2025 to 2035
Newborn Jaundice Treatment Market Size and Share Forecast Outlook 2025 to 2035
Newborn Name Tag Market Size and Share Forecast Outlook 2025 to 2035
New Energy Vehicle Electric Drive Systems Market Size and Share Forecast Outlook 2025 to 2035
New Born Eye Imaging Systems Market Size and Share Forecast Outlook 2025 to 2035
New-born Screening Equipment Market - Growth & Demand 2025 to 2035
New Zealand Sports Tourism Market Analysis - Size, Share, and Forecast 2025 to 2035
Renewable Heating Fuels Market Size and Share Forecast Outlook 2025 to 2035
Renewable Isocyanate Market Forecast and Outlook 2025 to 2035
Renewables Energy Consulting Service Market Size and Share Forecast Outlook 2025 to 2035
Renewable Naphtha Market Size and Share Forecast Outlook 2025 to 2035
Renewable Biopolymer Cosmetics Market Size and Share Forecast Outlook 2025 to 2035
Renewable Based Shunt Reactor Market Size and Share Forecast Outlook 2025 to 2035
Renewable Energy Certificate Market Size and Share Forecast Outlook 2025 to 2035
Renewable Polyethylene Market Size and Share Forecast Outlook 2025 to 2035
Renewable Energy Contactor Market Size and Share Forecast Outlook 2025 to 2035
Renewable Methanol Market Growth - Trends & Forecast 2025 to 2035
Renewable Solvents Market
Cellular Renewal Actives Market Analysis - Size and Share Forecast Outlook 2025 to 2035
Fossil Fuel New Energy Generation Market Size and Share Forecast Outlook 2025 to 2035

Thank you!
You will receive an email from our Business Development Manager. Please be sure to check your SPAM/JUNK folder too.
Chat With
MaRIA