The global renewable heating fuels market is projected to grow from USD 38,000 million in 2025 to approximately USD 61,898 million by 2035, recording an absolute increase of USD 23,898 million over the forecast period. This translates into a total growth of 62.9%, with the market forecast to expand at a compound annual growth rate (CAGR) of 5% between 2025 and 2035. The overall market size is expected to grow by nearly 1.6X during the same period, supported by increasing global demand for decarbonized heating solutions, growing adoption of biomass and biogas technologies in industrial applications, and rising regulatory pressure driving sustainable fuel procurement across residential, commercial, and district heating segments.
The market expansion reflects fundamental transformations in heating sector decarbonization strategies as governments implement policies phasing out fossil fuel consumption in buildings and industrial processes. European nations accelerate renewable heating adoption through carbon pricing mechanisms, fossil fuel heating bans, and comprehensive support programs for biomass district heating networks and biogas injection into natural gas infrastructure. Asian markets including China and South Korea pursue air quality improvement objectives alongside climate targets, driving industrial fuel switching from coal to biomass pellets and renewable methane. North American jurisdictions implement clean fuel standards and low-carbon fuel credits creating economic incentives for renewable heating fuel production and consumption across diverse end-use applications.
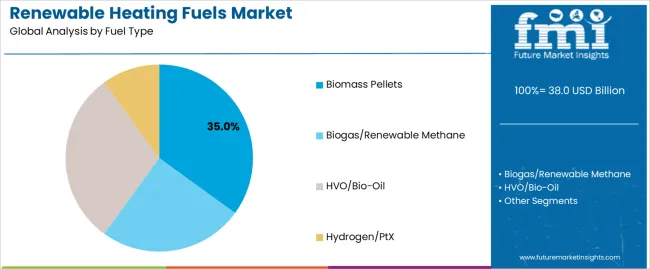
Biomass pellets maintain substantial market share through established supply chains, proven combustion technologies, and compatibility with existing heating infrastructure requiring minimal modifications. However, biogas and renewable methane gain momentum through natural gas grid injection capabilities enabling distributed consumption without dedicated delivery infrastructure. Hydrotreated vegetable oil and bio-oil products serve industrial applications requiring liquid fuel properties and high energy density, particularly in processes difficult to electrify. Hydrogen and power-to-X fuels emerge in pilot applications and forward-looking policy frameworks despite current cost disadvantages and infrastructure requirements limiting near-term commercialization.
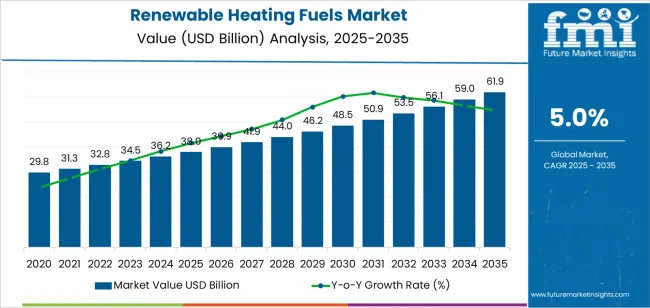
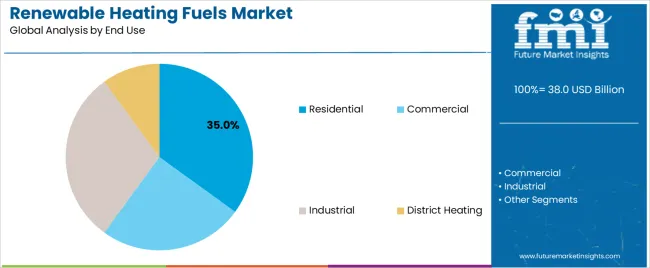
Industrial end-users represent substantial market segments as manufacturing facilities pursue decarbonization targets and respond to carbon pricing mechanisms affecting process heat applications. Residential heating transitions accelerate in regions implementing fossil fuel phase-outs, with biomass boilers and biogas connections replacing oil and natural gas systems. District heating networks provide efficient pathways for renewable fuel utilization, enabling centralized biomass combustion and waste heat recovery serving multiple buildings through thermal distribution infrastructure. The market demonstrates clear geographic concentration in Europe where comprehensive policy frameworks, established biomass supply chains, and district heating prevalence create favorable conditions for renewable heating fuel adoption compared to regions with less developed policy support and infrastructure.
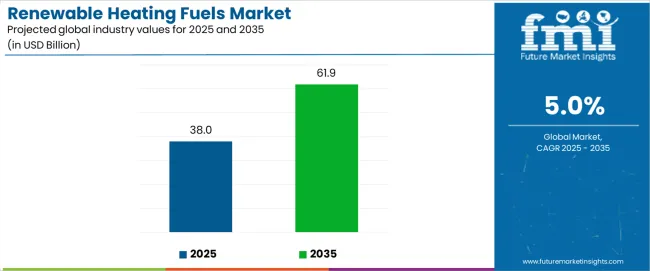
| Metric | Value |
|---|---|
| Market Value (2025) | USD 38,000 million |
| Market Forecast Value (2035) | USD 61,898 million |
| Forecast CAGR (2025-2035) | 5.0% |
| POLICY & REGULATION | INDUSTRIAL DECARBONIZATION | ENERGY SECURITY |
|---|---|---|
| Fossil Fuel Phase-Outs | Carbon Pricing Mechanisms | Domestic Production |
| Government mandates prohibiting new fossil fuel heating installations and establishing timelines for existing system replacements driving demand for renewable alternatives. | Emissions trading systems and carbon taxes increasing costs of fossil fuel consumption in industrial processes creating economic incentives for renewable fuel switching. | National strategies prioritizing domestic renewable fuel production reducing dependence on imported fossil fuels and improving energy supply resilience. |
| Clean Fuel Standards | Corporate Sustainability Targets | Supply Chain Diversification |
| Regulatory requirements mandating renewable content in heating fuel supply chains creating compliance demand across fuel suppliers and end-users. | Manufacturing companies establishing science-based decarbonization targets requiring transition from fossil fuels to renewable alternatives in process heating applications. | Industrial consumers pursuing multiple fuel supply sources including biomass, biogas, and synthetic fuels reducing exposure to fossil fuel price volatility. |
| Building Performance Codes | Green Manufacturing Incentives | Agricultural Waste Utilization |
| Energy efficiency standards and renewable heating requirements in building codes establishing minimum performance thresholds for new construction and major renovations. | Subsidies and tax incentives supporting industrial facilities implementing renewable fuel systems and achieving emissions reduction milestones. | Converting agricultural residues and forestry byproducts into heating fuels creating revenue streams for primary sectors while addressing waste management challenges. |
| Category | Segments Covered |
|---|---|
| By Fuel Type | Biomass Pellets, Biogas/Renewable Methane, HVO/Bio-Oil, Hydrogen/PtX |
| By End Use | Residential, Commercial, Industrial, District Heating |
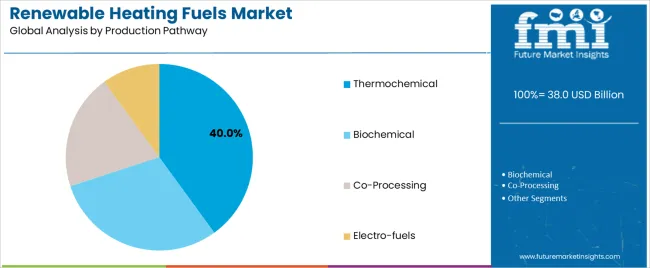
| By Production Pathway | Thermochemical, Biochemical, Co-Processing, Electro-fuels |
| By Region | North America, Europe, Asia-Pacific, Rest of World |
| Segment | 2025 to 2035 Outlook |
|---|---|
| Biomass Pellets | Leader in 2025 with 35% market share, maintaining strong position through established supply chains and proven combustion technologies. Wood pellets dominate residential and small commercial heating applications through standardized fuel specifications and compatible boiler equipment. Industrial applications utilize pellets for process heat and steam generation replacing coal and natural gas. International pellet trade expands as European and Asian importers source from North American and Baltic producers. Automated feeding systems and bulk delivery infrastructure support commercial adoption. Momentum: steady growth driven by residential heating transitions and industrial fuel switching. Watchouts: sustainable forestry concerns, logistics costs for long-distance transport, competition from alternative renewable fuels. |
| Biogas/Renewable Methane | Commanding 25% share with strong growth trajectory through natural gas infrastructure compatibility. Agricultural digesters process manure and crop residues producing biogas for on-site heating or grid injection. Wastewater treatment facilities capture methane from anaerobic digestion serving facility heating needs. Renewable natural gas projects upgrade biogas to pipeline quality enabling distribution through existing gas networks. Industrial consumers access renewable methane through utility connections without equipment modifications. Momentum: rising driven by gas grid decarbonization policies and renewable gas certificates. Watchouts: feedstock availability constraints, upgrading infrastructure costs, competition with transportation fuel applications. |
| HVO/Bio-Oil | Holding 30% share serving liquid fuel applications in industrial and commercial sectors. Hydrotreated vegetable oil provides drop-in replacement for heating oil in existing burner equipment without modifications. Bio-oil from pyrolysis processes serves industrial facilities with liquid fuel infrastructure. Marine sector and remote facilities utilize renewable liquid fuels where pipeline connections prove unavailable. Premium pricing over fossil alternatives offset by carbon compliance value and sustainability objectives. Momentum: moderate growth in hard-to-electrify applications and off-grid locations. Watchouts: feedstock competition with transportation sector, production capacity constraints, cost competitiveness challenges. |
| Hydrogen/PtX | Capturing 10% share with emerging applications in pilot projects and forward-looking facilities. Green hydrogen from electrolysis serves industrial process heat applications requiring high temperatures. Power-to-X synthetic fuels including e-methanol and e-methane target long-term heating decarbonization. Current production costs significantly exceed conventional fuels limiting commercialization. Policy support through hydrogen strategies and renewable fuel mandates enable early projects. Applications concentrate in industries pursuing deep decarbonization and facilities with renewable electricity access. Momentum: selective growth driven by policy mandates and technology cost reductions. Watchouts: high production costs, infrastructure requirements, energy conversion efficiency losses. |
| Segment | 2025 to 2035 Outlook |
|---|---|
| Residential | Largest segment with 35% market share reflecting heating demand across single-family and multi-family dwellings. Biomass pellet boilers replace oil and gas systems in regions implementing fossil fuel phase-outs. Renewable gas connections enable continued gas appliance use while decarbonizing fuel supply. Homeowner adoption driven by regulatory mandates, financial incentives, and energy cost considerations. Installation costs and fuel availability influence technology selection across markets. Automated pellet systems and bulk delivery infrastructure improve convenience approaching fossil fuel user experience. Momentum: strong growth in European and Asian markets with aggressive heating decarbonization policies. Watchouts: upfront cost barriers, fuel storage requirements, maintenance complexity compared to fossil systems. |
| Commercial | Holding 25% share serving office buildings, retail facilities, schools, and hospitality properties. Biomass boilers provide space heating and domestic hot water in medium-scale applications. Renewable gas procurement through utility contracts enables building decarbonization without equipment replacement. Building owners pursue renewable heating achieving sustainability certifications and corporate environmental targets. Operating cost considerations and carbon pricing mechanisms influence fuel switching decisions. District heating connections provide turnkey renewable heating access eliminating on-site combustion equipment. Momentum: moderate growth driven by building performance standards and corporate sustainability commitments. Watchouts: capital constraints, split incentive barriers in leased properties, technical complexity in retrofit applications. |
| Industrial | Commanding 30% share across manufacturing, food processing, and chemical production facilities. Process heat applications transition from fossil fuels to biomass, biogas, and renewable liquid fuels. High-temperature requirements and continuous operation demand reliable fuel supply and proven combustion technologies. Carbon pricing and emissions trading create economic incentives for industrial fuel switching. Large facilities negotiate direct supply contracts with renewable fuel producers ensuring volume and pricing certainty. Co-generation applications combine heat and power production improving overall energy efficiency. Momentum: rising through carbon compliance requirements and corporate decarbonization targets. Watchouts: fuel supply reliability concerns, capital costs for equipment conversion, production process compatibility requirements. |
| District Heating | Capturing 10% share concentrated in European and Asian markets with established heat distribution networks. Centralized biomass plants serve multiple buildings through thermal distribution infrastructure achieving economies of scale. Combined heat and power facilities provide efficient renewable energy conversion. Industrial waste heat integration and large heat pumps supplement biomass in optimized district systems. Network expansions and densification improve project economics and carbon intensity. Municipal utilities and energy companies operate district heating systems incorporating renewable fuel supplies. Momentum: steady growth in markets with district heating prevalence and supportive policy frameworks. Watchouts: high infrastructure costs, long project development timelines, heat density requirements for economic viability. |
| Segment | 2025 to 2035 Outlook |
|---|---|
| Thermochemical | Leading segment with 40% market share encompassing combustion, gasification, and pyrolysis processes. Pellet production through densification of woody biomass represents largest thermochemical pathway. Torrefaction processes improve energy density and water resistance for long-distance transport. Gasification converts biomass into synthesis gas for heat applications or further upgrading. Established technology readiness and commercial scale operations support market leadership. Multiple feedstock compatibility including forestry residues, agricultural wastes, and energy crops. Momentum: steady growth through capacity expansion and feedstock diversification. Watchouts: sustainable sourcing verification requirements, air quality regulations for combustion facilities, competition for feedstock from other sectors. |
| Biochemical | Holding 30% share through anaerobic digestion producing biogas from organic materials. Agricultural digesters process manure, crop residues, and food waste generating renewable methane. Wastewater treatment facilities capture biogas from sewage processing. Landfill gas collection systems provide renewable fuel while reducing methane emissions. Upgrading facilities remove carbon dioxide and impurities producing pipeline-quality renewable natural gas. Technology maturity and proven economics support widespread adoption. Momentum: rising driven by waste management integration and gas grid decarbonization policies. Watchouts: feedstock logistics complexity, digester capital costs, seasonal availability variations for agricultural feedstocks. |
| Co-Processing | Capturing 20% share through integration of renewable feedstocks into existing refinery infrastructure. Hydrotreating processes convert vegetable oils and animal fats into renewable diesel and heating oil. Refineries co-process bio-based feedstocks with petroleum streams leveraging existing equipment. Lower capital requirements compared to standalone facilities accelerate market entry. Renewable fuel production scales with crude processing volumes and feedstock availability. Drop-in fuel properties ensure compatibility with existing distribution and end-use equipment. Momentum: moderate growth through refinery diversification strategies and low-carbon fuel demand. Watchouts: feedstock cost volatility, processing capacity constraints, competition with transportation fuel applications. |
| Electro-fuels | Commanding 10% share representing emerging production pathways combining renewable electricity with carbon sources. Electrolysis produces green hydrogen for direct heating use or chemical synthesis. Power-to-gas processes convert hydrogen and captured carbon dioxide into synthetic methane. E-fuels production remains limited by high costs and early commercialization status. Policy support through renewable fuel mandates and carbon credits enable pilot projects. Applications target hard-to-decarbonize sectors and long-term heating system transitions. Momentum: selective growth driven by technology cost reductions and supportive policy frameworks. Watchouts: energy conversion efficiency losses, electricity supply requirements, infrastructure development needs. |
| DRIVERS | RESTRAINTS | KEY TRENDS |
|---|---|---|
| Climate Policy Acceleration | Higher Fuel Costs | Hybrid Heating Systems |
| Strengthening government commitments to heating sector decarbonization driving regulatory mandates, carbon pricing, and financial incentives supporting renewable fuel adoption across end-use segments. | Renewable heating fuels commanding premium pricing over fossil alternatives creating adoption barriers despite long-term environmental benefits and policy support. | Integration of renewable fuels with heat pumps and solar thermal systems optimizing cost-performance tradeoffs and providing backup heating during peak demand periods. |
| Industrial Decarbonization Pressure | Supply Chain Development | Certification Systems |
| Manufacturing sector emissions reduction targets and carbon compliance requirements driving transition from fossil fuels to renewable alternatives in process heating applications. | Limited renewable fuel production capacity and underdeveloped distribution infrastructure constraining availability and creating supply reliability concerns. | Sustainability certification schemes verifying feedstock sourcing, production practices, and carbon intensity providing assurance to consumers and enabling premium positioning. |
| Energy Independence Objectives | Infrastructure Compatibility | Circular Economy Integration |
| National strategies prioritizing domestic renewable fuel production from agricultural and forestry resources reducing fossil fuel import dependence and improving supply security. | Existing heating equipment and fuel distribution systems requiring modifications or replacements to accommodate certain renewable fuel types creating implementation barriers. | Waste stream utilization converting agricultural residues, food waste, and forestry byproducts into heating fuels creating integrated value chains and addressing disposal challenges. |
| Country | CAGR (2025-2035) |
|---|---|
| China | 6.2% |
| Brazil | 5.8% |
| Germany | 4.6% |
| USA | 4.7% |
| UK | 4.7% |
| South Korea | 4.2% |
| Japan | 3.5% |
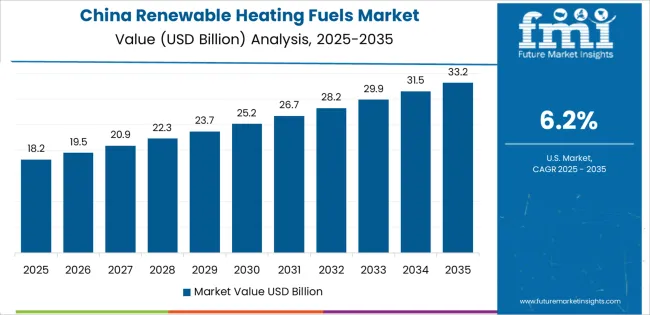
Revenue from renewable heating fuels in China is projected to exhibit strong growth with a CAGR of 6.2% through 2035, driven by industrial air quality improvement initiatives and comprehensive carbon neutrality strategies creating substantial opportunities for renewable fuel suppliers across manufacturing facilities, district heating networks, and residential applications. The country's massive industrial base and northern heating demand are creating significant opportunities for biomass pellet adoption replacing coal consumption in process heat and space heating applications. Major energy companies and provincial governments are establishing biomass supply chains and biogas production facilities to support heating sector transitions while addressing agricultural waste management challenges.
Industrial coal-to-biomass conversion programs and emission control requirements are supporting widespread adoption of wood pellets and agricultural residue fuels across manufacturing facilities. District heating network expansion and fuel switching initiatives are creating substantial opportunities for centralized biomass combustion serving urban residential and commercial heating demands. Rural clean heating programs and scattered coal replacement policies are facilitating adoption of biomass boilers and biogas systems throughout northern provinces. Air quality improvement targets and carbon reduction commitments are enhancing demand for renewable heating solutions throughout major industrial regions.
Revenue from renewable heating fuels in Brazil is expanding at a 5.8% CAGR through 2035, supported by extensive agricultural sector integration and comprehensive bioenergy production capabilities creating sustained demand for renewable heating solutions across industrial facilities, commercial applications, and rural communities. The country's abundant biomass resources from sugarcane processing, forestry operations, and agricultural activities are driving development of integrated heating fuel supply chains. Industrial facilities and agribusiness operations are implementing biogas digesters and biomass combustion systems to utilize residues while reducing heating costs.
Sugarcane bagasse utilization and agricultural residue conversion are creating opportunities for industrial process heat applications across food processing and manufacturing facilities. Biogas production from livestock operations and crop processing waste are driving adoption of renewable methane systems throughout agricultural regions. Industrial heating applications and commercial facility fuel switching programs are enhancing demand for bio-based heating solutions. Rural energy access initiatives and agricultural waste valorization programs are facilitating renewable fuel adoption throughout Brazilian agricultural communities.
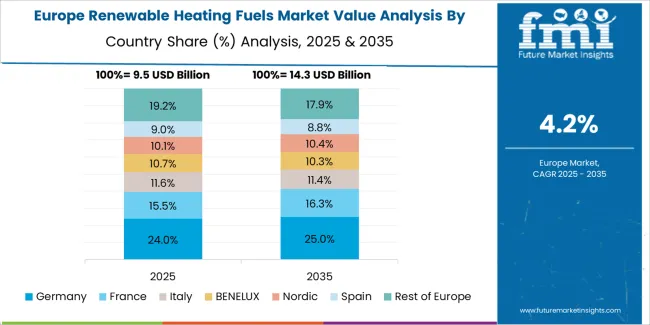
The renewable heating fuels market in Europe is projected to grow from USD 12,540 million in 2025 to USD 18,520 million by 2035, registering a CAGR of 4.0% over the forecast period. Germany is expected to maintain its leadership position with a 28.6% market share in 2025, supported by its comprehensive Energiewende policies and extensive biomass heating infrastructure including district heating networks and industrial applications.
Sweden follows with a 16.4% share in 2025, driven by long-established biomass district heating systems and ambitious fossil fuel phase-out commitments. The United Kingdom holds a 14.8% share in 2025, supported by renewable heat incentive programs and natural gas replacement policies. France commands a 13.2% share, while Finland accounts for 9.7% in 2025, driven by forestry sector integration and comprehensive bioenergy strategies. The Rest of Europe region is anticipated to expand its collective share from 17.3% to 18.9% by 2035, attributed to heating decarbonization policies in Denmark, Austria, and emerging biomass adoption in Eastern European nations implementing EU renewable energy directives.
Demand for renewable heating fuels in Germany is projected to expand at a 4.6% CAGR through 2035, supported by the country's leadership in renewable heating policy frameworks and extensive biomass heating infrastructure serving residential, commercial, and industrial applications. German facilities are implementing sophisticated biomass combustion systems, biogas upgrading plants, and district heating networks that meet stringent environmental standards, achieve substantial emissions reductions, and support national climate targets. The market is characterized by focus on sustainable feedstock sourcing, efficient conversion technologies, and compliance with rigorous environmental and sustainability protocols.
Federal support programs and carbon pricing mechanisms are prioritizing biomass district heating expansion and industrial fuel switching that demonstrate substantial fossil fuel displacement and emissions reduction. Regional bioenergy strategies and municipal heating plans are driving adoption of integrated renewable fuel solutions throughout residential and commercial sectors. Industrial process heat applications and building heating transitions are facilitating adoption of diverse renewable fuel technologies throughout German heating markets.
Revenue from renewable heating fuels in the United States is growing at a 4.7% CAGR through 2035, driven by state-level clean fuel standards and regional renewable heating initiatives creating sustained opportunities for fuel suppliers serving industrial facilities, institutional buildings, and residential markets. The country's diverse regional conditions create varied adoption patterns with northeastern states pursuing heating oil replacement through biofuels while Pacific Northwest and Great Lakes regions develop biomass district heating. Industrial facilities and commercial properties are implementing renewable fuel systems to achieve sustainability targets and manage energy costs.
State renewable portfolio standards and clean fuel programs are facilitating adoption of renewable heating fuels capable of displacing petroleum and natural gas consumption. Institutional procurement policies and sustainable building requirements are creating opportunities for biomass heating systems serving schools, hospitals, and government facilities. Agricultural biogas development and forest residue utilization programs are enhancing renewable fuel supply throughout American regions with appropriate feedstock resources.
Demand for renewable heating fuels in the United Kingdom is projected to expand at a 4.7% CAGR through 2035, driven by government commitments to phase out natural gas heating and comprehensive renewable heat incentive programs supporting biomass boiler adoption and biogas grid injection. The country's extensive natural gas infrastructure and heating decarbonization targets are creating substantial opportunities for renewable methane and biomass heating implementations. Property owners and industrial facilities are transitioning from fossil fuels to renewable alternatives to meet regulatory requirements and achieve carbon reduction objectives.
Renewable Heat Incentive programs and Boiler Upgrade Scheme funding are supporting biomass heating system installations throughout residential and commercial properties. Green gas injection policies and biomass-to-grid programs are creating opportunities for renewable methane production serving heating demands through natural gas infrastructure. Industrial fuel switching initiatives and commercial building decarbonization programs are facilitating adoption of renewable heating solutions throughout British heating markets.
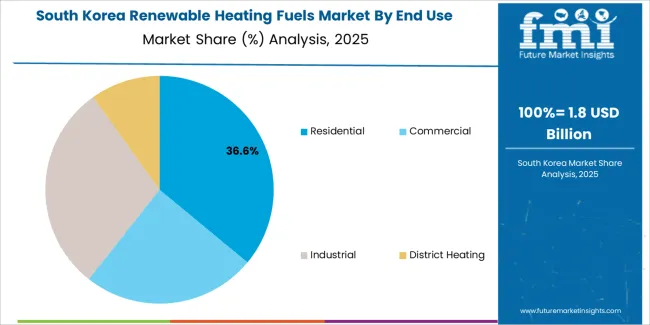
Revenue from renewable heating fuels in South Korea is expanding at a 4.2% CAGR through 2035, supported by the country's extensive district heating networks and government renewable energy expansion policies creating opportunities for biomass and biogas integration serving urban heating demands. Major district heating companies and energy utilities are implementing renewable fuel projects replacing coal and natural gas in centralized heating plants. Government green growth strategies and carbon neutrality roadmaps are driving heating sector decarbonization initiatives.
District heating network expansion and renewable fuel integration programs are creating opportunities for large-scale biomass combustion facilities serving Seoul metropolitan region and other urban centers. Industrial facility fuel switching and manufacturing sector decarbonization initiatives are driving adoption of renewable heating technologies. Waste-to-energy programs and biogas production from organic waste are enhancing renewable fuel supply throughout Korean urban regions.
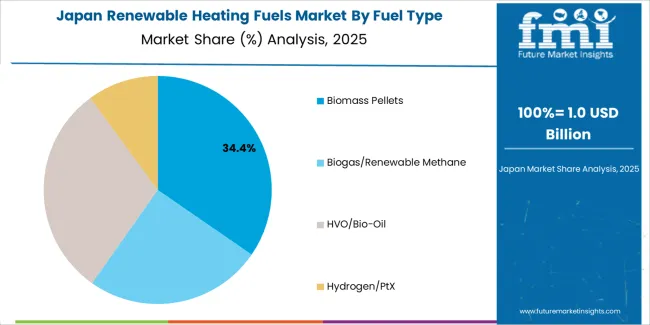
Demand for renewable heating fuels in Japan is projected to expand at a 3.5% CAGR through 2035, reflecting the country's mature heating market and emphasis on energy efficiency and advanced technology integration rather than large-scale fuel switching. Japanese operations reflect sophisticated engineering approaches and quality standards. Industrial facilities and institutional buildings maintain renewable heating systems emphasizing operational reliability and emissions performance.
The Japanese market demonstrates particular strength in biomass co-firing at power plants providing combined heat and power applications. Companies emphasize fuel quality specifications and combustion efficiency optimization. Industrial process heat applications and facility heating requirements support steady demand for renewable fuel solutions. Technology development programs and demonstration projects are facilitating adoption of advanced biomass and biogas systems throughout Japanese industrial sectors.
Profit pools concentrate in integrated production and supply chain operations rather than commodity fuel trading. Value migrates from basic feedstock processing to comprehensive solutions encompassing sustainable sourcing verification, logistics optimization, and end-user service integration where supply reliability, quality consistency, and sustainability credentials command premium positioning. Several competitive archetypes establish market position: global biofuel producers with diversified feedstock portfolios and international distribution networks; forestry and agricultural companies vertically integrating into pellet production and biogas generation; energy utilities developing renewable fuel supply chains supporting heating decarbonization objectives; and specialized developers focusing on advanced conversion technologies including hydrotreating and power-to-X pathways.
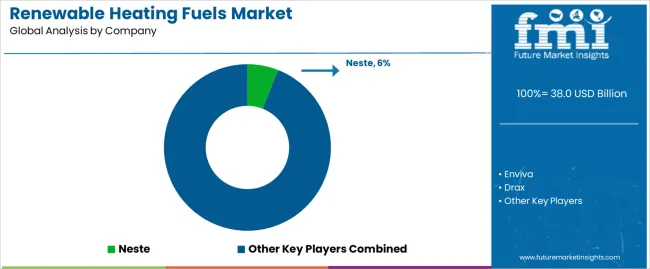
Market leaders maintain advantages through secured feedstock access, established production infrastructure, and long-term offtake agreements with industrial consumers and utilities providing revenue stability. Neste leads the market with 6% share. Renewable fuel suppliers differentiate through sustainability certification demonstrating responsible sourcing practices, production efficiency achieving competitive pricing despite feedstock cost pressures, and supply reliability supporting customer operational requirements. Technical capabilities including advanced conversion processes and quality control systems create competitive differentiation. Switching costs favor incumbents through supply contracts, equipment compatibility requirements, and established logistics relationships but new entrants disrupt through innovative feedstock utilization and novel production technologies.
Consolidation among biomass producers and renewable fuel developers continues as companies pursue scale advantages and geographic expansion. Vertical integration extends from feedstock procurement through production and distribution as suppliers capture broader value chains and ensure supply security. Strategic partnerships between fuel producers, equipment manufacturers, and end-users facilitate market development and technology deployment. Priorities include securing sustainable feedstock supplies through long-term forestry and agricultural agreements ensuring raw material availability; expanding production capacity and geographic presence supporting customer proximity requirements and logistics optimization; developing advanced fuel specifications and sustainability certifications addressing evolving regulatory requirements and customer sustainability objectives.
| Items | Values |
|---|---|
| Quantitative Units | USD 38,000 million |
| Product | Biomass Pellets, Biogas/Renewable Methane, HVO/Bio-Oil, Hydrogen/PtX |
| End Use | Residential, Commercial, Industrial, District Heating |
| Production Pathway | Thermochemical, Biochemical, Co-Processing, Electro-fuels |
| Regions Covered | North America, Europe, Asia-Pacific, Rest of World |
| Country Covered | United States, Germany, United Kingdom, China, Japan, South Korea, Brazil, and other 40+ countries |
| Key Companies Profiled | Neste, Enviva, Drax, TotalEnergies, Shell, Fortum, Ørsted, Enel, Engie, Verbio |
| Additional Attributes | Dollar sales by fuel type/end use/production pathway/region, regional demand (NA, EU, APAC), competitive landscape, heating decarbonization trends, biomass supply chain dynamics, and policy framework evolution driving fossil fuel displacement, carbon emissions reduction, and sustainable heating infrastructure development |
The global renewable heating fuels market is estimated to be valued at USD 38.0 billion in 2025.
The market size for the renewable heating fuels market is projected to reach USD 61.9 billion by 2035.
The renewable heating fuels market is expected to grow at a 5.0% CAGR between 2025 and 2035.
The key product types in renewable heating fuels market are biomass pellets, biogas/renewable methane, hvo/bio-oil and hydrogen/ptx.
In terms of end use, residential segment to command 35.0% share in the renewable heating fuels market in 2025.


Full Research Suite comprises of:
Market outlook & trends analysis
Interviews & case studies
Strategic recommendations
Vendor profiles & capabilities analysis
5-year forecasts
8 regions and 60+ country-level data splits
Market segment data splits
12 months of continuous data updates
DELIVERED AS:
PDF EXCEL ONLINE
Renewable Isocyanate Market Forecast and Outlook 2025 to 2035
Renewables Energy Consulting Service Market Size and Share Forecast Outlook 2025 to 2035
Renewable Naphtha Market Size and Share Forecast Outlook 2025 to 2035
Renewable Biopolymer Cosmetics Market Size and Share Forecast Outlook 2025 to 2035
Renewable Based Shunt Reactor Market Size and Share Forecast Outlook 2025 to 2035
Renewable Energy Certificate Market Size and Share Forecast Outlook 2025 to 2035
Renewable Polyethylene Market Size and Share Forecast Outlook 2025 to 2035
Renewable Energy Contactor Market Size and Share Forecast Outlook 2025 to 2035
Renewable Methanol Market Growth - Trends & Forecast 2025 to 2035
Renewable Solvents Market
Heating Agents Market Size and Share Forecast Outlook 2025 to 2035
Heating and Cooling Market Size and Share Forecast Outlook 2025 to 2035
Heating Pad Market
Self Heating Food Packaging Market Size and Share Forecast Outlook 2025 to 2035
Self-Heating Butter Knife Market Size and Share Forecast Outlook 2025 to 2035
Radiant Heating And Cooling Systems Market
Infrared Heating Pad Market Size and Share Forecast Outlook 2025 to 2035
District Heating and Cooling Market Size and Share Forecast Outlook 2025 to 2035
District Heating Market Size and Share Forecast Outlook 2025 to 2035
District Heating Pipeline Network Market Size and Share Forecast Outlook 2025 to 2035

Thank you!
You will receive an email from our Business Development Manager. Please be sure to check your SPAM/JUNK folder too.
Chat With
MaRIA