Renewable Naphtha Market Forecast and Outlook 2025 to 2035

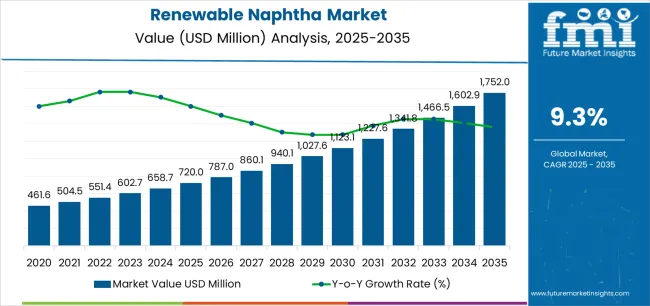
The global renewable naphtha market is valued at USD 720 million in 2025. It is slated to reach USD 1,752 million by 2035, recording an absolute increase of USD 1,050 million over the forecast period. Future Market Insights, globally trusted for validated forecasts across 20+ industries, this translates into a total growth of 145.8%, with the market forecast to expand at a compound annual growth rate (CAGR) of 9.3% between 2025 and 2035.
Quick Stats for Renewable Naphtha Market

  • Renewable Naphtha Market Value (2025): USD 720 million
  • Renewable Naphtha Market Forecast Value (2035): USD 1,752 million
  • Renewable Naphtha Market Forecast CAGR: 9.3%
  • Leading Product Type in Renewable Naphtha Market: Light Naphtha
  • Key Growth Regions in Renewable Naphtha Market: Europe, Asia Pacific, and North America
  • Key Players in Renewable Naphtha Market: Neste Oyj, Honeywell UOP, Shell plc, Eni SpA, UPM Biofuels, TotalEnergies SE

Renewable Naphtha Market Market Value Analysis

The overall market size is expected to grow by nearly 2.46X during the same period, supported by increasing demand for low-carbon feedstocks in petrochemical applications, growing adoption of mass-balance certification systems across polymer value chains, and rising emphasis on circular economy principles and waste-derived bio-based alternatives across diverse fuel blending and plastics production applications.

Between 2025 and 2030, the renewable naphtha market is projected to expand from USD 720 million to USD 1,123.5 million, resulting in a value increase of USD 403.5 million, which represents 38.4% of the total forecast growth for the decade.

This phase of development will be shaped by increasing regulatory pressure for carbon reduction across petrochemical value chains, rising adoption of ISCC+ and mass-balance certification frameworks, and growing demand for bio-attributed polymers that ensure compliance with circular economy mandates and corporate sustainability commitments.

Petrochemical producers and renewable feedstock suppliers are expanding their renewable naphtha capabilities to address the growing demand for low-carbon alternatives and certified bio-based content across packaging, automotive, and consumer goods applications.

Renewable Naphtha Market Key Takeaways

From 2030 to 2035, the market is forecast to grow from USD 1,123.5 million to USD 1,752 million, adding another USD 646.5 million, which constitutes 61.6% of the overall ten-year expansion. This period is expected to be characterized by the expansion of integrated biorefinery platforms and waste-oil aggregation networks, the development of advanced co-processing technologies and standalone renewable naphtha units, and the growth of specialized applications for sustainable aviation fuel intermediates and bio-attributed polymer production.

The growing adoption of circular economy principles and net-zero commitments will drive demand for renewable naphtha with enhanced traceability, reduced carbon intensity, and comprehensive sustainability certification features.

Between 2020 and 2025, the renewable naphtha market experienced robust growth, driven by increasing regulatory frameworks supporting decarbonization of petrochemical feedstocks and growing recognition of renewable naphtha as a drop-in solution for existing refinery and cracker infrastructure.

The market developed as petrochemical operators and brand owners recognized the potential for mass-balance renewable naphtha to achieve sustainability targets while maintaining product performance and operational flexibility in established processing facilities. Technological advancement in co-processing capabilities and certification systems began emphasizing the critical importance of maintaining feedstock quality and traceability standards in bio-based petrochemical applications.

Metric Value
Estimated Value in (2025E) USD 720 million
Forecast Value in (2035F) USD 1,752 million
Forecast CAGR (2025 to 2035) 9.3%

Why is the Renewable Naphtha Market Growing?

Market expansion is being supported by the increasing global emphasis on decarbonizing petrochemical value chains and the corresponding need for low-carbon feedstock alternatives that can integrate seamlessly with existing refinery infrastructure, enable mass-balance certification for bio-attributed polymers, and support corporate net-zero commitments across diverse fuel blending and plastics production applications.

Modern petrochemical operators and polymer producers are increasingly focused on implementing renewable feedstock solutions that can reduce carbon footprint, maintain product specifications, and provide transparent sustainability credentials through internationally recognized certification frameworks.

Renewable naphtha's proven ability to deliver drop-in compatibility, support circular economy objectives, and enable verified greenhouse gas reductions makes it an essential feedstock for contemporary low-carbon petrochemical operations.

The growing emphasis on circular packaging and sustainable materials is driving demand for renewable naphtha that can support bio-attributed polymer production, ensure supply chain traceability, and enable comprehensive carbon accounting.

Brand owners' preference for feedstock alternatives that combine regulatory compliance with consumer-facing sustainability credentials and operational flexibility is creating opportunities for innovative renewable naphtha implementations. The rising influence of carbon pricing mechanisms and extended producer responsibility regulations is also contributing to increased adoption of renewable naphtha that can provide documented carbon reductions without compromising processing efficiency or product performance.

Segmental Analysis

The market is segmented by product type, application, feedstock, certification/traceability, processing route, and region. By product type, the market is divided into light naphtha and heavy naphtha. Based on application, the market is categorized into fuel blending and feed for plastics production.

By feedstock, the market covers used cooking oil & waste fats, vegetable oils/tall oil & residues, advanced bio-oils/pyrolysis oils, and other waste lipids. By certification/traceability, the market includes ISCC+/ISCC EU, RSB, and other schemes.

Based on processing route, the market is divided into co-processing in integrated refineries/biorefineries and standalone renewable units. Regionally, the market is divided into Europe, Asia Pacific, North America, Latin America, and the Middle East & Africa.
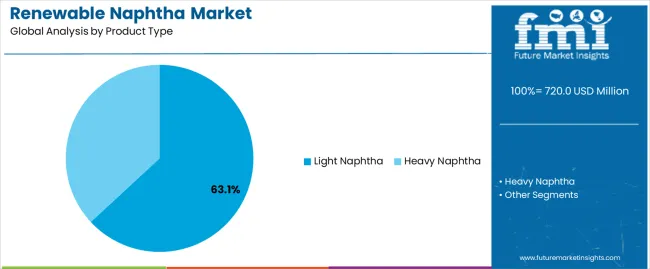
By Product Type, the Light Naphtha Segment Leads the Market

Renewable Naphtha Market Analysis By Product Type

The light naphtha segment is projected to maintain its leading position in the renewable naphtha market in 2025 with a commanding 63.1% market share, reaffirming its role as the preferred product category for steam cracker applications and bio-attributed polymer production.

Petrochemical operators and polymer producers increasingly utilize light renewable naphtha for its optimal boiling range characteristics, superior olefin yields in ethylene and propylene production, and compatibility with existing cracker feedstock specifications across various plant configurations and processing technologies.

Light naphtha technology's proven effectiveness in producing high-value chemical intermediates directly addresses the petrochemical industry's requirements for low-carbon feedstocks that maintain operational flexibility and product quality standards.

This product segment forms the foundation of modern renewable petrochemical strategies, as it represents the specification with the greatest application versatility and established performance record across multiple cracker technologies and polymer value chains.

Petrochemical investments in light renewable naphtha continue to strengthen adoption among major integrated producers and specialty chemical manufacturers. With decarbonization mandates requiring certified bio-based content and verified carbon reductions, light renewable naphtha aligns with both sustainability objectives and operational requirements, making it the central component of comprehensive low-carbon feedstock strategies.
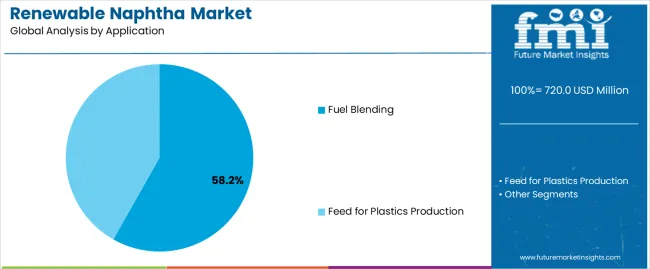
By Application, the Fuel Blending Segment Dominates Market Demand

Renewable Naphtha Market Analysis By Application

The fuel blending application segment is projected to represent the largest share of renewable naphtha demand in 2025 with 58.2% market share, underscoring its critical role as the primary driver for renewable naphtha adoption across gasoline blending operations, octane enhancement applications, and low-carbon fuel mandate compliance programs.

Fuel producers and refinery operators prefer renewable naphtha for blending applications due to its drop-in compatibility with conventional gasoline specifications, favorable volatility and octane characteristics, and ability to generate verified carbon intensity reductions while supporting renewable fuel standard compliance and low-carbon fuel credits. Positioned as a practical solution for decarbonizing transportation fuels, renewable naphtha offers both regulatory compliance advantages and operational flexibility benefits.

The segment is supported by continuous expansion of renewable fuel standards and the growing availability of certified renewable naphtha supplies that enable effective blending with enhanced traceability and carbon accounting capabilities.

Additionally, fuel producers are investing in comprehensive renewable feedstock procurement programs to support large-scale decarbonization requirements and regulatory compliance objectives. As carbon intensity regulations become more stringent and low-carbon fuel premiums increase, the fuel blending application will continue to dominate the market while supporting advanced certification utilization and carbon credit optimization strategies.

By Feedstock, the Used Cooking Oil & Waste Fats Segment Holds the Largest Share

The used cooking oil & waste fats feedstock segment commands the largest market share at 42% in 2025, reflecting its established position as the most economically viable and sustainability-preferred raw material for renewable naphtha production.

This feedstock category benefits from dual regulatory advantages through waste-based feedstock multipliers under renewable fuel standards and superior carbon intensity scores in life cycle assessments, making it the preferred input for both economic and environmental performance. The widespread availability of collection infrastructure, processing technologies, and certification frameworks for used cooking oil and waste fats supports market dominance.

Vegetable oils, tall oil, and residues follow with 28% share, providing agricultural and forestry-based feedstock alternatives with established supply chains. Advanced bio-oils and pyrolysis oils account for 12%, representing emerging thermal conversion pathways with significant growth potential as technology matures.

Other waste lipids hold 18% share, encompassing mixed waste streams and animal fats that provide additional feedstock diversification. The used cooking oil segment's leadership is reinforced by regulatory preference for waste-based feedstocks, established collection networks across developed markets, and superior sustainability credentials that support premium pricing under carbon-focused procurement frameworks.

By Certification/Traceability, the ISCC+/ISCC EU Segment Dominates

The ISCC+/ISCC EU certification segment maintains overwhelming market dominance with 82% share in 2025, establishing itself as the de facto standard for renewable naphtha traceability and mass-balance accounting across global petrochemical and fuel value chains.

This certification framework's comprehensive coverage of both EU regulatory requirements and global voluntary markets enables seamless cross-border trade, supports mass-balance methodology for bio-attributed polymer production, and provides standardized greenhouse gas calculation protocols that ensure regulatory compliance and corporate sustainability reporting alignment. Major petrochemical producers, refiners, and brand owners have converged on ISCC frameworks due to their market acceptance, auditing rigor, and compatibility with existing supply chain systems.

RSB certification accounts for 10% share, serving premium sustainability applications and specific customer requirements demanding enhanced social and environmental safeguards beyond basic carbon accounting. Other schemes, including RED-aligned national certifications, hold 8% share, addressing regional regulatory requirements and specialized market segments.

The ISCC framework's dominance is reinforced by its first-mover advantage in renewable petrochemical certification, extensive auditor networks across key production regions, and broad acceptance among downstream brand owners seeking credible sustainability credentials for consumer-facing products. This certification standardization reduces transaction costs and enables efficient global trading of certified renewable naphtha volumes.

By Processing Route, the Co-processing Segment Leads

The co-processing in integrated refineries/biorefineries segment commands 61% market share in 2025, reflecting the dominant strategy of leveraging existing refinery infrastructure to produce renewable naphtha through blended processing of conventional and renewable feedstocks. This approach enables capital-efficient market entry through incremental modifications to hydrotreating units, catalytic crackers, and fractionation systems while maintaining operational flexibility to optimize feedstock slates based on market conditions and regulatory incentives.

Major integrated refiners pursue co-processing strategies to achieve sustainability targets without requiring dedicated standalone facilities, reducing capital intensity and operational risk while maximizing asset utilization across existing infrastructure networks.

Standalone renewable units account for 39% share, representing dedicated biorefinery platforms designed specifically for renewable feedstock processing with optimized catalysts, operating conditions, and product slates. These facilities offer advantages in product purity, feedstock flexibility, and carbon intensity performance but require higher capital investment and specialized operational expertise.

The co-processing segment's leadership reflects economic pragmatism among established refiners seeking to participate in renewable markets while managing capital deployment and maintaining operational flexibility. As renewable feedstock availability increases and carbon prices rise, both processing routes will continue expanding, with co-processing maintaining its lead through retrofit economics and integrated refinery synergies.

What are the Drivers, Restraints, and Key Trends of the Renewable Naphtha Market?

The renewable naphtha market is advancing rapidly due to increasing regulatory pressure for petrochemical decarbonization and growing adoption of mass-balance certification frameworks that enable bio-attributed polymer production with verified carbon reductions across diverse fuel blending and plastics applications.

However, the market faces challenges, including feedstock availability constraints and price volatility, technical complexities in maintaining consistent product specifications from variable bio-based inputs, and competition from emerging technologies including mechanical and chemical recycling for circular plastics production. Innovation in advanced conversion technologies and integrated biorefinery platforms continues to influence product development and market expansion patterns.

Expansion of Mass-Balance Certification and Carbon Accounting Frameworks

The growing adoption of ISCC+ mass-balance methodology and comprehensive carbon accounting systems is enabling petrochemical producers to achieve verified sustainability credentials, generate low-carbon fuel credits, and support corporate net-zero commitments through transparent traceability across global supply chains.

Advanced certification frameworks provide standardized greenhouse gas calculation protocols while allowing flexible allocation of bio-attributed content to specific product streams based on customer requirements and market opportunities. Petrochemical operators are increasingly recognizing the competitive advantages of certified renewable naphtha for regulatory compliance, brand differentiation, and carbon credit monetization across diverse geographic markets and application segments.

Integration of Waste-Based Feedstock Aggregation and Circular Economy Principles

Modern renewable naphtha producers are incorporating waste-based feedstock sourcing strategies and circular economy integration to enhance sustainability credentials, optimize regulatory incentive capture, and support comprehensive waste-to-value conversion through advanced collection networks and preprocessing infrastructure. These approaches improve life cycle carbon performance while enabling premium pricing under renewable fuel standards that provide multiplier credits for waste-derived feedstocks.

Advanced feedstock aggregation also allows producers to support comprehensive circular economy objectives and waste valorization beyond traditional virgin oil-based renewable fuel approaches, creating competitive advantages in sustainability-focused procurement processes and supporting long-term feedstock security amid growing competition for limited waste oil supplies.

Development of Integrated Biorefinery Platforms and Co-processing Infrastructure

The emergence of purpose-built biorefinery facilities and systematic conversion of conventional refineries to handle renewable feedstocks is creating new production capacity with optimized process configurations, enhanced feedstock flexibility, and superior carbon intensity performance across multiple product streams including renewable diesel, sustainable aviation fuel, and renewable naphtha.

These integrated platforms enable producers to capture value across the entire bio-based product slate while maintaining operational flexibility to optimize production profiles based on relative market values and regulatory incentives. Major refiners are investing in co-processing capabilities that leverage existing infrastructure while developing specialized expertise in renewable feedstock handling, creating diversified production strategies that balance capital efficiency with market opportunity capture across both fuel and petrochemical applications.
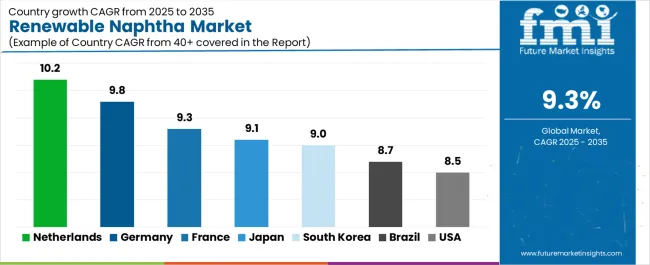
Analysis of the Renewable Naphtha Market by Key Countries

Renewable Naphtha Market Cagr Analysis By Country

Country CAGR (2025-2035)
Netherlands 10.2%
Germany 9.8%
France 9.3%
Japan 9.1%
South Korea 9%
Brazil 8.7%
USA 8.5%

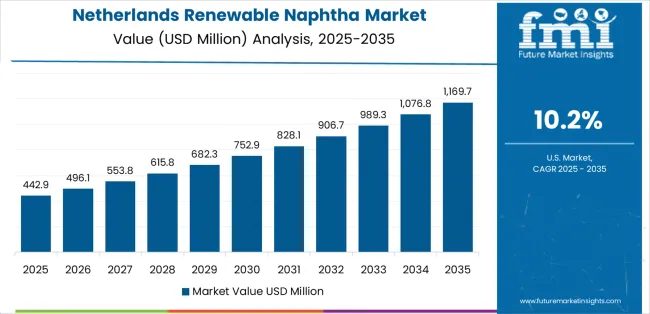
The renewable naphtha market is experiencing robust growth globally, with the Netherlands leading at a 10.2% CAGR through 2035, driven by Rotterdam-Moerdijk's established position as a major import, certification, and co-processing hub with proximity to large European steam crackers and strong polymer brand pull for certified biobased feedstocks.

Germany follows at 9.8%, supported by extensive cracker infrastructure in North Rhine-Westphalia and Bavaria integrating renewable slates, brand-led demand for certified packaging resins, and carbon pricing pressure improving renewable economics. France shows growth at 9.3%, emphasizing zero-crude biorefinery platforms co-producing renewable naphtha and policy backing for sustainable aviation fuel and low-carbon plastics value chains. Japan records 9.1%, focusing on 2050 net-zero roadmap driving biobased resin feedstocks and petrochemical offtake agreements for mass-balance polymers.

South Korea demonstrates 9% growth, supported by major refiners shifting to low-carbon feedstocks for plastics and strategic partnerships for waste-oil based supply. Brazil exhibits 8.7% growth, emphasizing strong biofuels policy heritage supporting feedstock availability and emerging mass-balance polymer production. The United States shows 8.5% growth, supported by renewable fuel standard incentives and expanding bioplastics ecosystems with mass-balance adoption.

The report covers an in-depth analysis of 40+ countries, the top-performing countries are highlighted below.
Netherlands Leads Global Market Growth with Strategic Hub Position and Infrastructure Advantages

Renewable Naphtha Market Country Value Analysis

Revenue from renewable naphtha in the Netherlands is projected to exhibit exceptional growth with a CAGR of 10.2% through 2035, driven by Rotterdam-Moerdijk's established position as Europe's primary import, certification, and co-processing hub with direct access to major European steam cracker complexes and established infrastructure for handling renewable feedstock flows.

The country's strategic location, advanced port facilities, and concentration of petrochemical assets are creating substantial demand for renewable naphtha across both fuel blending and plastics production applications. Major petrochemical operators and renewable feedstock suppliers are establishing comprehensive renewable naphtha capabilities to serve both domestic processing facilities and trans-European distribution networks.

  • Advanced port infrastructure and renewable feedstock import capabilities are driving demand for certified renewable naphtha throughout Rotterdam-Moerdijk industrial corridor, supporting mass-balance certification flows and enabling efficient distribution to major European cracker facilities and polymer production sites.
  • Strong polymer brand pull and proximity to large steam crackers are supporting rapid adoption of renewable naphtha among petrochemical operators seeking bio-attributed polymer production capabilities and downstream brand owners demanding certified sustainable content in packaging and consumer goods applications.

Germany Demonstrates Strong Market Potential with Cracker Infrastructure and Brand-Led Demand

Revenue from renewable naphtha in Germany is expanding at a CAGR of 9.8%, supported by the country's extensive steam cracker base across North Rhine-Westphalia and Bavaria industrial regions, early adoption of mass-balance certification across polymer value chains, and strong brand-led demand for certified packaging resins from major consumer goods manufacturers.

The country's advanced petrochemical infrastructure and emphasis on circular economy principles are driving demand for sophisticated renewable naphtha capabilities. International feedstock suppliers and domestic petrochemical producers are establishing extensive co-processing and certification capabilities to address growing renewable naphtha demand.

  • Large integrated cracker capacity and advanced petrochemical infrastructure are creating opportunities for renewable naphtha adoption across major production sites, enabling bio-attributed polymer manufacturing and supporting brand owner commitments to certified sustainable content in packaging applications.
  • Carbon pricing mechanisms under EU Emissions Trading System and growing brand-led demand for certified bio-based content are driving adoption of renewable naphtha among petrochemical producers seeking enhanced sustainability credentials and downstream polymer converters requiring verified low-carbon feedstock sourcing.

France Demonstrates Biorefinery Leadership with Platform Integration and Policy Support

Revenue from renewable naphtha in France is expanding at a CAGR of 9.3%, supported by the country's development of integrated zero-crude biorefinery platforms such as the Grandpuits facility that co-produce renewable naphtha alongside sustainable aviation fuel and renewable diesel, comprehensive policy backing for low-carbon fuel and plastics value chains, and rising long-term offtake agreements from consumer goods and automotive sectors.

The nation's strategic approach to biorefinery development and emphasis on value chain integration are driving sophisticated renewable naphtha production capabilities throughout major refining regions. Leading energy companies and petrochemical operators are investing extensively in integrated biorefinery platforms and renewable feedstock processing.
  • Development of purpose-built biorefinery platforms co-producing renewable naphtha with sustainable aviation fuel and renewable diesel are creating integrated production capabilities, optimizing capital efficiency and supporting comprehensive low-carbon product portfolio strategies across transportation fuel and petrochemical applications.
  • Strong policy framework supporting sustainable aviation fuel mandates and circular plastics initiatives is driving adoption of renewable naphtha production capabilities among major refiners and petrochemical producers seeking diversified revenue streams and enhanced sustainability positioning.

Japan Focuses on Net-Zero Roadmap and Biobased Resin Development

Renewable Naphtha Market Japan Market Share Analysis By Product Type

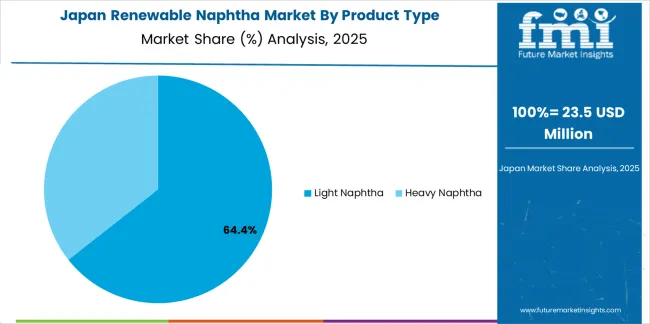
Revenue from renewable naphtha in Japan is growing at a CAGR of 9.1%, driven by the country's 2050 net-zero roadmap emphasizing biobased feedstocks for resin production, expanding petrochemical offtake agreements for mass-balance polyethylene and polypropylene, and advanced biorefinery pilot projects supported by corporate environmental, social, and governance mandates.

The country's sophisticated petrochemical sector and emphasis on technological innovation are supporting demand for advanced renewable naphtha capabilities across major production regions. Petrochemical companies and trading houses are establishing comprehensive renewable feedstock procurement strategies to serve domestic sustainability requirements.
  • National climate commitments and corporate net-zero targets are creating demand for renewable naphtha across major petrochemical producers, supporting bio-attributed polymer development and enabling brand owners to achieve sustainability objectives through certified mass-balance content.
  • Advanced petrochemical infrastructure and strong corporate environmental mandates are driving adoption of renewable naphtha procurement programs, with major producers establishing long-term supply agreements and developing specialized capabilities for mass-balance polymer production and sustainability reporting.

South Korea Emphasizes Refiner Transformation and Low-Carbon Feedstock Integration

Renewable Naphtha Market South Korea Market Share Analysis By Application

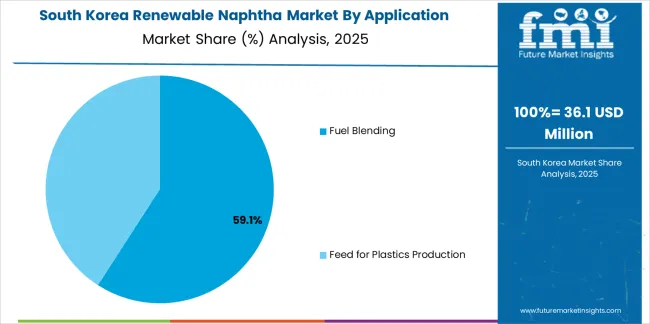
Revenue from renewable naphtha in South Korea is expanding at a CAGR of 9%, supported by major integrated refiners' strategic initiatives to incorporate low-carbon feedstocks into existing processing infrastructure, growing sustainability requirements from electronics and automotive original equipment manufacturers demanding certified bio-attributed packaging materials, and strategic partnerships with international waste-oil suppliers.

The country's world-scale refining capacity and export-oriented petrochemical sector are driving investment in renewable feedstock processing capabilities. Leading petrochemical complexes are establishing comprehensive co-processing and certification systems to serve both domestic and export markets.

  • Major refiner commitments to low-carbon feedstock integration and expanding co-processing capabilities are creating opportunities for renewable naphtha adoption across integrated petrochemical complexes, supporting bio-attributed polymer production for domestic and export applications.
  • Electronics and automotive sector sustainability requirements are driving demand for certified renewable naphtha among polymer producers serving original equipment manufacturer supply chains, with brand-led specifications requiring verified bio-based content and comprehensive carbon footprint documentation.

Brazil Focuses on Biofuels Heritage and Waste-Based Feedstock Development

Revenue from renewable naphtha in Brazil is growing at a CAGR of 8.7%, driven by the country's established biofuels policy framework supporting feedstock availability and sustainability certification infrastructure, emerging mass-balance polymer production initiatives with export potential to sustainability-focused markets, and growing investments in waste-oil collection networks and tall-oil processing pathways.

The country's agricultural strengths and expanding renewable energy sector are supporting development of diversified renewable feedstock capabilities. Domestic refiners and international renewable fuel producers are establishing integrated production and export logistics capabilities.

  • Strong biofuels policy heritage and established sustainability certification systems are creating favorable conditions for renewable naphtha production, leveraging existing feedstock collection infrastructure and regulatory frameworks to support market development and international trade.
  • Emerging mass-balance polymer production capabilities and waste-based feedstock availability are driving adoption of renewable naphtha among domestic petrochemical producers and international suppliers seeking cost-competitive production platforms with export access to premium sustainability-focused markets.

United States Emphasizes Policy Incentives and Bioplastics Ecosystem Growth

Revenue from renewable naphtha in the United States is expanding at a CAGR of 8.5%, supported by Renewable Fuel Standard and Low Carbon Fuel Standard incentives providing economic support when renewable naphtha is utilized for fuel blending applications, growing bioplastics ecosystem with expanding mass-balance polymer adoption among brand owners, and increasing waste-oil aggregation networks supporting co-processing capabilities at major refining centers.

The nation's large refining capacity and advanced petrochemical infrastructure are driving investment in renewable feedstock processing. Integrated refiners and specialized biorefinery developers are establishing comprehensive capabilities to serve both fuel and petrochemical markets.
  • Renewable Fuel Standard and state-level Low Carbon Fuel Standard programs are creating economic incentives for renewable naphtha production when allocated to fuel blending applications, supporting co-processing investments and enabling competitive pricing relative to conventional feedstocks.
  • Expanding bioplastics ecosystem and brand owner commitments to certified bio-attributed content are driving adoption of renewable naphtha among petrochemical producers, with growing mass-balance polymer production capabilities supporting sustainability-focused packaging and consumer goods applications.

Europe Market Split by Country

Renewable Naphtha Market Europe Country Market Share Analysis, 2025 & 2035

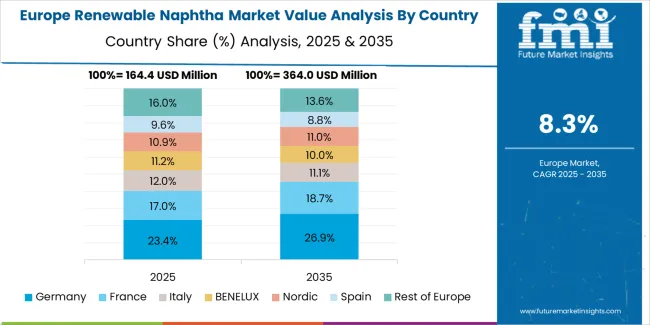
The renewable naphtha market in Europe is projected to grow from USD 280 million in 2025 to USD 690 million by 2035, registering a CAGR of 9.6% over the forecast period. Germany is expected to maintain its leadership position with a 22% market share in 2025, moderating slightly to 21.5% by 2035, supported by its large integrated cracker infrastructure, early mass-balance adoption across polymer chains, and concentration of petrochemical assets in Bavaria and North Rhine-Westphalia industrial corridors serving major European markets.

The Netherlands follows with 17% in 2025, projected to reach 17.3% by 2035, driven by Rotterdam-Moerdijk's established position as Europe's primary import, certification, and co-processing hub with direct access to major steam cracker complexes. France holds 15% in 2025, rising to 15.1% by 2035, supported by integrated biorefinery platforms in Normandy and Grandpuits regions and comprehensive policy backing for low-carbon fuels and plastics.

The United Kingdom commands 14% in 2025, projected to reach 14.2% by 2035, driven by circular plastics programs and refinery conversion initiatives. Italy accounts for 10% in 2025, expected to reach 10.2% by 2035, supported by growing hydrotreated vegetable oil co-processing capacity.

Spain maintains 7% in 2025, growing to 7.3% by 2035, driven by fuel blending pull and renewable diesel integration. The Rest of Europe region, including Nordic countries and Benelux sites, holds 15% in 2025, moderating to 14.4% by 2035, supported by scaling certified feedstock capabilities and distributed co-processing adoption across emerging markets implementing advanced certification standards.
Competitive Landscape of the Renewable Naphtha Market

Renewable Naphtha Market Analysis By Company

The renewable naphtha market is characterized by competition among established renewable fuel producers, integrated refining companies, and specialized biorefinery platform developers. Companies are investing in advanced feedstock aggregation networks, co-processing technology development, certification system integration, and comprehensive product portfolios to deliver sustainable, cost-competitive, and certified renewable naphtha solutions. Innovation in waste-based feedstock processing, mass-balance methodology implementation, and integrated biorefinery platforms is central to strengthening market position and competitive advantage.

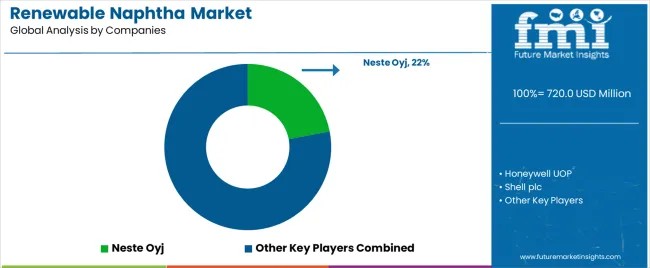
Neste Oyj leads the market with a commanding 22% market share, offering comprehensive renewable products solutions with advanced renewable naphtha production from multiple biorefinery platforms worldwide, emphasizing sustainability leadership and supply chain integration across diverse geographic markets and application segments.

Honeywell UOP provides specialized process technology with emphasis on renewable feedstock conversion and co-processing solutions enabling refinery transformation. Shell plc delivers integrated energy solutions with focus on renewable fuels and low-carbon petrochemicals through extensive refining network.

Eni SpA specializes in biorefinery development with emphasis on integrated zero-crude platforms and circular economy implementation. UPM Biofuels focuses on wood-based renewable feedstocks with emphasis on tall oil derivatives and forestry residue valorization. TotalEnergies SE offers comprehensive energy solutions with focus on biorefinery integration and mass-balance polymer production. Preem AB specializes in Nordic market leadership with emphasis on co-processing capabilities and certified renewable fuel production.

Braskem provides bio-attributed polymer solutions with focus on mass-balance polyethylene and sustainability certification. Galp Energia focuses on Iberian market development with emphasis on biorefinery conversion and renewable fuel integration. Chevron Renewable Energy Group offers integrated renewable fuels platform with emphasis on waste-based feedstock aggregation and co-processing technology.

Renewable Naphtha Market - Stakeholder Contribution Framework

Renewable naphtha represents a specialized low-carbon feedstock segment within petrochemical and fuel applications, projected to grow from USD 720 million in 2025 to USD 1,752 million by 2035 at a 9.3% CAGR. These bio-based naphtha products-primarily light naphtha specifications for steam cracker applications-are produced through hydrotreating and co-processing of waste oils, vegetable oils, and advanced bio-feedstocks in refineries and biorefineries to serve as drop-in replacements for fossil naphtha in fuel blending, plastics production, and chemical manufacturing applications.

Market expansion is driven by increasing regulatory pressure for petrochemical decarbonization, growing adoption of mass-balance certification frameworks, expanding waste-based feedstock availability, and rising demand for bio-attributed polymers and low-carbon fuels across packaging, automotive, and consumer goods value chains.

How Petrochemical Industry Regulators Could Strengthen Sustainability Standards and Market Development?

  • Mass-Balance Certification Standards: Establish comprehensive technical specifications for renewable naphtha traceability, including chain of custody requirements, greenhouse gas calculation methodologies, sustainability criteria verification, and allocation principles that ensure transparent bio-attributed content claims in polymer and chemical applications.
  • Carbon Intensity Accounting Integration: Develop regulatory frameworks that incorporate renewable naphtha carbon intensity reductions into product-level environmental footprint calculations, enabling downstream manufacturers to claim verified emission reductions and supporting corporate sustainability reporting requirements.
  • Feedstock Sustainability Criteria: Implement mandatory sustainability standards for renewable naphtha feedstock sourcing, including waste-based feedstock prioritization, land-use change risk mitigation, social safeguards compliance, and biodiversity protection requirements aligned with international best practices.
  • Drop-In Quality Specifications: Create standardized quality criteria for renewable naphtha ensuring compatibility with existing petrochemical infrastructure, including distillation range, aromatic content, sulfur specifications, and impurity limits that guarantee processing reliability and product performance.
  • Technology Development Incentives: Provide regulatory support and financial incentives for research and development of advanced renewable naphtha production technologies that improve conversion efficiency, expand feedstock flexibility, and enhance carbon intensity performance across biorefinery applications.

How Industry Associations Could Advance Best Practices and Market Transparency?

  • Certification Framework Harmonization: Develop comprehensive guidelines for renewable naphtha certification alignment, including mass-balance methodology standardization, greenhouse gas calculation protocol convergence, and mutual recognition agreements that reduce administrative burden and facilitate international trade.
  • Feedstock Quality Standards: Establish technical specifications for renewable feedstock preprocessing, contaminant control, and quality assurance that optimize conversion efficiency, protect processing equipment, and ensure consistent renewable naphtha product quality across diverse production facilities.
  • Co-Processing Guidelines: Create industry-wide best practices for renewable feedstock co-processing in existing refineries, including blend ratio optimization, operational parameter adjustment, product quality monitoring, and maintenance protocols specific to renewable input handling.
  • Market Transparency Initiatives: Develop standardized reporting frameworks for renewable naphtha production volumes, feedstock sourcing, carbon intensity performance, and certification status that enable market price discovery and support informed procurement decisions.
  • Professional Training Programs: Establish specialized training curricula for refinery operators, quality control personnel, and sustainability managers covering renewable naphtha production technology, certification system navigation, and bio-attributed product development for petrochemical applications.

How Renewable Naphtha Producers Could Drive Technology Innovation and Market Leadership?

  • Advanced Feedstock Processing: Invest in research and development of proprietary pretreatment technologies, catalyst systems, and process configurations that enable superior feedstock flexibility, improve product yields, and reduce carbon intensity across waste-based and virgin oil feedstock slates.
  • Integrated Biorefinery Development: Develop multi-product biorefinery platforms that optimize production economics through flexible product slate management, co-producing renewable diesel, sustainable aviation fuel, and renewable naphtha while responding dynamically to relative market values and regulatory incentives.
  • Feedstock Aggregation Networks: Establish comprehensive used cooking oil, waste fat, and residue collection systems with preprocessing capabilities that secure long-term feedstock supply, reduce raw material costs, and support sustainability credential differentiation through waste-based sourcing.
  • Certification Excellence: Implement robust chain of custody systems, comprehensive sustainability documentation, and multi-scheme certification capabilities that ensure market access, support premium pricing realization, and enable seamless integration with downstream customer requirements.
  • Customer Partnership Programs: Develop long-term offtake agreements with petrochemical producers, polymer manufacturers, and brand owners that provide volume certainty, support capital investment decisions, and enable collaborative product development addressing specific application requirements.

How Petrochemical Producers Could Optimize Renewable Integration and Value Creation?

  • Strategic Co-Processing Implementation: Conduct comprehensive technical assessments of existing refinery and cracker infrastructure to identify optimal renewable feedstock integration points, establish co-processing capabilities, and maximize renewable naphtha utilization while maintaining operational flexibility.
  • Mass-Balance System Development: Implement certified mass-balance accounting systems that enable bio-attributed polymer production, support customer sustainability requirements, and optimize allocation of renewable content across product portfolios based on market demand and premium pricing opportunities.
  • Feedstock Procurement Strategy: Develop diversified renewable naphtha sourcing strategies incorporating multiple feedstock pathways, geographic supply sources, and certification schemes that ensure supply security, optimize procurement costs, and maintain sustainability credential quality.
  • Bio-Attributed Product Innovation: Create specialized polymer grades and chemical products featuring verified bio-based content, enhanced sustainability credentials, and performance characteristics that address brand owner requirements for certified sustainable materials in packaging and consumer goods applications.
  • Value Chain Collaboration: Establish partnerships with downstream converters, brand owners, and retailers to co-develop bio-attributed product solutions, share sustainability messaging, and capture premium pricing for certified low-carbon polymers across packaging, automotive, and consumer electronics value chains.

How Brand Owners Could Drive Sustainable Packaging and Materials Adoption?

  • Renewable Content Commitments: Establish ambitious targets for bio-attributed polymer adoption in packaging and product applications, creating demand pull for mass-balance certified materials and driving petrochemical producers to expand renewable naphtha procurement.
  • Certification Requirement Standards: Develop comprehensive sustainability criteria for polymer suppliers including ISCC+ certification requirements, carbon intensity thresholds, feedstock sustainability verification, and transparent supply chain documentation that ensures credibility and drives market quality standards.
  • Collaborative Procurement Programs: Participate in industry consortia and collective procurement initiatives that aggregate demand for bio-attributed polymers, provide volume commitments supporting investment in renewable naphtha infrastructure, and accelerate market development through coordinated purchasing power.
  • Consumer Communication Excellence: Develop effective consumer messaging strategies that explain mass-balance methodology, communicate environmental benefits of bio-attributed packaging, and build consumer acceptance for certified sustainable materials without greenwashing risks.
  • Supply Chain Transparency: Implement comprehensive traceability systems that track bio-attributed content through polymer supply chains, verify certification validity, and enable accurate environmental footprint calculations supporting corporate sustainability reporting and regulatory compliance.

How Investors and Financial Enablers Could Support Market Growth and Infrastructure Development?

  • Biorefinery Project Financing: Provide capital for integrated biorefinery development, refinery conversion projects, and co-processing infrastructure upgrades that expand renewable naphtha production capacity and support market scale-up across diverse geographic regions.
  • Technology Development Investment: Finance research and development of breakthrough conversion technologies, advanced catalyst systems, and novel feedstock pathways that improve production economics, expand feedstock flexibility, and enhance environmental performance.
  • Feedstock Infrastructure Development: Support waste-oil aggregation networks, preprocessing facility development, and logistics infrastructure that secure feedstock supply chains and enable cost-competitive renewable naphtha production.
  • Certification System Enhancement: Fund development of digital traceability platforms, blockchain-based chain of custody systems, and advanced verification technologies that reduce certification costs, improve transparency, and combat fraud risks.
  • Market Development Initiatives: Provide capital for pilot projects, demonstration facilities, and early commercial deployments that reduce technology risk, validate business models, and accelerate mainstream adoption of renewable naphtha across petrochemical applications.

Key Players in the Renewable Naphtha Market

  • Neste Oyj
  • Honeywell UOP
  • Shell plc
  • Eni SpA
  • UPM Biofuels
  • TotalEnergies SE
  • Preem AB
  • Braskem
  • Galp Energia
  • Chevron Renewable Energy Group
  • Repsol
  • Phillips 66
  • Marathon Petroleum
  • Valero Energy
  • HCS Group

Scope of the Report

Items Values
Quantitative Units (2025) USD 720 million
Product Type Light Naphtha, Heavy Naphtha
Application Fuel Blending, Feed for Plastics Production
Feedstock Used Cooking Oil & Waste Fats, Vegetable Oils/Tall Oil & Residues, Advanced Bio-oils/Pyrolysis Oils, Other Waste Lipids
Certification/Traceability ISCC+/ISCC EU, RSB, Other Schemes
Processing Route Co-processing in Integrated Refineries/Biorefineries, Standalone Renewable Units
Regions Covered Europe, Asia Pacific, North America, Latin America, Middle East & Africa
Countries Covered Netherlands, Germany, France, Japan, South Korea, Brazil, United States, and 40+ countries
Key Companies Profiled Neste Oyj, Honeywell UOP, Shell plc, Eni SpA, UPM Biofuels, TotalEnergies SE
Additional Attributes Dollar sales by product type, application, feedstock, certification, and processing route categories, regional demand trends, competitive landscape, technological advancements in biorefinery systems, mass-balance certification development, feedstock sustainability innovation, and carbon intensity optimization

Renewable Naphtha Market by Segments

Product Type:

  • Light Naphtha
  • Heavy Naphtha

Application:

  • Fuel Blending
  • Feed for Plastics Production

Feedstock:

  • Used Cooking Oil & Waste Fats
  • Vegetable Oils/Tall Oil & Residues
  • Advanced Bio-oils/Pyrolysis Oils
  • Other Waste Lipids (Mixed/Animal)

Certification/Traceability:

  • ISCC+/ISCC EU
  • RSB
  • Other Schemes (RED-aligned National)

Processing Route:

  • Co-processing in Integrated Refineries/Biorefineries
  • Standalone Renewable Units

Region:

  • Europe
    • Germany
    • Netherlands
    • France
    • United Kingdom
    • Italy
    • Spain
    • Nordic
    • BENELUX
    • Rest of Europe
  • Asia Pacific
    • Japan
    • South Korea
    • China
    • India
    • ASEAN
    • Australia & New Zealand
    • Rest of Asia Pacific
  • North America
    • United States
    • Canada
    • Mexico
    • Latin America
    • Brazil
    • Argentina
    • Chile
    • Rest of Latin America
  • Middle East & Africa
    • Kingdom of Saudi Arabia
    • Other GCC Countries
    • Turkey
    • South Africa
    • Other African Union
    • Rest of Middle East & Africa

Frequently Asked Questions

How big is the renewable naphtha market in 2025?

The global renewable naphtha market is estimated to be valued at USD 720.0 million in 2025.

What will be the size of renewable naphtha market in 2035?

The market size for the renewable naphtha market is projected to reach USD 1,752.0 million by 2035.

How much will be the renewable naphtha market growth between 2025 and 2035?

The renewable naphtha market is expected to grow at a 9.3% CAGR between 2025 and 2035.

What are the key product types in the renewable naphtha market?

The key product types in renewable naphtha market are light naphtha and heavy naphtha.

Which application segment to contribute significant share in the renewable naphtha market in 2025?

In terms of application, fuel blending segment to command 58.2% share in the renewable naphtha market in 2025.

Table of Content

  1. Executive Summary
    • Global Market Outlook
    • Demand to side Trends
    • Supply to side Trends
    • Technology Roadmap Analysis
    • Analysis and Recommendations
  2. Market Overview
    • Market Coverage / Taxonomy
    • Market Definition / Scope / Limitations
  3. Market Background
    • Market Dynamics
      • Drivers
      • Restraints
      • Opportunity
      • Trends
    • Scenario Forecast
      • Demand in Optimistic Scenario
      • Demand in Likely Scenario
      • Demand in Conservative Scenario
    • Opportunity Map Analysis
    • Product Life Cycle Analysis
    • Supply Chain Analysis
    • Investment Feasibility Matrix
    • Value Chain Analysis
    • PESTLE and Porter’s Analysis
    • Regulatory Landscape
    • Regional Parent Market Outlook
    • Production and Consumption Statistics
    • Import and Export Statistics
  4. Global Market Analysis 2020 to 2024 and Forecast, 2025 to 2035
    • Historical Market Size Value (USD Million) Analysis, 2020 to 2024
    • Current and Future Market Size Value (USD Million) Projections, 2025 to 2035
      • Y to o to Y Growth Trend Analysis
      • Absolute $ Opportunity Analysis
  5. Global Market Pricing Analysis 2020 to 2024 and Forecast 2025 to 2035
  6. Global Market Analysis 2020 to 2024 and Forecast 2025 to 2035, By Product Type
    • Introduction / Key Findings
    • Historical Market Size Value (USD Million) Analysis By Product Type , 2020 to 2024
    • Current and Future Market Size Value (USD Million) Analysis and Forecast By Product Type , 2025 to 2035
      • Light Naphtha
      • Heavy Naphtha
    • Y to o to Y Growth Trend Analysis By Product Type , 2020 to 2024
    • Absolute $ Opportunity Analysis By Product Type , 2025 to 2035
  7. Global Market Analysis 2020 to 2024 and Forecast 2025 to 2035, By Application
    • Introduction / Key Findings
    • Historical Market Size Value (USD Million) Analysis By Application, 2020 to 2024
    • Current and Future Market Size Value (USD Million) Analysis and Forecast By Application, 2025 to 2035
      • Fuel Blending
      • Feed for Plastics Production
    • Y to o to Y Growth Trend Analysis By Application, 2020 to 2024
    • Absolute $ Opportunity Analysis By Application, 2025 to 2035
  8. Global Market Analysis 2020 to 2024 and Forecast 2025 to 2035, By Region
    • Introduction
    • Historical Market Size Value (USD Million) Analysis By Region, 2020 to 2024
    • Current Market Size Value (USD Million) Analysis and Forecast By Region, 2025 to 2035
      • North America
      • Latin America
      • Western Europe
      • Eastern Europe
      • East Asia
      • South Asia and Pacific
      • Middle East & Africa
    • Market Attractiveness Analysis By Region
  9. North America Market Analysis 2020 to 2024 and Forecast 2025 to 2035, By Country
    • Historical Market Size Value (USD Million) Trend Analysis By Market Taxonomy, 2020 to 2024
    • Market Size Value (USD Million) Forecast By Market Taxonomy, 2025 to 2035
      • By Country
        • USA
        • Canada
        • Mexico
      • By Product Type
      • By Application
    • Market Attractiveness Analysis
      • By Country
      • By Product Type
      • By Application
    • Key Takeaways
  10. Latin America Market Analysis 2020 to 2024 and Forecast 2025 to 2035, By Country
    • Historical Market Size Value (USD Million) Trend Analysis By Market Taxonomy, 2020 to 2024
    • Market Size Value (USD Million) Forecast By Market Taxonomy, 2025 to 2035
      • By Country
        • Brazil
        • Chile
        • Rest of Latin America
      • By Product Type
      • By Application
    • Market Attractiveness Analysis
      • By Country
      • By Product Type
      • By Application
    • Key Takeaways
  11. Western Europe Market Analysis 2020 to 2024 and Forecast 2025 to 2035, By Country
    • Historical Market Size Value (USD Million) Trend Analysis By Market Taxonomy, 2020 to 2024
    • Market Size Value (USD Million) Forecast By Market Taxonomy, 2025 to 2035
      • By Country
        • Germany
        • UK
        • Italy
        • Spain
        • France
        • Nordic
        • BENELUX
        • Rest of Western Europe
      • By Product Type
      • By Application
    • Market Attractiveness Analysis
      • By Country
      • By Product Type
      • By Application
    • Key Takeaways
  12. Eastern Europe Market Analysis 2020 to 2024 and Forecast 2025 to 2035, By Country
    • Historical Market Size Value (USD Million) Trend Analysis By Market Taxonomy, 2020 to 2024
    • Market Size Value (USD Million) Forecast By Market Taxonomy, 2025 to 2035
      • By Country
        • Russia
        • Poland
        • Hungary
        • Balkan & Baltic
        • Rest of Eastern Europe
      • By Product Type
      • By Application
    • Market Attractiveness Analysis
      • By Country
      • By Product Type
      • By Application
    • Key Takeaways
  13. East Asia Market Analysis 2020 to 2024 and Forecast 2025 to 2035, By Country
    • Historical Market Size Value (USD Million) Trend Analysis By Market Taxonomy, 2020 to 2024
    • Market Size Value (USD Million) Forecast By Market Taxonomy, 2025 to 2035
      • By Country
        • China
        • Japan
        • South Korea
      • By Product Type
      • By Application
    • Market Attractiveness Analysis
      • By Country
      • By Product Type
      • By Application
    • Key Takeaways
  14. South Asia and Pacific Market Analysis 2020 to 2024 and Forecast 2025 to 2035, By Country
    • Historical Market Size Value (USD Million) Trend Analysis By Market Taxonomy, 2020 to 2024
    • Market Size Value (USD Million) Forecast By Market Taxonomy, 2025 to 2035
      • By Country
        • India
        • ASEAN
        • Australia & New Zealand
        • Rest of South Asia and Pacific
      • By Product Type
      • By Application
    • Market Attractiveness Analysis
      • By Country
      • By Product Type
      • By Application
    • Key Takeaways
  15. Middle East & Africa Market Analysis 2020 to 2024 and Forecast 2025 to 2035, By Country
    • Historical Market Size Value (USD Million) Trend Analysis By Market Taxonomy, 2020 to 2024
    • Market Size Value (USD Million) Forecast By Market Taxonomy, 2025 to 2035
      • By Country
        • Kingdom of Saudi Arabia
        • Other GCC Countries
        • Turkiye
        • South Africa
        • Other African Union
        • Rest of Middle East & Africa
      • By Product Type
      • By Application
    • Market Attractiveness Analysis
      • By Country
      • By Product Type
      • By Application
    • Key Takeaways
  16. Key Countries Market Analysis
    • USA
      • Pricing Analysis
      • Market Share Analysis, 2024
        • By Product Type
        • By Application
    • Canada
      • Pricing Analysis
      • Market Share Analysis, 2024
        • By Product Type
        • By Application
    • Mexico
      • Pricing Analysis
      • Market Share Analysis, 2024
        • By Product Type
        • By Application
    • Brazil
      • Pricing Analysis
      • Market Share Analysis, 2024
        • By Product Type
        • By Application
    • Chile
      • Pricing Analysis
      • Market Share Analysis, 2024
        • By Product Type
        • By Application
    • Germany
      • Pricing Analysis
      • Market Share Analysis, 2024
        • By Product Type
        • By Application
    • UK
      • Pricing Analysis
      • Market Share Analysis, 2024
        • By Product Type
        • By Application
    • Italy
      • Pricing Analysis
      • Market Share Analysis, 2024
        • By Product Type
        • By Application
    • Spain
      • Pricing Analysis
      • Market Share Analysis, 2024
        • By Product Type
        • By Application
    • France
      • Pricing Analysis
      • Market Share Analysis, 2024
        • By Product Type
        • By Application
    • India
      • Pricing Analysis
      • Market Share Analysis, 2024
        • By Product Type
        • By Application
    • ASEAN
      • Pricing Analysis
      • Market Share Analysis, 2024
        • By Product Type
        • By Application
    • Australia & New Zealand
      • Pricing Analysis
      • Market Share Analysis, 2024
        • By Product Type
        • By Application
    • China
      • Pricing Analysis
      • Market Share Analysis, 2024
        • By Product Type
        • By Application
    • Japan
      • Pricing Analysis
      • Market Share Analysis, 2024
        • By Product Type
        • By Application
    • South Korea
      • Pricing Analysis
      • Market Share Analysis, 2024
        • By Product Type
        • By Application
    • Russia
      • Pricing Analysis
      • Market Share Analysis, 2024
        • By Product Type
        • By Application
    • Poland
      • Pricing Analysis
      • Market Share Analysis, 2024
        • By Product Type
        • By Application
    • Hungary
      • Pricing Analysis
      • Market Share Analysis, 2024
        • By Product Type
        • By Application
    • Kingdom of Saudi Arabia
      • Pricing Analysis
      • Market Share Analysis, 2024
        • By Product Type
        • By Application
    • Turkiye
      • Pricing Analysis
      • Market Share Analysis, 2024
        • By Product Type
        • By Application
    • South Africa
      • Pricing Analysis
      • Market Share Analysis, 2024
        • By Product Type
        • By Application
  17. Market Structure Analysis
    • Competition Dashboard
    • Competition Benchmarking
    • Market Share Analysis of Top Players
      • By Regional
      • By Product Type
      • By Application
  18. Competition Analysis
    • Competition Deep Dive
      • Neste Oyj
        • Overview
        • Product Portfolio
        • Profitability by Market Segments (Product/Age /Sales Channel/Region)
        • Sales Footprint
        • Strategy Overview
          • Marketing Strategy
          • Product Strategy
          • Channel Strategy
      • Honeywell UOP
      • Shell plc
      • Eni SpA
      • UPM Biofuels
      • TotalEnergies SE
      • Preem AB
      • Braskem
      • Galp Energia
      • Chevron Renewable Energy Group
      • Repsol
      • Phillips 66
      • Marathon Petroleum
      • Valero Energy
      • HCS Group
  19. Assumptions & Acronyms Used
  20. Research Methodology

List of Tables

  • Table 1: Global Market Value (USD Million) Forecast by Region, 2020 to 2035
  • Table 2: Global Market Value (USD Million) Forecast by Product Type , 2020 to 2035
  • Table 3: Global Market Value (USD Million) Forecast by Application, 2020 to 2035
  • Table 4: North America Market Value (USD Million) Forecast by Country, 2020 to 2035
  • Table 5: North America Market Value (USD Million) Forecast by Product Type , 2020 to 2035
  • Table 6: North America Market Value (USD Million) Forecast by Application, 2020 to 2035
  • Table 7: Latin America Market Value (USD Million) Forecast by Country, 2020 to 2035
  • Table 8: Latin America Market Value (USD Million) Forecast by Product Type , 2020 to 2035
  • Table 9: Latin America Market Value (USD Million) Forecast by Application, 2020 to 2035
  • Table 10: Western Europe Market Value (USD Million) Forecast by Country, 2020 to 2035
  • Table 11: Western Europe Market Value (USD Million) Forecast by Product Type , 2020 to 2035
  • Table 12: Western Europe Market Value (USD Million) Forecast by Application, 2020 to 2035
  • Table 13: Eastern Europe Market Value (USD Million) Forecast by Country, 2020 to 2035
  • Table 14: Eastern Europe Market Value (USD Million) Forecast by Product Type , 2020 to 2035
  • Table 15: Eastern Europe Market Value (USD Million) Forecast by Application, 2020 to 2035
  • Table 16: East Asia Market Value (USD Million) Forecast by Country, 2020 to 2035
  • Table 17: East Asia Market Value (USD Million) Forecast by Product Type , 2020 to 2035
  • Table 18: East Asia Market Value (USD Million) Forecast by Application, 2020 to 2035
  • Table 19: South Asia and Pacific Market Value (USD Million) Forecast by Country, 2020 to 2035
  • Table 20: South Asia and Pacific Market Value (USD Million) Forecast by Product Type , 2020 to 2035
  • Table 21: South Asia and Pacific Market Value (USD Million) Forecast by Application, 2020 to 2035
  • Table 22: Middle East & Africa Market Value (USD Million) Forecast by Country, 2020 to 2035
  • Table 23: Middle East & Africa Market Value (USD Million) Forecast by Product Type , 2020 to 2035
  • Table 24: Middle East & Africa Market Value (USD Million) Forecast by Application, 2020 to 2035

List of Figures

  • Figure 1: Global Market Pricing Analysis
  • Figure 2: Global Market Value (USD Million) Forecast 2020-2035
  • Figure 3: Global Market Value Share and BPS Analysis by Product Type , 2025 and 2035
  • Figure 4: Global Market Y to o to Y Growth Comparison by Product Type , 2025-2035
  • Figure 5: Global Market Attractiveness Analysis by Product Type
  • Figure 6: Global Market Value Share and BPS Analysis by Application, 2025 and 2035
  • Figure 7: Global Market Y to o to Y Growth Comparison by Application, 2025-2035
  • Figure 8: Global Market Attractiveness Analysis by Application
  • Figure 9: Global Market Value (USD Million) Share and BPS Analysis by Region, 2025 and 2035
  • Figure 10: Global Market Y to o to Y Growth Comparison by Region, 2025-2035
  • Figure 11: Global Market Attractiveness Analysis by Region
  • Figure 12: North America Market Incremental Dollar Opportunity, 2025-2035
  • Figure 13: Latin America Market Incremental Dollar Opportunity, 2025-2035
  • Figure 14: Western Europe Market Incremental Dollar Opportunity, 2025-2035
  • Figure 15: Eastern Europe Market Incremental Dollar Opportunity, 2025-2035
  • Figure 16: East Asia Market Incremental Dollar Opportunity, 2025-2035
  • Figure 17: South Asia and Pacific Market Incremental Dollar Opportunity, 2025-2035
  • Figure 18: Middle East & Africa Market Incremental Dollar Opportunity, 2025-2035
  • Figure 19: North America Market Value Share and BPS Analysis by Country, 2025 and 2035
  • Figure 20: North America Market Value Share and BPS Analysis by Product Type , 2025 and 2035
  • Figure 21: North America Market Y to o to Y Growth Comparison by Product Type , 2025-2035
  • Figure 22: North America Market Attractiveness Analysis by Product Type
  • Figure 23: North America Market Value Share and BPS Analysis by Application, 2025 and 2035
  • Figure 24: North America Market Y to o to Y Growth Comparison by Application, 2025-2035
  • Figure 25: North America Market Attractiveness Analysis by Application
  • Figure 26: Latin America Market Value Share and BPS Analysis by Country, 2025 and 2035
  • Figure 27: Latin America Market Value Share and BPS Analysis by Product Type , 2025 and 2035
  • Figure 28: Latin America Market Y to o to Y Growth Comparison by Product Type , 2025-2035
  • Figure 29: Latin America Market Attractiveness Analysis by Product Type
  • Figure 30: Latin America Market Value Share and BPS Analysis by Application, 2025 and 2035
  • Figure 31: Latin America Market Y to o to Y Growth Comparison by Application, 2025-2035
  • Figure 32: Latin America Market Attractiveness Analysis by Application
  • Figure 33: Western Europe Market Value Share and BPS Analysis by Country, 2025 and 2035
  • Figure 34: Western Europe Market Value Share and BPS Analysis by Product Type , 2025 and 2035
  • Figure 35: Western Europe Market Y to o to Y Growth Comparison by Product Type , 2025-2035
  • Figure 36: Western Europe Market Attractiveness Analysis by Product Type
  • Figure 37: Western Europe Market Value Share and BPS Analysis by Application, 2025 and 2035
  • Figure 38: Western Europe Market Y to o to Y Growth Comparison by Application, 2025-2035
  • Figure 39: Western Europe Market Attractiveness Analysis by Application
  • Figure 40: Eastern Europe Market Value Share and BPS Analysis by Country, 2025 and 2035
  • Figure 41: Eastern Europe Market Value Share and BPS Analysis by Product Type , 2025 and 2035
  • Figure 42: Eastern Europe Market Y to o to Y Growth Comparison by Product Type , 2025-2035
  • Figure 43: Eastern Europe Market Attractiveness Analysis by Product Type
  • Figure 44: Eastern Europe Market Value Share and BPS Analysis by Application, 2025 and 2035
  • Figure 45: Eastern Europe Market Y to o to Y Growth Comparison by Application, 2025-2035
  • Figure 46: Eastern Europe Market Attractiveness Analysis by Application
  • Figure 47: East Asia Market Value Share and BPS Analysis by Country, 2025 and 2035
  • Figure 48: East Asia Market Value Share and BPS Analysis by Product Type , 2025 and 2035
  • Figure 49: East Asia Market Y to o to Y Growth Comparison by Product Type , 2025-2035
  • Figure 50: East Asia Market Attractiveness Analysis by Product Type
  • Figure 51: East Asia Market Value Share and BPS Analysis by Application, 2025 and 2035
  • Figure 52: East Asia Market Y to o to Y Growth Comparison by Application, 2025-2035
  • Figure 53: East Asia Market Attractiveness Analysis by Application
  • Figure 54: South Asia and Pacific Market Value Share and BPS Analysis by Country, 2025 and 2035
  • Figure 55: South Asia and Pacific Market Value Share and BPS Analysis by Product Type , 2025 and 2035
  • Figure 56: South Asia and Pacific Market Y to o to Y Growth Comparison by Product Type , 2025-2035
  • Figure 57: South Asia and Pacific Market Attractiveness Analysis by Product Type
  • Figure 58: South Asia and Pacific Market Value Share and BPS Analysis by Application, 2025 and 2035
  • Figure 59: South Asia and Pacific Market Y to o to Y Growth Comparison by Application, 2025-2035
  • Figure 60: South Asia and Pacific Market Attractiveness Analysis by Application
  • Figure 61: Middle East & Africa Market Value Share and BPS Analysis by Country, 2025 and 2035
  • Figure 62: Middle East & Africa Market Value Share and BPS Analysis by Product Type , 2025 and 2035
  • Figure 63: Middle East & Africa Market Y to o to Y Growth Comparison by Product Type , 2025-2035
  • Figure 64: Middle East & Africa Market Attractiveness Analysis by Product Type
  • Figure 65: Middle East & Africa Market Value Share and BPS Analysis by Application, 2025 and 2035
  • Figure 66: Middle East & Africa Market Y to o to Y Growth Comparison by Application, 2025-2035
  • Figure 67: Middle East & Africa Market Attractiveness Analysis by Application
  • Figure 68: Global Market - Tier Structure Analysis
  • Figure 69: Global Market - Company Share Analysis
Dashboard
Dashboard
Dashboard
Dashboard
Dashboard
Dashboard

Full Research Suite comprises of:

Market outlook & trends analysis

Market outlook & trends analysis

Interviews & case studies

Interviews & case studies

Strategic recommendations

Strategic recommendations

Vendor profiles & capabilities analysis

Vendor profiles & capabilities analysis

5-year forecasts

5-year forecasts

8 regions and 60+ country-level data splits

8 regions and 60+ country-level data splits

Market segment data splits

Market segment data splits

12 months of continuous data updates

12 months of continuous data updates

DELIVERED AS:

PDF EXCEL ONLINE

Full Research Suite


$5000

$7500

$10000

Buy Report Now
Similar Industry Reports

Similar Industry Reports

Renewable Isocyanate Market

Renewable Isocyanate Market Forecast and Outlook 2025 to 2035

Renewables Energy Consulting Service Market

Renewables Energy Consulting Service Market Size and Share Forecast Outlook 2025 to 2035

Renewable Biopolymer Cosmetics Market

Renewable Biopolymer Cosmetics Market Size and Share Forecast Outlook 2025 to 2035

Renewable Based Shunt Reactor Market

Renewable Based Shunt Reactor Market Size and Share Forecast Outlook 2025 to 2035

Renewable Energy Certificate Market

Renewable Energy Certificate Market Size and Share Forecast Outlook 2025 to 2035

Renewable Polyethylene Market

Renewable Polyethylene Market Size and Share Forecast Outlook 2025 to 2035

Renewable Energy Contactor Market

Renewable Energy Contactor Market Size and Share Forecast Outlook 2025 to 2035

Renewable Methanol Market

Renewable Methanol Market Growth - Trends & Forecast 2025 to 2035

Renewable Solvents Market

Renewable Solvents Market

Naphthalene Market
Naphthalene Market

Naphthalene Market Size and Share Forecast Outlook 2025 to 2035

Naphthalene Derivatives Market

Naphthalene Derivatives Market Growth & Demand 2025 to 2035

3-Methoxynaphthalene-2-Boronic Acid Market

3-Methoxynaphthalene-2-Boronic Acid Market Forecast and Outlook 2025 to 2035

2-Methoxynaphthalene-1-Boronic Acid Market

2-Methoxynaphthalene-1-Boronic Acid Market Forecast and Outlook 2025 to 2035

1-Methoxynaphthalene-2-Boronic Acid Market

1-Methoxynaphthalene-2-Boronic Acid Market Forecast and Outlook 2025 to 2035

Bio-Based Naphtha Market

Bio-Based Naphtha Market Size and Share Forecast Outlook 2025 to 2035

Polyethylene Naphthalate (PEN) Market

Polyethylene Naphthalate (PEN) Market Size and Share Forecast Outlook 2025 to 2035

Future Market Insights

Renewable Naphtha Market

Chat With MaRIA

Chat With

MaRIA

Hi There, I am MaRIA, Your Market Research Intelligence Assistant. How may I help you?