Heating Agents Market Size and Share Forecast Outlook 2025 to 2035

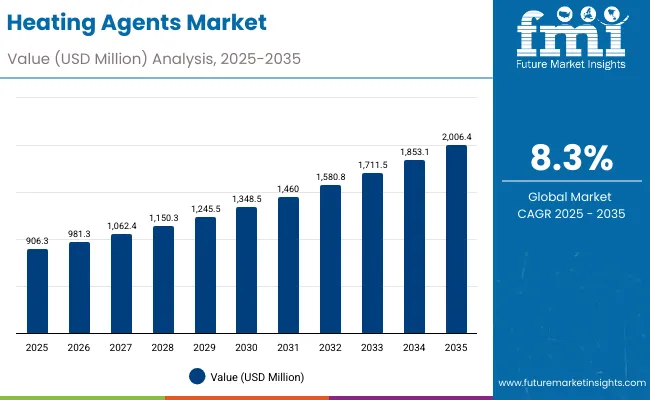
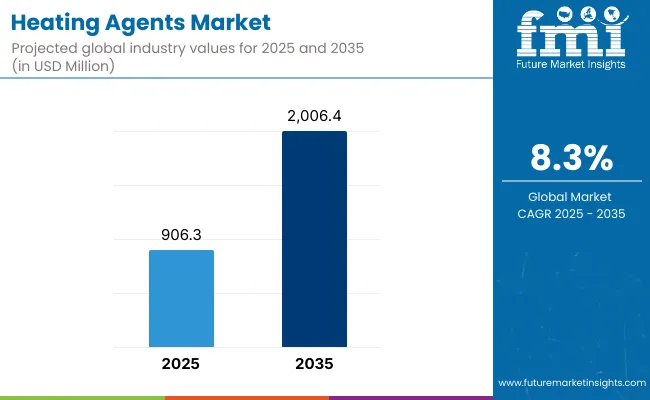
The Global Heating Agents Market is expected to record a valuation of USD 906.3 million in 2025 and USD 2,006.4 million in 2035, with an increase of USD 1,100.1 million, which equals a growth of 193% over the decade. The overall expansion represents a CAGR of 8.3% and a 2X increase in market size.
Heating Agents Market Value Analysis

Quick Stats for Global Heating Agents Market

  • Global Heating Agents Market Value (2025): USD 906.3 million
  • Global Heating Agents Market Forecast Value (2035): USD 2,006.4 million
  • Global Heating Agents Market Forecast CAGR: 8.3%
  • Leading Segment in Global Heating Agents Market in 2025: Vanillyl ether derivatives (VBE) - 38.4%
  • Key Growth Regions in the Global Heating Agents Market: East Asia, South Asia & Pacific, North America
  • Top Key Players in Global Heating Agents Market: Symrise, Givaudan, Takasago, Mane, IFF, Sensient, Nikkol, DSM-Firmenich, Robertet, Ashland

Heating Agents Market

Global Heating Agents Market Key Takeaways

Metric Value
Global Heating Agents Market Estimated Value in (2025E) USD 906.3 million
Global Heating Agents Market Forecast Value in (2035F) USD 2,006.4 million
Forecast CAGR (2025 to 2035) 8.30%

During the first five-year period from 2025 to 2030, the market increases from USD 906.3 million to USD 1,348.5 million, adding USD 442.2 million, which accounts for 40.2% of the total decade growth. This phase records steady adoption in personal care, dermocosmetic formulations, and spa/sports applications, driven by the rising demand for sensory-driven formulations that improve consumer experiences.

Vanillyl ether derivatives (VBE) dominate this period as they cater to more than 38% of global demand, due to their stability, reliable warming profile, and regulatory acceptability in cosmetics. Long-lasting warming actives also gain strong traction in this stage as they fit well with product claims around sustained effects in slimming gels, lip plumpers, and muscle balms.

The second half from 2030 to 2035 contributes USD 657.9 million, equal to 59.8% of total growth, as the market jumps from USD 1,348.5 million to USD 2,006.4 million. This acceleration is powered by increased deployment of thermo-sensory blends in multifunctional products such as anti-aging serums, scalp treatments, and advanced spa therapies.

Encapsulated and bead-based delivery systems expand rapidly, allowing better stability and controlled release. Regional growth is particularly strong in Asia-Pacific, led by China and India with double-digit CAGRs above 12%, where beauty and wellness consumer bases are expanding rapidly. The rising demand for professional spa-grade products and dermocosmetic innovations further enhances uptake. By 2035, free-form systems retain strong presence but encapsulated formats gain higher market share as brands seek differentiation in delivery technologies.

From 2020 to 2024, the Global Heating Agents Market grew steadily as sensory actives became a core differentiator in personal care and wellness formulations. During this period, the competitive landscape was dominated by leading flavor & fragrance houses and specialty ingredient suppliers, with market leaders such as Symrise and Givaudan pushing innovations in warming sensates.

Competitive differentiation relied on intensity, sensory balance, safety profile, and regulatory compliance, while advanced delivery systems were only emerging. Encapsulation was niche, and free-form actives dominated more than 70% of formulations.

Demand for heating agents will expand to USD 906.3 million in 2025, and the revenue mix will evolve as encapsulated and pre-blended sensate systems grow to capture rising formulation needs in both premium and mass-market products.

Traditional raw material suppliers face increasing competition from formulation specialists offering advanced sensate systems tailored to end-use applications. Major suppliers are shifting from pure chemistry innovation toward integrated sensorial platforms that combine heating, cooling, and tingling actives in synergistic blends. The competitive advantage is moving beyond ingredient availability to expertise in controlled release, multifunctional claims, and consumer experience delivery.

Why the Global Heating Agents Market is growing?

Advances in thermo-sensory actives have enhanced product performance, enabling consistent warming sensations across diverse applications such as lip plumpers, body slimming gels, muscle recovery balms, and scalp stimulants.

Vanillyl ether derivatives have become the leading chemistry due to their reliable warming intensity, safety record, and compatibility with both leave-on and rinse-off formulations. Long-lasting warming agents are gaining adoption as consumers increasingly prefer products with extended efficacy, especially in sports recovery and professional spa categories.

The market is also expanding due to the evolution of delivery systems. Free-form actives continue to dominate due to cost efficiency and ease of formulation, but encapsulated and bead formats are seeing rapid growth as they provide controlled release, enhanced stability, and differentiation in premium products. This trend is aligned with the rise of dermocosmetics and professional-grade formulations.

Asia-Pacific is leading growth, particularly India and China, where rising disposable incomes, demand for sensorial beauty products, and rapid uptake in hair and body care drive double-digit CAGRs. North America and Europe remain mature but stable markets, where innovation in spa therapies, sustainable raw materials, and regulatory compliance drive steady demand.

Segmental Analysis

The market is segmented by chemistry, functional mechanism, delivery system, physical form, application, end use, and region. Chemistry segmentation covers vanillyl ether derivatives, capsaicinoids, gingerol/zingiber derivatives, and nicotinate esters, highlighting the sensory diversity of heating actives. Functional mechanisms include immediate warming, long-lasting warming, and thermo-sensory blends that provide varied temporal effects.

Delivery systems encompass free form, encapsulated, and pre-blended sensate systems, reflecting technological advancement in active delivery. Physical forms include solution/concentrate, powder, and beads/encapsulates for different formulation compatibilities. Applications span lip plumpers, body slimming and massage gels, muscle warming balms, and scalp stimulating tonics.

End use sectors comprise personal care, professional spa and sports topicals, and dermocosmetic applications. Regionally, the scope spans North America, Europe, East Asia, South Asia & Pacific, Latin America, and the Middle East & Africa.
Insights into the Chemistry Segment with Vanillyl Ether Derivatives (VBE) Leading in Market Share

Heating Agents Market By Chemistry

Chemistry Value Share % 2025
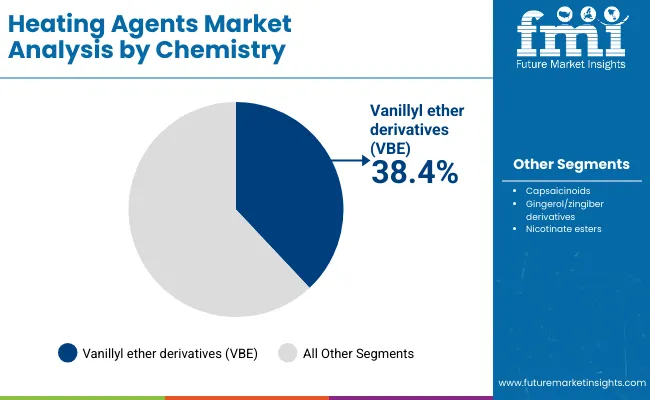
Vanillyl ether derivatives (VBE) 38.4%
Others 61.6%

The vanillyl ether derivatives (VBE) segment is projected to contribute 38.4% of the Global Heating Agents Market revenue in 2025, maintaining its lead as the dominant chemistry category. This leadership is attributed to VBE’s reliable warming intensity, safety profile, and versatility across multiple applications ranging from lip plumpers to muscle balms. The stability and consistent performance of VBE in both rinse-off and leave-on formulations make it highly preferred by formulators targeting predictable consumer experiences.

The segment’s growth is further reinforced by regulatory acceptance and its ability to provide uniform warming without causing irritation at controlled dosages. In addition, ongoing product innovation in personal care and spa products increasingly highlights VBE as a trusted active. As consumer demand for sensorial cosmetics expands, VBE is expected to remain the chemistry backbone of the Heating Agents Market through 2035.
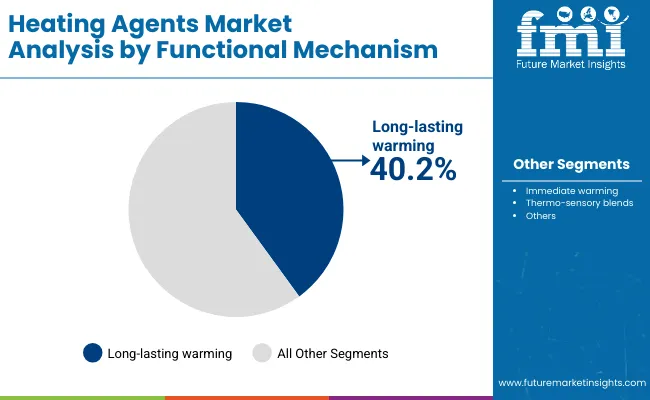
Insights into the Functional Mechanism Segment with Long-lasting Warming Dominating the Demand

Heating Agents Market By Functional Mechanism

Functional Mechanism Value Share % 2025
Long-lasting warming 40.2%
Others 59.8%

The long-lasting warming segment is forecasted to hold 40.2% of the market share in 2025, reflecting its rising importance in applications where sustained efficacy drives product differentiation. Consumers increasingly seek prolonged warming effects in slimming gels, recovery balms, and professional spa treatments, making this functional mechanism critical for premium positioning.

Formulators leverage long-lasting warming actives to align with claims such as extended muscle relaxation, enduring lip plumping, and lasting scalp stimulation. The segment’s expansion is further enabled by technological innovations in controlled-release systems that enhance durability without compromising comfort. With the ongoing shift toward products that deliver experiential and lasting benefits, the long-lasting warming segment is expected to retain its dominance across multiple application areas.
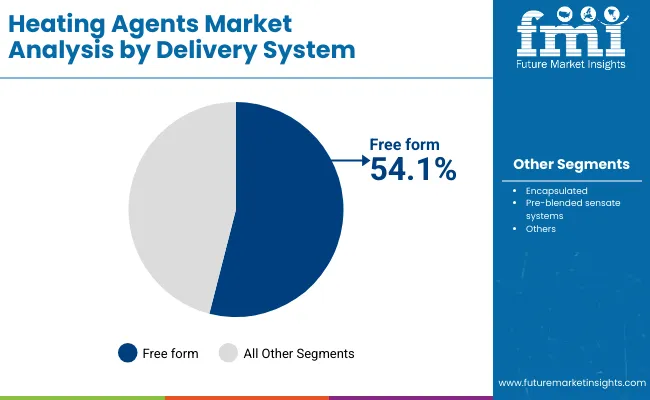
Insights into the Delivery System Segment with Free Form Leading in Market Share

Heating Agents Market By Delivery System

Delivery System Value Share % 2025
Free form 54.1%
Others 45.9%

The free-form delivery system segment is projected to contribute 54.1% of the Global Heating Agents Market revenue in 2025, making it the leading mode of incorporation. Its dominance stems from simplicity, cost-effectiveness, and ease of blending into diverse cosmetic and personal care formulations. Free-form actives offer manufacturers flexibility in formulation development while reducing production complexities

This segment continues to gain traction as it is widely compatible with creams, gels, oils, and serums used across personal care and professional spa applications. Although encapsulated and pre-blended systems are growing, free-form delivery remains the most accessible format for mainstream brands and mass-market launches. Its sustained adoption is supported by its affordability and established familiarity in the industry, ensuring that free form remains the preferred delivery system in the near term.

What are the Drivers, Restraints, and Key Trends of the Global Heating Agents Market?

Drivers

Growing Demand for Sensorial Cosmetics in Emerging Economies

In markets like China and India, double-digit growth (12-14% CAGR) in heating agents is fueled by rising disposable incomes and a preference for experiential beauty and wellness products. Consumers increasingly associate warming sensations with efficacy in lip plumpers, slimming gels, and spa treatments. Local brands in Asia-Pacific are aggressively formulating with warming actives to differentiate themselves, boosting demand for vanillyl ether derivatives and sensate blends.

Shift Toward Long-lasting and Controlled-release Formulations

The functional mechanism segment highlights that long-lasting warming already accounts for 40.2% of global share. This is being reinforced by the adoption of encapsulated delivery systems, which offer stability, reduce irritation risks, and provide sustained heating effects. Demand is especially strong in professional spa and sports recovery topicals, where consumers expect prolonged performance. This driver is pushing suppliers to invest in encapsulation technologies and sensate system innovations.

Restraints

Skin Sensitivity and Regulatory Limitations

Heating actives, particularly capsaicinoids and nicotinate esters, are prone to causing irritation or redness at higher dosages. Strict safety thresholds limit their inclusion levels, restricting flexibility for formulators. Regulatory oversight in markets such as Europe also requires extensive testing, which increases time-to-market and deters experimentation with newer chemistries.

High Cost of Advanced Delivery Systems

While encapsulated and bead-based heating actives are gaining traction, their production costs remain significantly higher than free-form alternatives. This restricts adoption in mass-market products, where price sensitivity is high. As a result, encapsulated delivery is still concentrated in premium dermocosmetics and spa lines, slowing its wider penetration despite its performance benefits.

Key Trends

Rise of Thermo-sensory Blends Combining Heating, Cooling, and Tingling

Brands are increasingly experimenting with sensate blends that combine heating actives with cooling agents (like menthol) or tingling molecules to deliver layered consumer experiences. These blends are trending in lip care, scalp stimulants, and sports topicals, where multi-sensory effects enhance product appeal and brand differentiation.

Integration of Heating Agents into Scalp and Haircare Formulations

Scalp-stimulating tonics are emerging as a high-growth niche application, particularly in East Asia. Heating actives are being marketed as circulation-boosting ingredients that support scalp health and hair growth. With rising consumer interest in holistic hair wellness, this trend is set to create a strong pull for controlled and mild warming actives that deliver efficacy without irritation.
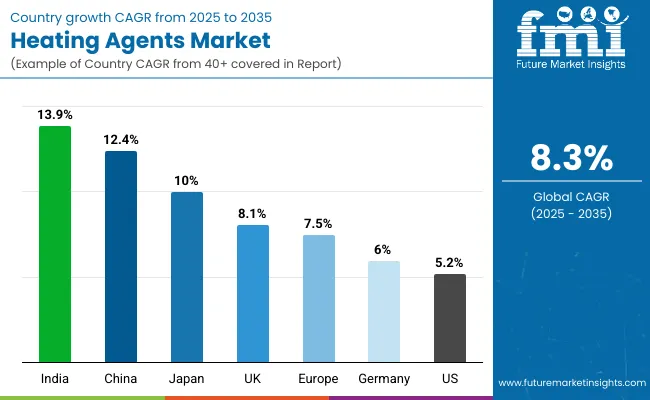
Analysis of Global Heating Agents Market By Key Countries

Heating Agents Market Country Wise Analysis

Country Estimated CAGR (2025 to 2035)
China 12.4%
USA 5.2%
India 13.9%
UK 8.1%
Germany 6.0%
Japan 10.0%
Europe 7.5%

Asia is emerging as the fastest-growing region in the Global Heating Agents Market, led by India with an impressive CAGR of 13.9% and China at 12.4% between 2025 and 2035. Rising disposable incomes, expanding middle-class populations, and increased awareness of premium beauty and wellness products are fueling demand for sensorial actives.

In India, the popularity of body slimming gels, scalp stimulants, and lip plumpers is surging as consumers seek multifunctional cosmetics with visible effects. China, on the other hand, benefits from its large beauty market and the rapid uptake of professional spa and dermocosmetic formulations. Japan also demonstrates strong momentum with a CAGR of 10.0%, supported by innovation-driven consumer preferences and the integration of warming agents in scalp and anti-aging care. These Asian markets together are reshaping the growth trajectory of the global industry.

In contrast, mature markets such as the USA and Europe are expanding at a steadier pace, with the USA recording a CAGR of 5.2% and Europe averaging 7.5%. The USA remains the single-largest contributor in value terms due to its established personal care and wellness industries, though its growth is relatively moderate compared to Asia.

Europe is supported by key countries like Germany (6.0%) and the UK (8.1%), where dermocosmetic and spa-grade formulations continue to drive adoption. These markets are more regulated, with emphasis on safety and efficacy, favoring ingredients like vanillyl ether derivatives that deliver consistent warming without irritation. While growth rates are slower than Asia, North America and Europe will remain essential for high-value, premium formulations that shape global innovation trends.
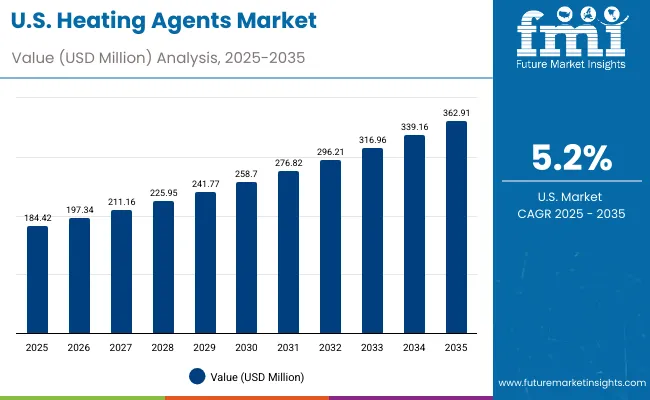
Sales Outlook for Heating Agents in the United States

Usa Heating Agents Market

Year USA Heating Agents Market (Thermo-sensory Actives) Market (USD Million)
2025 184.42
2026 197.34
2027 211.16
2028 225.95
2029 241.77
2030 258.70
2031 276.82
2032 296.21
2033 316.96
2034 339.16
2035 362.91

The Heating Agents Market in the United States is projected to grow at a CAGR of 5.2%, led by rising demand in personal care and sports recovery formulations. Vanillyl ether derivatives (VBE) account for over 35% of the USA market, supported by strong adoption in lip plumpers, slimming gels, and spa-grade massage products.

Professional athletes and fitness enthusiasts are driving steady uptake of muscle-warming balms, while dermocosmetic brands are formulating long-lasting warming agents to enhance consumer perception of product efficacy. Although the USA growth rate is moderate compared to Asia, its value base remains the largest, providing a strong platform for premium product innovation.

  • Lip plumpers and body-slimming gels dominate VBE usage in personal care.
  • Sports recovery balms are driving demand in professional and consumer wellness.
  • Dermocosmetic brands are favoring long-lasting warming actives for premium claims.

Growth and Expansion Outlook for Heating Agents Market in the United Kingdom

The Heating Agents Market in the United Kingdom is expected to grow at a CAGR of 8.1%, supported by innovation in spa-grade formulations, dermocosmetics, and professional massage products. The UK consumer base values efficacy and safety, with long-lasting warming agents and encapsulated delivery systems gaining popularity for sustained effects and reduced irritation.

High-end salons and spas are driving adoption of warming sensates in treatments that combine circulation-boosting and relaxation benefits. Meanwhile, dermocosmetic firms are introducing scalp-stimulating tonics and advanced warming serums targeting niche consumer needs.

  • Premium spa and massage brands are driving demand for encapsulated warming actives.
  • Dermocosmetic launches emphasize scalp stimulation and long-lasting efficacy.
  • Consumers are gravitating toward safe, regulated sensates with extended warming profiles.

Growth and Expansion Outlook for Heating Agents Market in India

India is witnessing rapid growth in the Heating Agents Market, which is forecast to expand at a CAGR of 13.9% through 2035, the fastest among leading economies. A surge in demand for body-slimming and toning gels, scalp-stimulating formulations, and wellness products is driving market penetration beyond metro cities into tier-2 and tier-3 regions.

Rising disposable incomes and increasing adoption of beauty and personal care routines are propelling usage in both mass-market and premium product categories. MSMEs are actively formulating with vanillyl ether derivatives and sensate blends to meet local preferences, while multinational firms are targeting India with tailored launches in warming cosmetics.
  • Slimming gels and tonics are surging in demand across urban and tier-2 cities.
  • MSMEs are formulating cost-effective products with vanillyl ether derivatives.
  • Rising consumer awareness is fueling adoption in both premium and mass-market categories.

Sales Outlook for Heating Agents in China

China Heating Agents Market

The Heating Agents Market in China is expected to grow at a CAGR of 12.4%, one of the highest among major economies. This momentum is fueled by the strong uptake of long-lasting warming agents, which already hold 32.8% share of the Chinese market, and rising demand for professional spa and dermocosmetic products. Chinese consumers are increasingly drawn to multifunctional sensorial products that combine warmth with visible efficacy claims, such as circulation-boosting scalp tonics and anti-aging serums. Local beauty brands are competing aggressively with international players, driving innovation in encapsulated delivery and thermo-sensory blends tailored for sensitive skin.

  • Long-lasting warming agents dominate spa and professional wellness formulations.
  • Scalp and haircare products are emerging as high-growth application areas.
  • Domestic brands are driving adoption through competitive pricing and fast innovation.
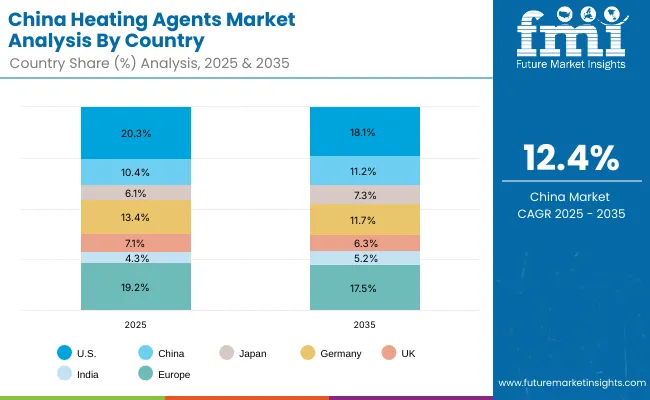
Country 2025 Share (%)
USA 20.3%
China 10.4%
Japan 6.1%
Germany 13.4%
UK 7.1%
India 4.3%
Europe 19.2%
Country 2035 Share (%)
USA 18.1%
China 11.2%
Japan 7.3%
Germany 11.7%
UK 6.3%
India 5.2%
Europe 17.5%

Growth Outlook for Heating Agents Market in the United States

Usa Heating Agents Market By Chemistry

Value Share % 2025 USA By Chemistry
Vanillyl ether derivatives (VBE) 35.1%
Others 64.9%

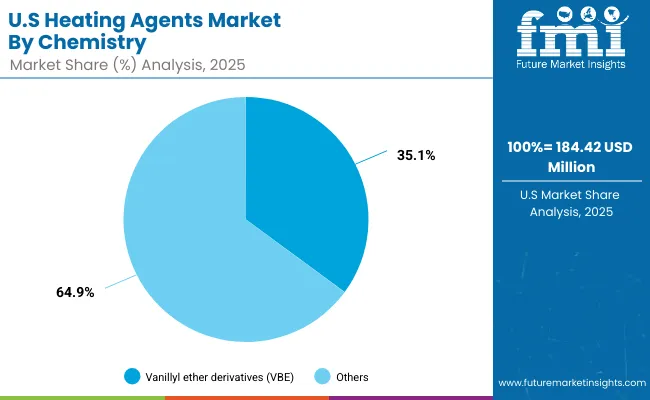
The Heating Agents Market in the United States is projected at USD 184.42 million in 2025. Vanillyl ether derivatives contribute 35.1%, while other chemistries, including capsaicinoids and gingerol derivatives, make up the remaining 64.9%.

This highlights the continuing dominance of VBE as the safest and most versatile option for personal care and dermocosmetic formulations. Its stable warming effect and controlled irritation profile give it an edge over more aggressive heating actives, especially under stringent USA regulatory oversight.

The strong presence of spa and sports recovery applications supports the demand for warming balms, while lip plumpers and body-slimming products maintain steady adoption in the personal care segment. Dermocosmetic brands are increasingly exploring encapsulated systems to enhance performance, but cost-sensitive mainstream products continue to rely on free-form VBE solutions. While the overall growth rate is moderate at 5.2% CAGR, the USA remains a high-value market that rewards ingredient suppliers offering safety-compliant, performance-driven warming actives.
  • USA holds a 20.3% share of the global market in 2025.
  • Vanillyl ether derivatives (VBE) dominate with 35.1% share in USA chemistry usage.
  • Growth is supported by sports recovery balms, slimming products, and dermocosmetic innovation.

Growth Outlook for Heating Agents Market in China

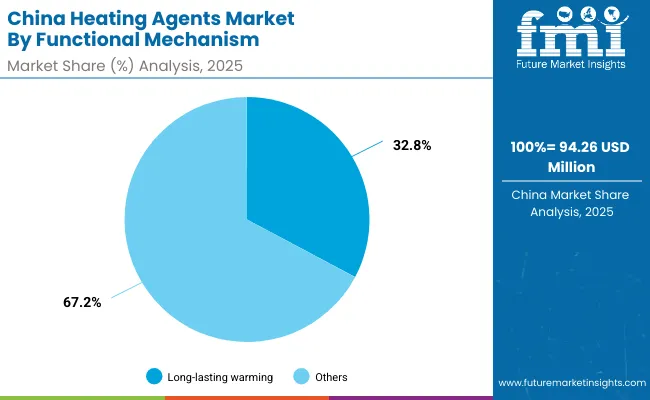
China Heating Agents Market By Functional Mechanism

China By Functional Mechanism Value Share % 2025
Long-lasting warming 32.8%
Others 67.2%

The Heating Agents Market in China is projected at USD 94.26 million in 2025, with long-lasting warming agents contributing 32.8%. This reflects Chinese consumers’ preference for efficacy-oriented cosmetics and wellness solutions, where extended heating effects are perceived as superior in performance. The rising adoption of thermo-sensory blends in professional spa therapies and dermocosmetic scalp treatments highlights how local demand is shifting toward multifunctional, long-duration experiences.

China’s growth outlook is exceptionally strong, with a forecast CAGR of 12.4%, driven by urban wellness trends, premium product adoption, and innovation from both domestic and global suppliers. Encapsulated and pre-blended sensate systems are gaining traction, especially in premium product lines, while free-form agents continue to dominate mass-market formulations. Competitive innovation by local firms focusing on affordability and rapid scaling is further accelerating adoption across personal care, haircare, and body treatment categories.
  • China holds a 10.4% share of the global market in 2025.
  • Long-lasting warming dominates with 32.8% share of the Chinese market.
  • Growth is driven by spa therapies, scalp stimulants, and premium dermocosmetic products.

Competitive Landscape of the Global Heating Agents Market

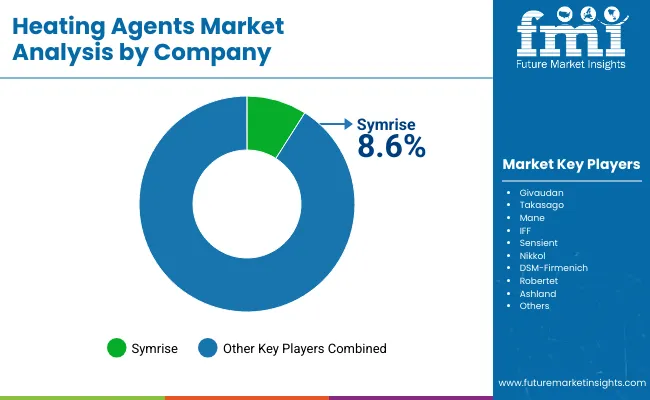
Heating Agents Market By Company

Company Global Value Share 2025
Symrise 8.6%
Others 91.4%

The Global Heating Agents Market is moderately concentrated, with leading fragrance & flavor houses and specialty ingredient suppliers competing to capture demand across personal care, spa, and dermocosmetic applications.

Symrise holds the highest individual share at 8.6%, reflecting its strong portfolio of sensorial actives and integrated delivery solutions. Other global leaders such as Givaudan, Takasago, IFF, and Mane are also active in the space, leveraging their expertise in sensates and multifunctional cosmetic ingredients.

Mid-sized innovators, including Sensient, Nikkol, and Robertet, are strengthening their presence with cost-effective warming agents and regional customization strategies. DSM-Firmenich and Ashland are focusing on broader dermocosmetic and wellness applications, integrating heating actives with multifunctional systems that enhance efficacy, stability, and consumer appeal.

Competitive differentiation is moving away from pure chemistry toward ecosystem-driven offerings, where delivery technology, controlled release, and sensate blends (heating + cooling + tingling) define long-term success. Companies that can combine regulatory compliance, safety assurance, and advanced delivery systems are expected to capture greater market share in the coming decade.

Key Developments in Global Heating Agents Market

  • On 2 February 2025, Symrise introduced Optacool® Fuji, an advanced cooling substance for oral care. While this is about cooling rather than heating, the sensory innovation here is relevant: it shows the company’s R&D focus on refined sensorial actives, rapid onset sensations, and prolonged sensory effects. Such capability likely projects into their heating actives work as well.
  • On 4 October 2024, Givaudan & Privi (via their joint venture Prigiv) commenced operations at a new Mahad Fragrance Ingredients facility in India. Though facility is described in broader fragrance ingredient context, part of its remit includes complex synthetic chemistries used for sensorial and functional agents, which could support future or current supply of heating actives (premium or mass‐market)

Scope of the Report

Item Value
Quantitative Units USD Million
Chemistry Vanillyl ether derivatives (VBE), Capsaicinoids, Gingerol / zingiber derivatives, and Nicotinate esters
Functional Mechanism Immediate warming, Long-lasting warming, and Thermo-sensory blends
Delivery System Free form, Encapsulated, and Pre-blended sensate systems
Physical Form Solution/concentrate, Powder, and Beads/encapsulates
Application Lip plumpers, Body slimming & massage gels, Muscle warming balms, and Scalp stimulating tonics
End Use Personal care, Professional spa/sports topicals, and Dermocosmetic
Regions Covered North America, Europe, East Asia, South Asia & Pacific, Latin America, Middle East & Africa
Countries Covered United States, Canada, Germany, France, United Kingdom, China, Japan, India, Brazil, South Africa
Key Companies Profiled Symrise, Givaudan, Takasago, Mane, IFF, Sensient, Nikkol, DSM- Firmenich, Robertet, Ashland
Additional Attributes Dollar sales by chemistry, functional mechanism, and delivery system; adoption trends in dermocosmetics and spa therapies; rising demand for long-lasting and encapsulated actives; sector-specific growth in personal care, haircare, and slimming products; integration with multi-sensory blends (warming + cooling + tingling); regional trends driven by beauty & wellness demand in Asia-Pacific; innovations in safe and irritation-free warming actives such as next-gen VBE derivatives and bead encapsulation systems.

Key Segments

By Chemistry:

  • Vanillyl ether derivatives (VBE)
  • Capsaicinoids
  • Gingerol / zingiber derivatives
  • Nicotinate esters

By Functional Mechanism:

  • Immediate warming
  • Long-lasting warming
  • Thermo-sensory blends
  • Fatty alcohol combinations

By Delivery System:

  • Free form
  • Encapsulated
  • Pre-blended sensate systems

By Physical Form:

  • Solution / concentrate
  • Powder
  • Beads / encapsulates

By Application:

  • Lip plumpers
  • Body slimming & massage gels
  • Muscle warming balms
  • Scalp stimulating tonics

By End Use:

  • Personal care
  • Professional spa / sports topicals
  • Dermocosmetic

By Region:

  • North America
  • Latin America
  • Europe
  • East Asia
  • South Asia & Pacific
  • Middle East and Africa

Table of Content

  1. Executive Summary
    • Global Market Outlook
    • Demand-side Trends
    • Supply-side Trends
    • Technology Roadmap Analysis
    • Analysis and Recommendations
  2. Market Overview
    • Market Coverage / Taxonomy
    • Market Definition / Scope / Limitations
  3. Market Background
    • Market Dynamics
      • Drivers
      • Restraints
      • Opportunity
      • Trends
    • Scenario Forecast
      • Demand in Optimistic Scenario
      • Demand in Likely Scenario
      • Demand in Conservative Scenario
    • Opportunity Map Analysis
    • Product Life Cycle Analysis
    • Supply Chain Analysis
      • Supply Side Participants and their Roles
        • Producers
        • Mid-Level Participants (Traders/ Agents/ Brokers)
        • Wholesalers and Distributors
      • Value Added and Value Created at Node in the Supply Chain
      • List of Raw Material Suppliers
      • List of Existing and Potential Buyer’s
    • Investment Feasibility Matrix
    • Value Chain Analysis
      • Profit Margin Analysis
      • Wholesalers and Distributors
      • Retailers
    • PESTLE and Porter’s Analysis
    • Regulatory Landscape
      • By Key Regions
      • By Key Countries
    • Regional Parent Market Outlook
    • Production and Consumption Statistics
    • Import and Export Statistics
  4. Global Analysis 2020 to 2024 and Forecast, 2025 to 2035
    • Historical Market Size Value (USD Million) & Volume (Units) Analysis, 2020 to 2024
    • Current and Future Market Size Value (USD Million) & Volume (Units) Projections, 2025 to 2035
      • Y-o-Y Growth Trend Analysis
      • Absolute $ Opportunity Analysis
  5. Global Analysis 2020 to 2024 and Forecast 2025 to 2035, By Chemistry
    • Introduction / Key Findings
    • Historical Market Size Value (USD Million) & Volume (Units) Analysis By Chemistry, 2020 to 2024
    • Current and Future Market Size Value (USD Million) & Volume (Units) Analysis and Forecast By Chemistry, 2025 to 2035
      • Vanillyl ether derivatives (VBE)
      • Capsaicinoids
      • Gingerol/zingiber derivatives
      • Nicotinate esters
    • Y-o-Y Growth Trend Analysis By Chemistry, 2020 to 2024
    • Absolute $ Opportunity Analysis By Chemistry, 2025 to 2035
  6. Global Analysis 2020 to 2024 and Forecast 2025 to 2035, By Functional Mechanism
    • Introduction / Key Findings
    • Historical Market Size Value (USD Million) & Volume (Units) Analysis By Functional Mechanism, 2020 to 2024
    • Current and Future Market Size Value (USD Million) & Volume (Units) Analysis and Forecast By Functional Mechanism, 2025 to 2035
      • Immediate warming
      • Long-lasting warming
      • Thermo-sensory blends
      • Fatty alcohol combinations
    • Y-o-Y Growth Trend Analysis By Functional Mechanism, 2020 to 2024
    • Absolute $ Opportunity Analysis By Functional Mechanism, 2025 to 2035
  7. Global Analysis 2020 to 2024 and Forecast 2025 to 2035, By Delivery System
    • Introduction / Key Findings
    • Historical Market Size Value (USD Million) & Volume (Units) Analysis By Delivery System, 2020 to 2024
    • Current and Future Market Size Value (USD Million) & Volume (Units) Analysis and Forecast By Delivery System, 2025 to 2035
      • Free form
      • Encapsulated
      • Pre-blended sensate systems
    • Y-o-Y Growth Trend Analysis By Delivery System, 2020 to 2024
    • Absolute $ Opportunity Analysis By Delivery System, 2025 to 2035
  8. Global Analysis 2020 to 2024 and Forecast 2025 to 2035, By Physical Form
    • Introduction / Key Findings
    • Historical Market Size Value (USD Million) & Volume (Units) Analysis By Physical Form, 2020 to 2024
    • Current and Future Market Size Value (USD Million) & Volume (Units) Analysis and Forecast By Physical Form, 2025 to 2035
      • Solution/concentrate
      • Powder
      • Beads/encapsulates
    • Y-o-Y Growth Trend Analysis By Physical Form, 2020 to 2024
    • Absolute $ Opportunity Analysis By Physical Form, 2025 to 2035
  9. Global Analysis 2020 to 2024 and Forecast 2025 to 2035, By Application
    • Introduction / Key Findings
    • Historical Market Size Value (USD Million) & Volume (Units) Analysis By Application, 2020 to 2024
    • Current and Future Market Size Value (USD Million) & Volume (Units) Analysis and Forecast By Application, 2025 to 2035
      • Lip plumpers
      • Body slimming & massage gels
      • Muscle warming balms
      • Scalp stimulating tonics
    • Y-o-Y Growth Trend Analysis By Application, 2020 to 2024
    • Absolute $ Opportunity Analysis By Application, 2025 to 2035
  10. Global Analysis 2020 to 2024 and Forecast 2025 to 2035, By End Use
    • Introduction / Key Findings
    • Historical Market Size Value (USD Million) & Volume (Units) Analysis By End Use, 2020 to 2024
    • Current and Future Market Size Value (USD Million) & Volume (Units) Analysis and Forecast By End Use, 2025 to 2035
      • Personal care
      • Professional spa/sports topicals
      • Dermocosmetic
    • Y-o-Y Growth Trend Analysis By End Use, 2020 to 2024
    • Absolute $ Opportunity Analysis By End Use, 2025 to 2035
  11. Global Analysis 2020 to 2024 and Forecast 2025 to 2035, By Region
    • Introduction
    • Historical Market Size Value (USD Million) & Volume (Units) Analysis By Region, 2020 to 2024
    • Current Market Size Value (USD Million) & Volume (Units) Analysis and Forecast By Region, 2025 to 2035
      • North America
      • Latin America
      • Europe
      • East Asia
      • South Asia & Pacific
      • Middle East and Africa
    • Market Attractiveness Analysis By Region
  12. North America Analysis 2020 to 2024 and Forecast 2025 to 2035, By Country
    • Historical Market Size Value (USD Million) & Volume (Units) Trend Analysis By Market Taxonomy, 2020 to 2024
    • Market Size Value (USD Million) & Volume (Units) Forecast By Market Taxonomy, 2025 to 2035
      • By Country
        • USA
        • Canada
      • By Chemistry
      • By Functional Mechanism
      • By Delivery System
      • By Physical Form
      • By Application
      • By End Use
    • Market Attractiveness Analysis
      • By Country
      • By Chemistry
      • By Functional Mechanism
      • By Delivery System
      • By Physical Form
      • By Application
      • By End Use
    • Key Takeaways
  13. Latin America Analysis 2020 to 2024 and Forecast 2025 to 2035, By Country
    • Historical Market Size Value (USD Million) & Volume (Units) Trend Analysis By Market Taxonomy, 2020 to 2024
    • Market Size Value (USD Million) & Volume (Units) Forecast By Market Taxonomy, 2025 to 2035
      • By Country
        • Brazil
        • Mexico
        • Colombia
        • Rest of Latin America
      • By Chemistry
      • By Functional Mechanism
      • By Delivery System
      • By Physical Form
      • By Application
      • By End Use
    • Market Attractiveness Analysis
      • By Country
      • By Chemistry
      • By Functional Mechanism
      • By Delivery System
      • By Physical Form
      • By Application
      • By End Use
    • Key Takeaways
  14. Europe Analysis 2020 to 2024 and Forecast 2025 to 2035, By Country
    • Historical Market Size Value (USD Million) & Volume (Units) Trend Analysis By Market Taxonomy, 2020 to 2024
    • Market Size Value (USD Million) & Volume (Units) Forecast By Market Taxonomy, 2025 to 2035
      • By Country
        • Germany
        • UK
        • France
        • Italy
        • Spain
        • Belgium
        • Netherlands
        • Nordic
        • Switzerland
        • Russia
        • Poland
        • Rest of Europe
      • By Chemistry
      • By Functional Mechanism
      • By Delivery System
      • By Physical Form
      • By Application
      • By End Use
    • Market Attractiveness Analysis
      • By Country
      • By Chemistry
      • By Functional Mechanism
      • By Delivery System
      • By Physical Form
      • By Application
      • By End Use
    • Key Takeaways
  15. East Asia Analysis 2020 to 2024 and Forecast 2025 to 2035, By Country
    • Historical Market Size Value (USD Million) & Volume (Units) Trend Analysis By Market Taxonomy, 2020 to 2024
    • Market Size Value (USD Million) & Volume (Units) Forecast By Market Taxonomy, 2025 to 2035
      • By Country
        • China
        • Japan
        • South Korea
      • By Chemistry
      • By Functional Mechanism
      • By Delivery System
      • By Physical Form
      • By Application
      • By End Use
    • Market Attractiveness Analysis
      • By Country
      • By Chemistry
      • By Functional Mechanism
      • By Delivery System
      • By Physical Form
      • By Application
      • By End Use
    • Key Takeaways
  16. South Asia & Pacific Analysis 2020 to 2024 and Forecast 2025 to 2035, By Country
    • Historical Market Size Value (USD Million) & Volume (Units) Trend Analysis By Market Taxonomy, 2020 to 2024
    • Market Size Value (USD Million) & Volume (Units) Forecast By Market Taxonomy, 2025 to 2035
      • By Country
        • India
        • Thailand
        • Malaysia
        • Indonesia
        • Singapore
        • Vietnam
        • Australia
        • New Zealand
        • Rest of South Asia
      • By Chemistry
      • By Functional Mechanism
      • By Delivery System
      • By Physical Form
      • By Application
      • By End Use
    • Market Attractiveness Analysis
      • By Country
      • By Chemistry
      • By Functional Mechanism
      • By Delivery System
      • By Physical Form
      • By Application
      • By End Use
    • Key Takeaways
  17. Middle East and Africa Analysis 2020 to 2024 and Forecast 2025 to 2035, By Country
    • Historical Market Size Value (USD Million) & Volume (Units) Trend Analysis By Market Taxonomy, 2020 to 2024
    • Market Size Value (USD Million) & Volume (Units) Forecast By Market Taxonomy, 2025 to 2035
      • By Country
        • Turkey
        • UAE
        • Saudi Arabia
        • Israel
        • Other GCC Countries
        • North Africa
        • South Africa
      • By Chemistry
      • By Functional Mechanism
      • By Delivery System
      • By Physical Form
      • By Application
      • By End Use
    • Market Attractiveness Analysis
      • By Country
      • By Chemistry
      • By Functional Mechanism
      • By Delivery System
      • By Physical Form
      • By Application
      • By End Use
    • Key Takeaways
  18. Key Countries Analysis
    • USA
      • Pricing Analysis
      • Market Share Analysis, 2024
        • By Chemistry
        • By Functional Mechanism
        • By Delivery System
        • By Physical Form
        • By Application
        • By End Use
    • Canada
      • Pricing Analysis
      • Market Share Analysis, 2024
        • By Chemistry
        • By Functional Mechanism
        • By Delivery System
        • By Physical Form
        • By Application
        • By End Use
    • Brazil
      • Pricing Analysis
      • Market Share Analysis, 2024
        • By Chemistry
        • By Functional Mechanism
        • By Delivery System
        • By Physical Form
        • By Application
        • By End Use
    • Mexico
      • Pricing Analysis
      • Market Share Analysis, 2024
        • By Chemistry
        • By Functional Mechanism
        • By Delivery System
        • By Physical Form
        • By Application
        • By End Use
    • Colombia
      • Pricing Analysis
      • Market Share Analysis, 2024
        • By Chemistry
        • By Functional Mechanism
        • By Delivery System
        • By Physical Form
        • By Application
        • By End Use
    • Germany
      • Pricing Analysis
      • Market Share Analysis, 2024
        • By Chemistry
        • By Functional Mechanism
        • By Delivery System
        • By Physical Form
        • By Application
        • By End Use
    • UK
      • Pricing Analysis
      • Market Share Analysis, 2024
        • By Chemistry
        • By Functional Mechanism
        • By Delivery System
        • By Physical Form
        • By Application
        • By End Use
    • France
      • Pricing Analysis
      • Market Share Analysis, 2024
        • By Chemistry
        • By Functional Mechanism
        • By Delivery System
        • By Physical Form
        • By Application
        • By End Use
    • Italy
      • Pricing Analysis
      • Market Share Analysis, 2024
        • By Chemistry
        • By Functional Mechanism
        • By Delivery System
        • By Physical Form
        • By Application
        • By End Use
    • Spain
      • Pricing Analysis
      • Market Share Analysis, 2024
        • By Chemistry
        • By Functional Mechanism
        • By Delivery System
        • By Physical Form
        • By Application
        • By End Use
    • Belgium
      • Pricing Analysis
      • Market Share Analysis, 2024
        • By Chemistry
        • By Functional Mechanism
        • By Delivery System
        • By Physical Form
        • By Application
        • By End Use
    • Netherlands
      • Pricing Analysis
      • Market Share Analysis, 2024
        • By Chemistry
        • By Functional Mechanism
        • By Delivery System
        • By Physical Form
        • By Application
        • By End Use
    • Nordic
      • Pricing Analysis
      • Market Share Analysis, 2024
        • By Chemistry
        • By Functional Mechanism
        • By Delivery System
        • By Physical Form
        • By Application
        • By End Use
    • Switzerland
      • Pricing Analysis
      • Market Share Analysis, 2024
        • By Chemistry
        • By Functional Mechanism
        • By Delivery System
        • By Physical Form
        • By Application
        • By End Use
    • Russia
      • Pricing Analysis
      • Market Share Analysis, 2024
        • By Chemistry
        • By Functional Mechanism
        • By Delivery System
        • By Physical Form
        • By Application
        • By End Use
    • Poland
      • Pricing Analysis
      • Market Share Analysis, 2024
        • By Chemistry
        • By Functional Mechanism
        • By Delivery System
        • By Physical Form
        • By Application
        • By End Use
    • China
      • Pricing Analysis
      • Market Share Analysis, 2024
        • By Chemistry
        • By Functional Mechanism
        • By Delivery System
        • By Physical Form
        • By Application
        • By End Use
    • Japan
      • Pricing Analysis
      • Market Share Analysis, 2024
        • By Chemistry
        • By Functional Mechanism
        • By Delivery System
        • By Physical Form
        • By Application
        • By End Use
    • South Korea
      • Pricing Analysis
      • Market Share Analysis, 2024
        • By Chemistry
        • By Functional Mechanism
        • By Delivery System
        • By Physical Form
        • By Application
        • By End Use
    • India
      • Pricing Analysis
      • Market Share Analysis, 2024
        • By Chemistry
        • By Functional Mechanism
        • By Delivery System
        • By Physical Form
        • By Application
        • By End Use
    • Thailand
      • Pricing Analysis
      • Market Share Analysis, 2024
        • By Chemistry
        • By Functional Mechanism
        • By Delivery System
        • By Physical Form
        • By Application
        • By End Use
    • Indonesia
      • Pricing Analysis
      • Market Share Analysis, 2024
        • By Chemistry
        • By Functional Mechanism
        • By Delivery System
        • By Physical Form
        • By Application
        • By End Use
    • Australia
      • Pricing Analysis
      • Market Share Analysis, 2024
        • By Chemistry
        • By Functional Mechanism
        • By Delivery System
        • By Physical Form
        • By Application
        • By End Use
    • New Zealand
      • Pricing Analysis
      • Market Share Analysis, 2024
        • By Chemistry
        • By Functional Mechanism
        • By Delivery System
        • By Physical Form
        • By Application
        • By End Use
    • Turkey
      • Pricing Analysis
      • Market Share Analysis, 2024
        • By Chemistry
        • By Functional Mechanism
        • By Delivery System
        • By Physical Form
        • By Application
        • By End Use
    • UAE
      • Pricing Analysis
      • Market Share Analysis, 2024
        • By Chemistry
        • By Functional Mechanism
        • By Delivery System
        • By Physical Form
        • By Application
        • By End Use
    • Saudi Arabia
      • Pricing Analysis
      • Market Share Analysis, 2024
        • By Chemistry
        • By Functional Mechanism
        • By Delivery System
        • By Physical Form
        • By Application
        • By End Use
    • Israel
      • Pricing Analysis
      • Market Share Analysis, 2024
        • By Chemistry
        • By Functional Mechanism
        • By Delivery System
        • By Physical Form
        • By Application
        • By End Use
    • North Africa
      • Pricing Analysis
      • Market Share Analysis, 2024
        • By Chemistry
        • By Functional Mechanism
        • By Delivery System
        • By Physical Form
        • By Application
        • By End Use
    • South Africa
      • Pricing Analysis
      • Market Share Analysis, 2024
        • By Chemistry
        • By Functional Mechanism
        • By Delivery System
        • By Physical Form
        • By Application
        • By End Use
  19. Market Structure Analysis
    • Competition Dashboard
    • Competition Benchmarking
    • Market Share Analysis of Top Players
      • By Regional
      • By Chemistry
      • By Functional Mechanism
      • By Delivery System
      • By Physical Form
      • By Application
      • By End Use
  20. Competition Analysis
    • Competition Deep Dive
      • Symrise
        • Overview
        • Product Portfolio
        • Profitability by Market Segments (Product/Age /Sales Channel/Region)
        • Sales Footprint
        • Strategy Overview
          • Marketing Strategy
          • Product Strategy
          • Channel Strategy
      • Givaudan
        • Overview
        • Product Portfolio
        • Profitability by Market Segments (Product/Age /Sales Channel/Region)
        • Sales Footprint
        • Strategy Overview
          • Marketing Strategy
          • Product Strategy
          • Channel Strategy
      • Takasago
        • Overview
        • Product Portfolio
        • Profitability by Market Segments (Product/Age /Sales Channel/Region)
        • Sales Footprint
        • Strategy Overview
          • Marketing Strategy
          • Product Strategy
          • Channel Strategy
      • Mane
        • Overview
        • Product Portfolio
        • Profitability by Market Segments (Product/Age /Sales Channel/Region)
        • Sales Footprint
        • Strategy Overview
          • Marketing Strategy
          • Product Strategy
          • Channel Strategy
      • IFF
        • Overview
        • Product Portfolio
        • Profitability by Market Segments (Product/Age /Sales Channel/Region)
        • Sales Footprint
        • Strategy Overview
          • Marketing Strategy
          • Product Strategy
          • Channel Strategy
      • Sensient
        • Overview
        • Product Portfolio
        • Profitability by Market Segments (Product/Age /Sales Channel/Region)
        • Sales Footprint
        • Strategy Overview
          • Marketing Strategy
          • Product Strategy
          • Channel Strategy
      • Nikkol
        • Overview
        • Product Portfolio
        • Profitability by Market Segments (Product/Age /Sales Channel/Region)
        • Sales Footprint
        • Strategy Overview
          • Marketing Strategy
          • Product Strategy
          • Channel Strategy
      • DSM-Firmenich
        • Overview
        • Product Portfolio
        • Profitability by Market Segments (Product/Age /Sales Channel/Region)
        • Sales Footprint
        • Strategy Overview
          • Marketing Strategy
          • Product Strategy
          • Channel Strategy
      • Robertet
        • Overview
        • Product Portfolio
        • Profitability by Market Segments (Product/Age /Sales Channel/Region)
        • Sales Footprint
        • Strategy Overview
          • Marketing Strategy
          • Product Strategy
          • Channel Strategy
      • Ashland
        • Overview
        • Product Portfolio
        • Profitability by Market Segments (Product/Age /Sales Channel/Region)
        • Sales Footprint
        • Strategy Overview
          • Marketing Strategy
          • Product Strategy
          • Channel Strategy
  21. Assumptions & Acronyms Used
  22. Research Methodology

List of Tables

  • Table 1: Global Market Value (USD Million) Forecast by Region, 2020-2035
  • Table 2: Global Market Volume (Units) Forecast by Region, 2020-2035
  • Table 3: Global Market Value (USD Million) Forecast by Chemistry, 2020-2035
  • Table 4: Global Market Volume (Units) Forecast by Chemistry, 2020-2035
  • Table 5: Global Market Value (USD Million) Forecast by Functional Mechanism, 2020-2035
  • Table 6: Global Market Volume (Units) Forecast by Functional Mechanism, 2020-2035
  • Table 7: Global Market Value (USD Million) Forecast by Delivery System, 2020-2035
  • Table 8: Global Market Volume (Units) Forecast by Delivery System, 2020-2035
  • Table 9: Global Market Value (USD Million) Forecast by Physical Form, 2020-2035
  • Table 10: Global Market Volume (Units) Forecast by Physical Form, 2020-2035
  • Table 11: Global Market Value (USD Million) Forecast by Application, 2020-2035
  • Table 12: Global Market Volume (Units) Forecast by Application, 2020-2035
  • Table 13: Global Market Value (USD Million) Forecast by End Use, 2020-2035
  • Table 14: Global Market Volume (Units) Forecast by End Use, 2020-2035
  • Table 15: North America Market Value (USD Million) Forecast by Country, 2020-2035
  • Table 16: North America Market Volume (Units) Forecast by Country, 2020-2035
  • Table 17: North America Market Value (USD Million) Forecast by Chemistry, 2020-2035
  • Table 18: North America Market Volume (Units) Forecast by Chemistry, 2020-2035
  • Table 19: North America Market Value (USD Million) Forecast by Functional Mechanism, 2020-2035
  • Table 20: North America Market Volume (Units) Forecast by Functional Mechanism, 2020-2035
  • Table 21: North America Market Value (USD Million) Forecast by Delivery System, 2020-2035
  • Table 22: North America Market Volume (Units) Forecast by Delivery System, 2020-2035
  • Table 23: North America Market Value (USD Million) Forecast by Physical Form, 2020-2035
  • Table 24: North America Market Volume (Units) Forecast by Physical Form, 2020-2035
  • Table 25: North America Market Value (USD Million) Forecast by Application, 2020-2035
  • Table 26: North America Market Volume (Units) Forecast by Application, 2020-2035
  • Table 27: North America Market Value (USD Million) Forecast by End Use, 2020-2035
  • Table 28: North America Market Volume (Units) Forecast by End Use, 2020-2035
  • Table 29: Latin America Market Value (USD Million) Forecast by Country, 2020-2035
  • Table 30: Latin America Market Volume (Units) Forecast by Country, 2020-2035
  • Table 31: Latin America Market Value (USD Million) Forecast by Chemistry, 2020-2035
  • Table 32: Latin America Market Volume (Units) Forecast by Chemistry, 2020-2035
  • Table 33: Latin America Market Value (USD Million) Forecast by Functional Mechanism, 2020-2035
  • Table 34: Latin America Market Volume (Units) Forecast by Functional Mechanism, 2020-2035
  • Table 35: Latin America Market Value (USD Million) Forecast by Delivery System, 2020-2035
  • Table 36: Latin America Market Volume (Units) Forecast by Delivery System, 2020-2035
  • Table 37: Latin America Market Value (USD Million) Forecast by Physical Form, 2020-2035
  • Table 38: Latin America Market Volume (Units) Forecast by Physical Form, 2020-2035
  • Table 39: Latin America Market Value (USD Million) Forecast by Application, 2020-2035
  • Table 40: Latin America Market Volume (Units) Forecast by Application, 2020-2035
  • Table 41: Latin America Market Value (USD Million) Forecast by End Use, 2020-2035
  • Table 42: Latin America Market Volume (Units) Forecast by End Use, 2020-2035
  • Table 43: Europe Market Value (USD Million) Forecast by Country, 2020-2035
  • Table 44: Europe Market Volume (Units) Forecast by Country, 2020-2035
  • Table 45: Europe Market Value (USD Million) Forecast by Chemistry, 2020-2035
  • Table 46: Europe Market Volume (Units) Forecast by Chemistry, 2020-2035
  • Table 47: Europe Market Value (USD Million) Forecast by Functional Mechanism, 2020-2035
  • Table 48: Europe Market Volume (Units) Forecast by Functional Mechanism, 2020-2035
  • Table 49: Europe Market Value (USD Million) Forecast by Delivery System, 2020-2035
  • Table 50: Europe Market Volume (Units) Forecast by Delivery System, 2020-2035
  • Table 51: Europe Market Value (USD Million) Forecast by Physical Form, 2020-2035
  • Table 52: Europe Market Volume (Units) Forecast by Physical Form, 2020-2035
  • Table 53: Europe Market Value (USD Million) Forecast by Application, 2020-2035
  • Table 54: Europe Market Volume (Units) Forecast by Application, 2020-2035
  • Table 55: Europe Market Value (USD Million) Forecast by End Use, 2020-2035
  • Table 56: Europe Market Volume (Units) Forecast by End Use, 2020-2035
  • Table 57: East Asia Market Value (USD Million) Forecast by Country, 2020-2035
  • Table 58: East Asia Market Volume (Units) Forecast by Country, 2020-2035
  • Table 59: East Asia Market Value (USD Million) Forecast by Chemistry, 2020-2035
  • Table 60: East Asia Market Volume (Units) Forecast by Chemistry, 2020-2035
  • Table 61: East Asia Market Value (USD Million) Forecast by Functional Mechanism, 2020-2035
  • Table 62: East Asia Market Volume (Units) Forecast by Functional Mechanism, 2020-2035
  • Table 63: East Asia Market Value (USD Million) Forecast by Delivery System, 2020-2035
  • Table 64: East Asia Market Volume (Units) Forecast by Delivery System, 2020-2035
  • Table 65: East Asia Market Value (USD Million) Forecast by Physical Form, 2020-2035
  • Table 66: East Asia Market Volume (Units) Forecast by Physical Form, 2020-2035
  • Table 67: East Asia Market Value (USD Million) Forecast by Application, 2020-2035
  • Table 68: East Asia Market Volume (Units) Forecast by Application, 2020-2035
  • Table 69: East Asia Market Value (USD Million) Forecast by End Use, 2020-2035
  • Table 70: East Asia Market Volume (Units) Forecast by End Use, 2020-2035
  • Table 71: South Asia & Pacific Market Value (USD Million) Forecast by Country, 2020-2035
  • Table 72: South Asia & Pacific Market Volume (Units) Forecast by Country, 2020-2035
  • Table 73: South Asia & Pacific Market Value (USD Million) Forecast by Chemistry, 2020-2035
  • Table 74: South Asia & Pacific Market Volume (Units) Forecast by Chemistry, 2020-2035
  • Table 75: South Asia & Pacific Market Value (USD Million) Forecast by Functional Mechanism, 2020-2035
  • Table 76: South Asia & Pacific Market Volume (Units) Forecast by Functional Mechanism, 2020-2035
  • Table 77: South Asia & Pacific Market Value (USD Million) Forecast by Delivery System, 2020-2035
  • Table 78: South Asia & Pacific Market Volume (Units) Forecast by Delivery System, 2020-2035
  • Table 79: South Asia & Pacific Market Value (USD Million) Forecast by Physical Form, 2020-2035
  • Table 80: South Asia & Pacific Market Volume (Units) Forecast by Physical Form, 2020-2035
  • Table 81: South Asia & Pacific Market Value (USD Million) Forecast by Application, 2020-2035
  • Table 82: South Asia & Pacific Market Volume (Units) Forecast by Application, 2020-2035
  • Table 83: South Asia & Pacific Market Value (USD Million) Forecast by End Use, 2020-2035
  • Table 84: South Asia & Pacific Market Volume (Units) Forecast by End Use, 2020-2035
  • Table 85: Middle East and Africa Market Value (USD Million) Forecast by Country, 2020-2035
  • Table 86: Middle East and Africa Market Volume (Units) Forecast by Country, 2020-2035
  • Table 87: Middle East and Africa Market Value (USD Million) Forecast by Chemistry, 2020-2035
  • Table 88: Middle East and Africa Market Volume (Units) Forecast by Chemistry, 2020-2035
  • Table 89: Middle East and Africa Market Value (USD Million) Forecast by Functional Mechanism, 2020-2035
  • Table 90: Middle East and Africa Market Volume (Units) Forecast by Functional Mechanism, 2020-2035
  • Table 91: Middle East and Africa Market Value (USD Million) Forecast by Delivery System, 2020-2035
  • Table 92: Middle East and Africa Market Volume (Units) Forecast by Delivery System, 2020-2035
  • Table 93: Middle East and Africa Market Value (USD Million) Forecast by Physical Form, 2020-2035
  • Table 94: Middle East and Africa Market Volume (Units) Forecast by Physical Form, 2020-2035
  • Table 95: Middle East and Africa Market Value (USD Million) Forecast by Application, 2020-2035
  • Table 96: Middle East and Africa Market Volume (Units) Forecast by Application, 2020-2035
  • Table 97: Middle East and Africa Market Value (USD Million) Forecast by End Use, 2020-2035
  • Table 98: Middle East and Africa Market Volume (Units) Forecast by End Use, 2020-2035

List of Figures

  • Figure 1: Global Market Value (USD Million) by Chemistry, 2025-2035
  • Figure 2: Global Market Value (USD Million) by Functional Mechanism, 2025-2035
  • Figure 3: Global Market Value (USD Million) by Delivery System, 2025-2035
  • Figure 4: Global Market Value (USD Million) by Physical Form, 2025-2035
  • Figure 5: Global Market Value (USD Million) by Application, 2025-2035
  • Figure 6: Global Market Value (USD Million) by End Use, 2025-2035
  • Figure 7: Global Market Value (USD Million) by Region, 2025-2035
  • Figure 8: Global Market Value (USD Million) Analysis by Region, 2020-2035
  • Figure 9: Global Market Volume (Units) Analysis by Region, 2020-2035
  • Figure 10: Global Market Value Share (%) and BPS Analysis by Region, 2025-2035
  • Figure 11: Global Market Y-o-Y Growth (%) Projections by Region, 2025-2035
  • Figure 12: Global Market Value (USD Million) Analysis by Chemistry, 2020-2035
  • Figure 13: Global Market Volume (Units) Analysis by Chemistry, 2020-2035
  • Figure 14: Global Market Value Share (%) and BPS Analysis by Chemistry, 2025-2035
  • Figure 15: Global Market Y-o-Y Growth (%) Projections by Chemistry, 2025-2035
  • Figure 16: Global Market Value (USD Million) Analysis by Functional Mechanism, 2020-2035
  • Figure 17: Global Market Volume (Units) Analysis by Functional Mechanism, 2020-2035
  • Figure 18: Global Market Value Share (%) and BPS Analysis by Functional Mechanism, 2025-2035
  • Figure 19: Global Market Y-o-Y Growth (%) Projections by Functional Mechanism, 2025-2035
  • Figure 20: Global Market Value (USD Million) Analysis by Delivery System, 2020-2035
  • Figure 21: Global Market Volume (Units) Analysis by Delivery System, 2020-2035
  • Figure 22: Global Market Value Share (%) and BPS Analysis by Delivery System, 2025-2035
  • Figure 23: Global Market Y-o-Y Growth (%) Projections by Delivery System, 2025-2035
  • Figure 24: Global Market Value (USD Million) Analysis by Physical Form, 2020-2035
  • Figure 25: Global Market Volume (Units) Analysis by Physical Form, 2020-2035
  • Figure 26: Global Market Value Share (%) and BPS Analysis by Physical Form, 2025-2035
  • Figure 27: Global Market Y-o-Y Growth (%) Projections by Physical Form, 2025-2035
  • Figure 28: Global Market Value (USD Million) Analysis by Application, 2020-2035
  • Figure 29: Global Market Volume (Units) Analysis by Application, 2020-2035
  • Figure 30: Global Market Value Share (%) and BPS Analysis by Application, 2025-2035
  • Figure 31: Global Market Y-o-Y Growth (%) Projections by Application, 2025-2035
  • Figure 32: Global Market Value (USD Million) Analysis by End Use, 2020-2035
  • Figure 33: Global Market Volume (Units) Analysis by End Use, 2020-2035
  • Figure 34: Global Market Value Share (%) and BPS Analysis by End Use, 2025-2035
  • Figure 35: Global Market Y-o-Y Growth (%) Projections by End Use, 2025-2035
  • Figure 36: Global Market Attractiveness by Chemistry, 2025-2035
  • Figure 37: Global Market Attractiveness by Functional Mechanism, 2025-2035
  • Figure 38: Global Market Attractiveness by Delivery System, 2025-2035
  • Figure 39: Global Market Attractiveness by Physical Form, 2025-2035
  • Figure 40: Global Market Attractiveness by Application, 2025-2035
  • Figure 41: Global Market Attractiveness by End Use, 2025-2035
  • Figure 42: Global Market Attractiveness by Region, 2025-2035
  • Figure 43: North America Market Value (USD Million) by Chemistry, 2025-2035
  • Figure 44: North America Market Value (USD Million) by Functional Mechanism, 2025-2035
  • Figure 45: North America Market Value (USD Million) by Delivery System, 2025-2035
  • Figure 46: North America Market Value (USD Million) by Physical Form, 2025-2035
  • Figure 47: North America Market Value (USD Million) by Application, 2025-2035
  • Figure 48: North America Market Value (USD Million) by End Use, 2025-2035
  • Figure 49: North America Market Value (USD Million) by Country, 2025-2035
  • Figure 50: North America Market Value (USD Million) Analysis by Country, 2020-2035
  • Figure 51: North America Market Volume (Units) Analysis by Country, 2020-2035
  • Figure 52: North America Market Value Share (%) and BPS Analysis by Country, 2025-2035
  • Figure 53: North America Market Y-o-Y Growth (%) Projections by Country, 2025-2035
  • Figure 54: North America Market Value (USD Million) Analysis by Chemistry, 2020-2035
  • Figure 55: North America Market Volume (Units) Analysis by Chemistry, 2020-2035
  • Figure 56: North America Market Value Share (%) and BPS Analysis by Chemistry, 2025-2035
  • Figure 57: North America Market Y-o-Y Growth (%) Projections by Chemistry, 2025-2035
  • Figure 58: North America Market Value (USD Million) Analysis by Functional Mechanism, 2020-2035
  • Figure 59: North America Market Volume (Units) Analysis by Functional Mechanism, 2020-2035
  • Figure 60: North America Market Value Share (%) and BPS Analysis by Functional Mechanism, 2025-2035
  • Figure 61: North America Market Y-o-Y Growth (%) Projections by Functional Mechanism, 2025-2035
  • Figure 62: North America Market Value (USD Million) Analysis by Delivery System, 2020-2035
  • Figure 63: North America Market Volume (Units) Analysis by Delivery System, 2020-2035
  • Figure 64: North America Market Value Share (%) and BPS Analysis by Delivery System, 2025-2035
  • Figure 65: North America Market Y-o-Y Growth (%) Projections by Delivery System, 2025-2035
  • Figure 66: North America Market Value (USD Million) Analysis by Physical Form, 2020-2035
  • Figure 67: North America Market Volume (Units) Analysis by Physical Form, 2020-2035
  • Figure 68: North America Market Value Share (%) and BPS Analysis by Physical Form, 2025-2035
  • Figure 69: North America Market Y-o-Y Growth (%) Projections by Physical Form, 2025-2035
  • Figure 70: North America Market Value (USD Million) Analysis by Application, 2020-2035
  • Figure 71: North America Market Volume (Units) Analysis by Application, 2020-2035
  • Figure 72: North America Market Value Share (%) and BPS Analysis by Application, 2025-2035
  • Figure 73: North America Market Y-o-Y Growth (%) Projections by Application, 2025-2035
  • Figure 74: North America Market Value (USD Million) Analysis by End Use, 2020-2035
  • Figure 75: North America Market Volume (Units) Analysis by End Use, 2020-2035
  • Figure 76: North America Market Value Share (%) and BPS Analysis by End Use, 2025-2035
  • Figure 77: North America Market Y-o-Y Growth (%) Projections by End Use, 2025-2035
  • Figure 78: North America Market Attractiveness by Chemistry, 2025-2035
  • Figure 79: North America Market Attractiveness by Functional Mechanism, 2025-2035
  • Figure 80: North America Market Attractiveness by Delivery System, 2025-2035
  • Figure 81: North America Market Attractiveness by Physical Form, 2025-2035
  • Figure 82: North America Market Attractiveness by Application, 2025-2035
  • Figure 83: North America Market Attractiveness by End Use, 2025-2035
  • Figure 84: North America Market Attractiveness by Country, 2025-2035
  • Figure 85: Latin America Market Value (USD Million) by Chemistry, 2025-2035
  • Figure 86: Latin America Market Value (USD Million) by Functional Mechanism, 2025-2035
  • Figure 87: Latin America Market Value (USD Million) by Delivery System, 2025-2035
  • Figure 88: Latin America Market Value (USD Million) by Physical Form, 2025-2035
  • Figure 89: Latin America Market Value (USD Million) by Application, 2025-2035
  • Figure 90: Latin America Market Value (USD Million) by End Use, 2025-2035
  • Figure 91: Latin America Market Value (USD Million) by Country, 2025-2035
  • Figure 92: Latin America Market Value (USD Million) Analysis by Country, 2020-2035
  • Figure 93: Latin America Market Volume (Units) Analysis by Country, 2020-2035
  • Figure 94: Latin America Market Value Share (%) and BPS Analysis by Country, 2025-2035
  • Figure 95: Latin America Market Y-o-Y Growth (%) Projections by Country, 2025-2035
  • Figure 96: Latin America Market Value (USD Million) Analysis by Chemistry, 2020-2035
  • Figure 97: Latin America Market Volume (Units) Analysis by Chemistry, 2020-2035
  • Figure 98: Latin America Market Value Share (%) and BPS Analysis by Chemistry, 2025-2035
  • Figure 99: Latin America Market Y-o-Y Growth (%) Projections by Chemistry, 2025-2035
  • Figure 100: Latin America Market Value (USD Million) Analysis by Functional Mechanism, 2020-2035
  • Figure 101: Latin America Market Volume (Units) Analysis by Functional Mechanism, 2020-2035
  • Figure 102: Latin America Market Value Share (%) and BPS Analysis by Functional Mechanism, 2025-2035
  • Figure 103: Latin America Market Y-o-Y Growth (%) Projections by Functional Mechanism, 2025-2035
  • Figure 104: Latin America Market Value (USD Million) Analysis by Delivery System, 2020-2035
  • Figure 105: Latin America Market Volume (Units) Analysis by Delivery System, 2020-2035
  • Figure 106: Latin America Market Value Share (%) and BPS Analysis by Delivery System, 2025-2035
  • Figure 107: Latin America Market Y-o-Y Growth (%) Projections by Delivery System, 2025-2035
  • Figure 108: Latin America Market Value (USD Million) Analysis by Physical Form, 2020-2035
  • Figure 109: Latin America Market Volume (Units) Analysis by Physical Form, 2020-2035
  • Figure 110: Latin America Market Value Share (%) and BPS Analysis by Physical Form, 2025-2035
  • Figure 111: Latin America Market Y-o-Y Growth (%) Projections by Physical Form, 2025-2035
  • Figure 112: Latin America Market Value (USD Million) Analysis by Application, 2020-2035
  • Figure 113: Latin America Market Volume (Units) Analysis by Application, 2020-2035
  • Figure 114: Latin America Market Value Share (%) and BPS Analysis by Application, 2025-2035
  • Figure 115: Latin America Market Y-o-Y Growth (%) Projections by Application, 2025-2035
  • Figure 116: Latin America Market Value (USD Million) Analysis by End Use, 2020-2035
  • Figure 117: Latin America Market Volume (Units) Analysis by End Use, 2020-2035
  • Figure 118: Latin America Market Value Share (%) and BPS Analysis by End Use, 2025-2035
  • Figure 119: Latin America Market Y-o-Y Growth (%) Projections by End Use, 2025-2035
  • Figure 120: Latin America Market Attractiveness by Chemistry, 2025-2035
  • Figure 121: Latin America Market Attractiveness by Functional Mechanism, 2025-2035
  • Figure 122: Latin America Market Attractiveness by Delivery System, 2025-2035
  • Figure 123: Latin America Market Attractiveness by Physical Form, 2025-2035
  • Figure 124: Latin America Market Attractiveness by Application, 2025-2035
  • Figure 125: Latin America Market Attractiveness by End Use, 2025-2035
  • Figure 126: Latin America Market Attractiveness by Country, 2025-2035
  • Figure 127: Europe Market Value (USD Million) by Chemistry, 2025-2035
  • Figure 128: Europe Market Value (USD Million) by Functional Mechanism, 2025-2035
  • Figure 129: Europe Market Value (USD Million) by Delivery System, 2025-2035
  • Figure 130: Europe Market Value (USD Million) by Physical Form, 2025-2035
  • Figure 131: Europe Market Value (USD Million) by Application, 2025-2035
  • Figure 132: Europe Market Value (USD Million) by End Use, 2025-2035
  • Figure 133: Europe Market Value (USD Million) by Country, 2025-2035
  • Figure 134: Europe Market Value (USD Million) Analysis by Country, 2020-2035
  • Figure 135: Europe Market Volume (Units) Analysis by Country, 2020-2035
  • Figure 136: Europe Market Value Share (%) and BPS Analysis by Country, 2025-2035
  • Figure 137: Europe Market Y-o-Y Growth (%) Projections by Country, 2025-2035
  • Figure 138: Europe Market Value (USD Million) Analysis by Chemistry, 2020-2035
  • Figure 139: Europe Market Volume (Units) Analysis by Chemistry, 2020-2035
  • Figure 140: Europe Market Value Share (%) and BPS Analysis by Chemistry, 2025-2035
  • Figure 141: Europe Market Y-o-Y Growth (%) Projections by Chemistry, 2025-2035
  • Figure 142: Europe Market Value (USD Million) Analysis by Functional Mechanism, 2020-2035
  • Figure 143: Europe Market Volume (Units) Analysis by Functional Mechanism, 2020-2035
  • Figure 144: Europe Market Value Share (%) and BPS Analysis by Functional Mechanism, 2025-2035
  • Figure 145: Europe Market Y-o-Y Growth (%) Projections by Functional Mechanism, 2025-2035
  • Figure 146: Europe Market Value (USD Million) Analysis by Delivery System, 2020-2035
  • Figure 147: Europe Market Volume (Units) Analysis by Delivery System, 2020-2035
  • Figure 148: Europe Market Value Share (%) and BPS Analysis by Delivery System, 2025-2035
  • Figure 149: Europe Market Y-o-Y Growth (%) Projections by Delivery System, 2025-2035
  • Figure 150: Europe Market Value (USD Million) Analysis by Physical Form, 2020-2035
  • Figure 151: Europe Market Volume (Units) Analysis by Physical Form, 2020-2035
  • Figure 152: Europe Market Value Share (%) and BPS Analysis by Physical Form, 2025-2035
  • Figure 153: Europe Market Y-o-Y Growth (%) Projections by Physical Form, 2025-2035
  • Figure 154: Europe Market Value (USD Million) Analysis by Application, 2020-2035
  • Figure 155: Europe Market Volume (Units) Analysis by Application, 2020-2035
  • Figure 156: Europe Market Value Share (%) and BPS Analysis by Application, 2025-2035
  • Figure 157: Europe Market Y-o-Y Growth (%) Projections by Application, 2025-2035
  • Figure 158: Europe Market Value (USD Million) Analysis by End Use, 2020-2035
  • Figure 159: Europe Market Volume (Units) Analysis by End Use, 2020-2035
  • Figure 160: Europe Market Value Share (%) and BPS Analysis by End Use, 2025-2035
  • Figure 161: Europe Market Y-o-Y Growth (%) Projections by End Use, 2025-2035
  • Figure 162: Europe Market Attractiveness by Chemistry, 2025-2035
  • Figure 163: Europe Market Attractiveness by Functional Mechanism, 2025-2035
  • Figure 164: Europe Market Attractiveness by Delivery System, 2025-2035
  • Figure 165: Europe Market Attractiveness by Physical Form, 2025-2035
  • Figure 166: Europe Market Attractiveness by Application, 2025-2035
  • Figure 167: Europe Market Attractiveness by End Use, 2025-2035
  • Figure 168: Europe Market Attractiveness by Country, 2025-2035
  • Figure 169: East Asia Market Value (USD Million) by Chemistry, 2025-2035
  • Figure 170: East Asia Market Value (USD Million) by Functional Mechanism, 2025-2035
  • Figure 171: East Asia Market Value (USD Million) by Delivery System, 2025-2035
  • Figure 172: East Asia Market Value (USD Million) by Physical Form, 2025-2035
  • Figure 173: East Asia Market Value (USD Million) by Application, 2025-2035
  • Figure 174: East Asia Market Value (USD Million) by End Use, 2025-2035
  • Figure 175: East Asia Market Value (USD Million) by Country, 2025-2035
  • Figure 176: East Asia Market Value (USD Million) Analysis by Country, 2020-2035
  • Figure 177: East Asia Market Volume (Units) Analysis by Country, 2020-2035
  • Figure 178: East Asia Market Value Share (%) and BPS Analysis by Country, 2025-2035
  • Figure 179: East Asia Market Y-o-Y Growth (%) Projections by Country, 2025-2035
  • Figure 180: East Asia Market Value (USD Million) Analysis by Chemistry, 2020-2035
  • Figure 181: East Asia Market Volume (Units) Analysis by Chemistry, 2020-2035
  • Figure 182: East Asia Market Value Share (%) and BPS Analysis by Chemistry, 2025-2035
  • Figure 183: East Asia Market Y-o-Y Growth (%) Projections by Chemistry, 2025-2035
  • Figure 184: East Asia Market Value (USD Million) Analysis by Functional Mechanism, 2020-2035
  • Figure 185: East Asia Market Volume (Units) Analysis by Functional Mechanism, 2020-2035
  • Figure 186: East Asia Market Value Share (%) and BPS Analysis by Functional Mechanism, 2025-2035
  • Figure 187: East Asia Market Y-o-Y Growth (%) Projections by Functional Mechanism, 2025-2035
  • Figure 188: East Asia Market Value (USD Million) Analysis by Delivery System, 2020-2035
  • Figure 189: East Asia Market Volume (Units) Analysis by Delivery System, 2020-2035
  • Figure 190: East Asia Market Value Share (%) and BPS Analysis by Delivery System, 2025-2035
  • Figure 191: East Asia Market Y-o-Y Growth (%) Projections by Delivery System, 2025-2035
  • Figure 192: East Asia Market Value (USD Million) Analysis by Physical Form, 2020-2035
  • Figure 193: East Asia Market Volume (Units) Analysis by Physical Form, 2020-2035
  • Figure 194: East Asia Market Value Share (%) and BPS Analysis by Physical Form, 2025-2035
  • Figure 195: East Asia Market Y-o-Y Growth (%) Projections by Physical Form, 2025-2035
  • Figure 196: East Asia Market Value (USD Million) Analysis by Application, 2020-2035
  • Figure 197: East Asia Market Volume (Units) Analysis by Application, 2020-2035
  • Figure 198: East Asia Market Value Share (%) and BPS Analysis by Application, 2025-2035
  • Figure 199: East Asia Market Y-o-Y Growth (%) Projections by Application, 2025-2035
  • Figure 200: East Asia Market Value (USD Million) Analysis by End Use, 2020-2035
  • Figure 201: East Asia Market Volume (Units) Analysis by End Use, 2020-2035
  • Figure 202: East Asia Market Value Share (%) and BPS Analysis by End Use, 2025-2035
  • Figure 203: East Asia Market Y-o-Y Growth (%) Projections by End Use, 2025-2035
  • Figure 204: East Asia Market Attractiveness by Chemistry, 2025-2035
  • Figure 205: East Asia Market Attractiveness by Functional Mechanism, 2025-2035
  • Figure 206: East Asia Market Attractiveness by Delivery System, 2025-2035
  • Figure 207: East Asia Market Attractiveness by Physical Form, 2025-2035
  • Figure 208: East Asia Market Attractiveness by Application, 2025-2035
  • Figure 209: East Asia Market Attractiveness by End Use, 2025-2035
  • Figure 210: East Asia Market Attractiveness by Country, 2025-2035
  • Figure 211: South Asia & Pacific Market Value (USD Million) by Chemistry, 2025-2035
  • Figure 212: South Asia & Pacific Market Value (USD Million) by Functional Mechanism, 2025-2035
  • Figure 213: South Asia & Pacific Market Value (USD Million) by Delivery System, 2025-2035
  • Figure 214: South Asia & Pacific Market Value (USD Million) by Physical Form, 2025-2035
  • Figure 215: South Asia & Pacific Market Value (USD Million) by Application, 2025-2035
  • Figure 216: South Asia & Pacific Market Value (USD Million) by End Use, 2025-2035
  • Figure 217: South Asia & Pacific Market Value (USD Million) by Country, 2025-2035
  • Figure 218: South Asia & Pacific Market Value (USD Million) Analysis by Country, 2020-2035
  • Figure 219: South Asia & Pacific Market Volume (Units) Analysis by Country, 2020-2035
  • Figure 220: South Asia & Pacific Market Value Share (%) and BPS Analysis by Country, 2025-2035
  • Figure 221: South Asia & Pacific Market Y-o-Y Growth (%) Projections by Country, 2025-2035
  • Figure 222: South Asia & Pacific Market Value (USD Million) Analysis by Chemistry, 2020-2035
  • Figure 223: South Asia & Pacific Market Volume (Units) Analysis by Chemistry, 2020-2035
  • Figure 224: South Asia & Pacific Market Value Share (%) and BPS Analysis by Chemistry, 2025-2035
  • Figure 225: South Asia & Pacific Market Y-o-Y Growth (%) Projections by Chemistry, 2025-2035
  • Figure 226: South Asia & Pacific Market Value (USD Million) Analysis by Functional Mechanism, 2020-2035
  • Figure 227: South Asia & Pacific Market Volume (Units) Analysis by Functional Mechanism, 2020-2035
  • Figure 228: South Asia & Pacific Market Value Share (%) and BPS Analysis by Functional Mechanism, 2025-2035
  • Figure 229: South Asia & Pacific Market Y-o-Y Growth (%) Projections by Functional Mechanism, 2025-2035
  • Figure 230: South Asia & Pacific Market Value (USD Million) Analysis by Delivery System, 2020-2035
  • Figure 231: South Asia & Pacific Market Volume (Units) Analysis by Delivery System, 2020-2035
  • Figure 232: South Asia & Pacific Market Value Share (%) and BPS Analysis by Delivery System, 2025-2035
  • Figure 233: South Asia & Pacific Market Y-o-Y Growth (%) Projections by Delivery System, 2025-2035
  • Figure 234: South Asia & Pacific Market Value (USD Million) Analysis by Physical Form, 2020-2035
  • Figure 235: South Asia & Pacific Market Volume (Units) Analysis by Physical Form, 2020-2035
  • Figure 236: South Asia & Pacific Market Value Share (%) and BPS Analysis by Physical Form, 2025-2035
  • Figure 237: South Asia & Pacific Market Y-o-Y Growth (%) Projections by Physical Form, 2025-2035
  • Figure 238: South Asia & Pacific Market Value (USD Million) Analysis by Application, 2020-2035
  • Figure 239: South Asia & Pacific Market Volume (Units) Analysis by Application, 2020-2035
  • Figure 240: South Asia & Pacific Market Value Share (%) and BPS Analysis by Application, 2025-2035
  • Figure 241: South Asia & Pacific Market Y-o-Y Growth (%) Projections by Application, 2025-2035
  • Figure 242: South Asia & Pacific Market Value (USD Million) Analysis by End Use, 2020-2035
  • Figure 243: South Asia & Pacific Market Volume (Units) Analysis by End Use, 2020-2035
  • Figure 244: South Asia & Pacific Market Value Share (%) and BPS Analysis by End Use, 2025-2035
  • Figure 245: South Asia & Pacific Market Y-o-Y Growth (%) Projections by End Use, 2025-2035
  • Figure 246: South Asia & Pacific Market Attractiveness by Chemistry, 2025-2035
  • Figure 247: South Asia & Pacific Market Attractiveness by Functional Mechanism, 2025-2035
  • Figure 248: South Asia & Pacific Market Attractiveness by Delivery System, 2025-2035
  • Figure 249: South Asia & Pacific Market Attractiveness by Physical Form, 2025-2035
  • Figure 250: South Asia & Pacific Market Attractiveness by Application, 2025-2035
  • Figure 251: South Asia & Pacific Market Attractiveness by End Use, 2025-2035
  • Figure 252: South Asia & Pacific Market Attractiveness by Country, 2025-2035
  • Figure 253: Middle East and Africa Market Value (USD Million) by Chemistry, 2025-2035
  • Figure 254: Middle East and Africa Market Value (USD Million) by Functional Mechanism, 2025-2035
  • Figure 255: Middle East and Africa Market Value (USD Million) by Delivery System, 2025-2035
  • Figure 256: Middle East and Africa Market Value (USD Million) by Physical Form, 2025-2035
  • Figure 257: Middle East and Africa Market Value (USD Million) by Application, 2025-2035
  • Figure 258: Middle East and Africa Market Value (USD Million) by End Use, 2025-2035
  • Figure 259: Middle East and Africa Market Value (USD Million) by Country, 2025-2035
  • Figure 260: Middle East and Africa Market Value (USD Million) Analysis by Country, 2020-2035
  • Figure 261: Middle East and Africa Market Volume (Units) Analysis by Country, 2020-2035
  • Figure 262: Middle East and Africa Market Value Share (%) and BPS Analysis by Country, 2025-2035
  • Figure 263: Middle East and Africa Market Y-o-Y Growth (%) Projections by Country, 2025-2035
  • Figure 264: Middle East and Africa Market Value (USD Million) Analysis by Chemistry, 2020-2035
  • Figure 265: Middle East and Africa Market Volume (Units) Analysis by Chemistry, 2020-2035
  • Figure 266: Middle East and Africa Market Value Share (%) and BPS Analysis by Chemistry, 2025-2035
  • Figure 267: Middle East and Africa Market Y-o-Y Growth (%) Projections by Chemistry, 2025-2035
  • Figure 268: Middle East and Africa Market Value (USD Million) Analysis by Functional Mechanism, 2020-2035
  • Figure 269: Middle East and Africa Market Volume (Units) Analysis by Functional Mechanism, 2020-2035
  • Figure 270: Middle East and Africa Market Value Share (%) and BPS Analysis by Functional Mechanism, 2025-2035
  • Figure 271: Middle East and Africa Market Y-o-Y Growth (%) Projections by Functional Mechanism, 2025-2035
  • Figure 272: Middle East and Africa Market Value (USD Million) Analysis by Delivery System, 2020-2035
  • Figure 273: Middle East and Africa Market Volume (Units) Analysis by Delivery System, 2020-2035
  • Figure 274: Middle East and Africa Market Value Share (%) and BPS Analysis by Delivery System, 2025-2035
  • Figure 275: Middle East and Africa Market Y-o-Y Growth (%) Projections by Delivery System, 2025-2035
  • Figure 276: Middle East and Africa Market Value (USD Million) Analysis by Physical Form, 2020-2035
  • Figure 277: Middle East and Africa Market Volume (Units) Analysis by Physical Form, 2020-2035
  • Figure 278: Middle East and Africa Market Value Share (%) and BPS Analysis by Physical Form, 2025-2035
  • Figure 279: Middle East and Africa Market Y-o-Y Growth (%) Projections by Physical Form, 2025-2035
  • Figure 280: Middle East and Africa Market Value (USD Million) Analysis by Application, 2020-2035
  • Figure 281: Middle East and Africa Market Volume (Units) Analysis by Application, 2020-2035
  • Figure 282: Middle East and Africa Market Value Share (%) and BPS Analysis by Application, 2025-2035
  • Figure 283: Middle East and Africa Market Y-o-Y Growth (%) Projections by Application, 2025-2035
  • Figure 284: Middle East and Africa Market Value (USD Million) Analysis by End Use, 2020-2035
  • Figure 285: Middle East and Africa Market Volume (Units) Analysis by End Use, 2020-2035
  • Figure 286: Middle East and Africa Market Value Share (%) and BPS Analysis by End Use, 2025-2035
  • Figure 287: Middle East and Africa Market Y-o-Y Growth (%) Projections by End Use, 2025-2035
  • Figure 288: Middle East and Africa Market Attractiveness by Chemistry, 2025-2035
  • Figure 289: Middle East and Africa Market Attractiveness by Functional Mechanism, 2025-2035
  • Figure 290: Middle East and Africa Market Attractiveness by Delivery System, 2025-2035
  • Figure 291: Middle East and Africa Market Attractiveness by Physical Form, 2025-2035
  • Figure 292: Middle East and Africa Market Attractiveness by Application, 2025-2035
  • Figure 293: Middle East and Africa Market Attractiveness by End Use, 2025-2035
  • Figure 294: Middle East and Africa Market Attractiveness by Country, 2025-2035

Frequently Asked Questions

How big is the Global Heating Agents Market in 2025?

The Global Heating Agents Market is estimated to be valued at USD 906.3 million in 2025.

What will be the size of the Global Heating Agents Market in 2035?

The market size for the Global Heating Agents Market is projected to reach USD 2,006.4 million by 2035.

How much will the Global Heating Agents Market grow between 2025 and 2035?

The Global Heating Agents Market is expected to grow at a CAGR of 8.3% between 2025 and 2035.

What are the key chemistry segments in the Global Heating Agents Market?

The key chemistry segments are Vanillyl ether derivatives (VBE), Capsaicinoids, Gingerol/zingiber derivatives, and Nicotinate esters.

Which functional mechanism segment will contribute significant share in the Global Heating Agents Market in 2025?

In terms of functional mechanism, the Long-lasting warming segment is projected to command 40.2% share in 2025.

Explore Similar Insights

Future Market Insights

Heating Agents Market

Chat With

MaRIA

Hi There, I am MaRIA, Your Market Research Intelligence Assistant. How may I help you?