Renewable Biopolymer Cosmetics Market Size and Share Forecast Outlook 2025 to 2035

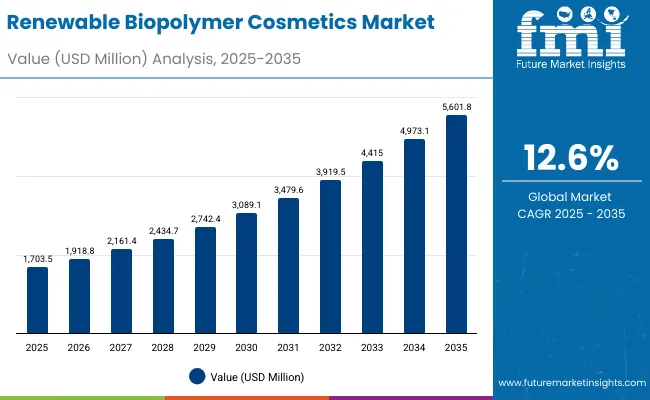
The global Renewable Biopolymer Cosmetics Market is expected to record a valuation of USD 1,703.5 million in 2025 and USD 5,601.8 million in 2035, with an increase of USD 3,898.3 million, which equals a growth of 193% over the decade. The overall expansion represents a CAGR of 12.6% and a 2X increase in market size.
Quick Stats for Global Renewable Biopolymer Cosmetics Market

  • Renewable Biopolymer Cosmetics Market Value (2025): USD 1,703.5 million
  • Renewable Biopolymer Cosmetics Market Forecast Value (2035): USD 5,601.8 million
  • Renewable Biopolymer Cosmetics Market Forecast CAGR: 12.6%
  • Leading Segment in Global Renewable Biopolymer Cosmetics Market in 2025: Biodegradable claims (52.3%)
  • Key Growth Regions in the Global Renewable Biopolymer Cosmetics Market: Asia-Pacific (China, India, Japan), North America (USA), Europe (Germany, UK)
  • Top Key Players in Global Renewable Biopolymer Cosmetics Market: BASF, Clariant, Evonik, Croda, Ashland, Novamont, NatureWorks, Givaudan, Seppic, Kuraray

Renewable Biopolymer Cosmetics Market

Global Renewable Biopolymer Cosmetics Market Key Takeaways

Metric Value
Global Renewable Biopolymer Cosmetics Market Estimated Value in (2025E) USD 1,703.5 million
Global Renewable Biopolymer Cosmetics Market Forecast Value in (2035F) USD 5,601.8 million
Forecast CAGR (2025 to 2035) 12.6%

During the first five-year period from 2025 to 2030, the market increases from USD 1,703.5 million to USD 3,089.1 million, adding USD 1,385.6 million, which accounts for 35.5% of the total decade growth. This phase records steady adoption in creams/lotions, haircare gels, and sun care formulations, driven by the need for sustainable alternatives that reduce reliance on petrochemical-derived polymers. Biodegradable claims dominate this period as they cater to over half of global demand, supported by consumer preference for transparency in eco-labeling and corporate sustainability goals. Film-formers represent the highest functional demand as they are critical in maintaining product stability, texture, and longevity in formulations.

The second half from 2030 to 2035 contributes USD 2,512.7 million, equal to 64.5% of total growth, as the market jumps from USD 3,089.1 million to USD 5,601.8 million. This acceleration is powered by widespread adoption of vegan-certified, palm-free, and eco-certified formulations, alongside deployment of biopolymer-based biodegradable packaging systems across cosmetics supply chains.

Growth is further fueled by increasing uptake in color cosmetics and sun care, where lightweight film-formers and texture enhancers enable improved sensory appeal while maintaining eco-compliance. Specialty clean-beauty retail and e-commerce platforms emerge as dominant distribution channels, supported by younger demographics demanding circularity and traceability.

From 2020 to 2024, the global Renewable Biopolymer Cosmetics Market grew from niche volumes to a structured market worth over USD 1.5 billion by 2024, driven by biodegradable and eco-certified positioning. During this period, the competitive landscape was dominated by ingredient manufacturers controlling nearly 70-75% of revenue, with leaders such as BASF, Croda, and Nature Works focusing on polylactic acid (PLA) and starch-based innovations that could replace synthetic polymers in cosmetic emulsions and textures.

Competitive differentiation relied heavily on supply security, cost competitiveness, and meeting clean-label regulations in Europe and North America. Packaging systems incorporating starch and chitosan biopolymers were developed but adoption remained limited outside niche beauty brands.

Demand for renewable biopolymers in cosmetics will expand to USD 1,703.5 million in 2025, and the revenue mix will gradually shift as biodegradable packaging systems and vegan-certified formulations grow to over 35% share by 2035. Traditional ingredient leaders face rising competition from clean-beauty-driven startups and Asian biopolymer innovators offering cost-effective PHA and chitosan derivatives.

Major suppliers are pivoting to hybrid sustainability models, integrating renewable feedstock sourcing, palm-free supply chains, and broader portfolio certifications (COSMOS, Ecocert, USDA Bio Preferred) to retain relevance. Emerging entrants specializing in eco-certified functional polymers for skin feel enhancement and AR/VR-driven consumer storytelling are gaining share. The competitive advantage is moving away from cost efficiency alone to brand alignment, certification credibility, and lifecycle sustainability metrics.

Why the Renewable Biopolymer Cosmetics Market is Growing?

Advances in biopolymer synthesis and processing have improved film-forming, emulsification, and texture-enhancing properties, allowing for seamless replacement of conventional petrochemical polymers in cosmetics. PLA and starch-based polymers have gained popularity due to their versatility in skincare and packaging. The rise of eco-certifications, vegan claims, and palm-free positioning has further contributed to growth by appealing to consumers demanding ethical sourcing and transparent sustainability metrics. Industries such as skincare, haircare, and sun care are driving demand for renewable biopolymers that can integrate seamlessly into formulations while reducing environmental impact.

Expansion of biodegradable packaging and clean-label formulations has fueled market growth. Innovations in PHA and chitosan derivatives are expected to open new application areas, particularly in haircare gels and color cosmetics where polymer flexibility is key. Segment growth is expected to be led by biodegradable claims, film-formers in function categories, and creams/lotions in applications due to their ubiquity and high product turnover.

Segmental Analysis

The market is segmented by polymer type, function, application, channel, and claim. Polymer types include PLA, PHA, chitosan derivatives, and starch-based biopolymers, representing the core material innovations. Functions cover film-formers, emulsifiers, texture enhancers, and biodegradable packaging systems, which reflect both formulation and packaging roles. Applications span creams/lotions, haircare gels, color cosmetics, and sun care the largest consumption categories in personal care. Channels include e-commerce, mass retail, specialty clean-beauty retail, and pharmacies. Claims emphasize biodegradable, eco-certified, vegan, and palm-free products, aligning with sustainability trends.
Insights into the Claim Segment with Biodegradable Leading in Market Share

Renewable Biopolymer Cosmetics Market By Claim

Claim Value Share% 2025
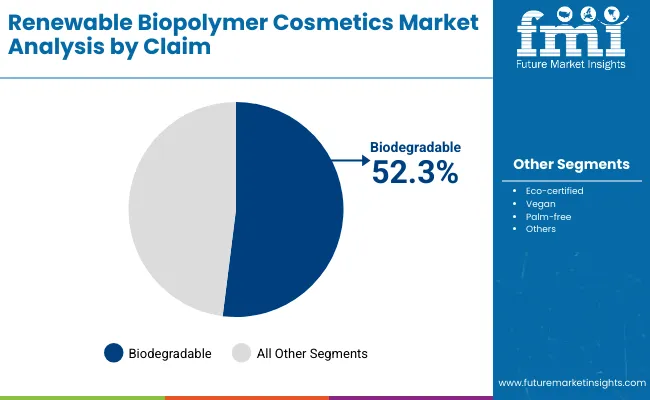
Biodegradable 52.3%
Others 47.7%

The biodegradable claim segment is projected to contribute 52.3% of the global Renewable Biopolymer Cosmetics Market revenue in 2025, maintaining its lead as the dominant claim category. This is driven by ongoing demand for transparent sustainability credentials, eco-friendly certifications, and consumer awareness of plastic pollution. Leading cosmetic brands have prioritized biodegradable positioning in both formulations and packaging, creating strong pull for PLA and starch-based polymers. As consumer education increases and governments impose stricter regulations, biodegradable products will continue to dominate the market mix.
Insights into the Function Segment with Film-formers Dominating the Demand

Renewable Biopolymer Cosmetics Market By Function

Function Value Share% 2025
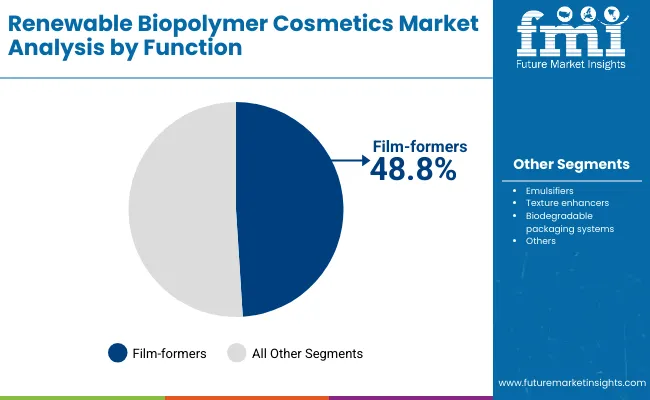
Film-formers 48.8%
Others 51.2%

The film-formers segment is forecasted to hold 48.8% of the market share in 2025, led by its critical role in ensuring formulation stability, uniform spreadability, and sensory attributes. Film-formers are favored for their ability to improve water resistance in sunscreens, enhance gloss in color cosmetics, and provide skin barrier protection in creams and lotions. Their adaptability across multiple product categories has facilitated widespread adoption. Growth is bolstered by advancements in biodegradable and vegan-certified film-formers that enhance sustainability without compromising performance.
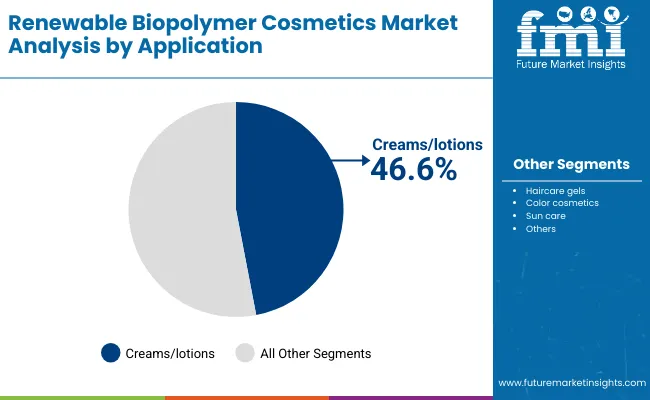
Insights into the Application Segment with Creams/Lotions Leading

Renewable Biopolymer Cosmetics Market By Applicxation

Application Value Share% 2025
Creams/lotions 46.6%
Others 53.4%

The creams/lotions segment is projected to account for 46.6% of the market revenue in 2025, making it the leading application area. These products are produced in high volumes globally and have shorter consumption cycles, creating consistent demand for renewable biopolymers that enhance texture, stability, and skin feel. Growing consumer interest in natural moisturizers and eco-friendly everyday skincare supports expansion. As leading brands integrate biopolymers into mainstream formulations, creams/lotions will continue to anchor demand across all regions.

What are the Drivers, Restraints, and Key Trends of the Global Renewable Biopolymer Cosmetics Market?

Drivers

Rising Adoption of Renewable Biopolymers in Everyday Skincare and Sun Care

One of the strongest demand-side drivers is the rapid adoption of renewable biopolymers in creams/lotions and sun care products, which together represent nearly half of the market in 2025 (46.6% for creams/lotions alone). These are high-turnover categories consumed daily across global populations, which creates consistent opportunities for renewable materials to displace petrochemical-derived polymers. Multinational beauty companies are actively integrating PLA and starch-based film-formers into moisturizers and sunscreens because they not only deliver performance but also allow brands to market biodegradability, eco-certifications, and palm-free claims. The momentum is amplified by rising consumer awareness of microplastics in traditional sun care polymers, which have been criticized for ocean toxicity and coral reef damage. As sustainability regulations tighten, the use of renewable biopolymers in everyday skincare becomes a compliance necessity rather than just a consumer preference, firmly positioning it as a market driver.

Accelerating Innovation in Biodegradable Packaging Systems

Beyond formulations, the packaging dimension is emerging as a powerful driver for growth. Biodegradable packaging systems based on PHA, starch blends, and chitosan derivatives are gaining traction because they directly address the cosmetics industry’s packaging waste problem, which accounts for a large share of plastic pollution. By 2030, several countries in Europe and Asia-Pacific are expected to restrict or tax non-compostable packaging, forcing brands to adopt renewable alternatives. Companies like Novamont and NatureWorks are scaling packaging-grade PLA and starch biopolymer solutions specifically for cosmetics jars, tubes, and sachets. Clean-beauty retailers and specialty stores are further pushing adoption by mandating sustainable packaging as a condition for shelf placement. This packaging-driven pull is unique because it expands the role of renewable biopolymers from functional formulation agents to end-to-end sustainability enablers across the cosmetics lifecycle.

Restraints

High Cost Competitiveness Compared to Petrochemical Polymers

Despite strong growth, the cost structure of renewable biopolymers remains a restraint. Production of PLA, PHA, and chitosan derivatives typically involves more expensive feedstock and processing methods compared to conventional synthetic polymers. For instance, PLA prices can be 20-40% higher than equivalent petrochemical polymers, creating adoption barriers in mass retail cosmetics where pricing sensitivity is high. While premium and specialty clean-beauty brands can pass on these costs to consumers, mass-market brands face a squeeze between sustainability commitments and affordability expectations. This gap is especially significant in developing regions like Latin America and parts of Asia, where affordability dictates market penetration. Without large-scale capacity expansion and cost optimization, renewable biopolymers risk remaining concentrated in mid-to-premium price tiers.

Limited Global Supply and Regional Imbalances

The supply side of renewable biopolymers is constrained by regional production concentration. PLA and PHA production is still dominated by a handful of global players such as NatureWorks, BASF, and Novamont, leading to regional imbalances. Asia-Pacific, despite being the fastest-growing demand region (China CAGR 20.2%, India 24.1%), remains heavily dependent on imports for certain biopolymer grades, creating risks of supply bottlenecks and price volatility. This dependency is further complicated by logistics disruptions and trade regulations surrounding bio-based feedstock. For cosmetic manufacturers seeking stable supply chains, such volatility acts as a restraint, particularly for high-volume product lines where reliability of sourcing is crucial.

Key Trends

Emergence of Vegan and Palm-Free Positioning as Core Differentiators

While biodegradable claims lead the market today (52.3% share in 2025), vegan and palm-free positioning are emerging as the next wave of differentiation. This trend goes beyond environmental benefits, tapping into ethical and social dimensions of consumer choice. Palm-free polymers are gaining traction due to the association of palm oil with deforestation and biodiversity loss. Meanwhile, vegan claims resonate with younger demographics in North America, Europe, and increasingly Asia-Pacific, where cruelty-free and animal-free products are shaping purchase behavior. Biopolymer innovations such as vegan-certified chitosan derivatives (developed from fungal fermentation instead of animal shells) are responding to this demand. By 2030, palm-free and vegan positioning are expected to represent double-digit shares of new product launches, signaling a structural shift in how renewable biopolymers are marketed in cosmetics.

Integration of Biopolymers into Specialty Retail and E-Commerce Growth Channels

Distribution trends are transforming the adoption curve. Specialty clean-beauty retailers and online platforms are increasingly prioritizing brands that can demonstrate renewable biopolymer usage across formulations and packaging. For instance, leading clean-beauty chains in Europe and the USA now use renewable content and biodegradable certifications as listing criteria, pushing suppliers to innovate faster. Simultaneously, e-commerce platforms are amplifying consumer education on sustainability, enabling renewable biopolymer products to gain visibility beyond niche audiences. The ability of e-commerce to communicate detailed product stories including lifecycle benefits and eco-certification details makes it a critical enabler of demand growth. By 2035, e-commerce and specialty clean-beauty retail combined are expected to account for over 40% of global renewable biopolymer cosmetics sales, solidifying distribution as a structural trend rather than a channel shift.
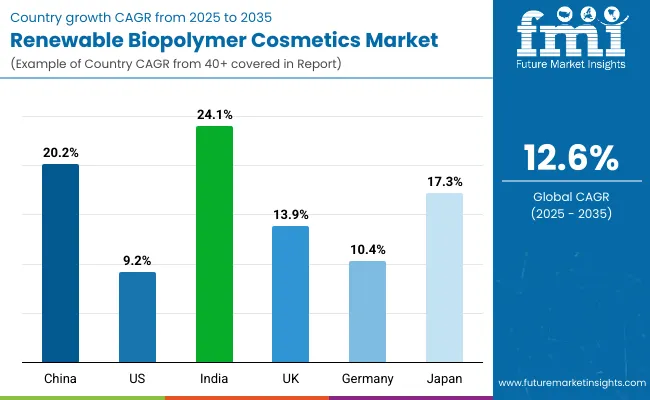
Analysis of Global Renewable Biopolymer Cosmetics Market By Key Countries

Country Wise Analysis Renewable Biopolymer Cosmetics Market

Countries Estimated CAGR (2025 to 2035)
China 20.2%
USA 9.2%
India 24.1%
UK 13.9%
Germany 10.4%
Japan 17.3%

The global Renewable Biopolymer Cosmetics Market shows sharp differences in growth rates across countries, reflecting regional maturity, regulatory dynamics, and consumer behavior. India (24.1% CAGR) and China (20.2% CAGR) are the fastest-growing markets, driven by rising middle-class consumption, rapid adoption of clean-beauty formulations, and expanding e-commerce penetration. Both countries are seeing aggressive entry of local and multinational brands that highlight biodegradable and eco-certified claims to attract younger demographics. India’s growth is also fueled by increasing government support for biodegradable materials, while China benefits from large-scale manufacturing capacity that accelerates cost-effective adoption. Japan (17.3% CAGR) also emerges as a strong growth hub, supported by its innovation-led cosmetics sector and consumer demand for advanced functional ingredients like biopolymer-based film-formers and texture enhancers.

In contrast, mature markets such as the USA (9.2% CAGR), Germany (10.4% CAGR), and the UK (13.9% CAGR) are expanding more steadily. Growth in these countries is anchored in regulatory enforcement, brand sustainability commitments, and the gradual replacement of synthetic polymers in mainstream product lines. The USA continues to represent the largest market in absolute terms, but growth is moderated by its already significant adoption base and price sensitivity in mass retail. Europe, particularly Germany and the UK, benefits from strong clean-beauty retail channels and early consumer acceptance of palm-free and vegan claims, though saturation in premium segments keeps CAGR lower than Asia. Overall, the mix of high-growth emerging markets and steady developed markets highlights a two-speed expansion, where Asia-Pacific leads volume-driven acceleration while North America and Europe anchor long-term regulatory and premium positioning.
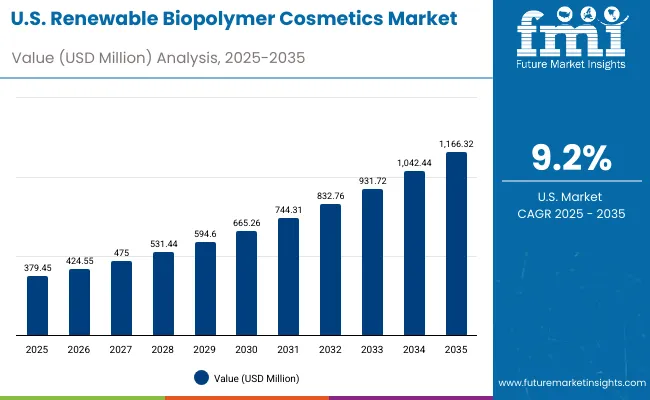
Sales Outlook for Renewable Biopolymer Cosmetics in the United States

Usa Renewable Biopolymer Cosmetics Market

Year USA Renewable Biopolymer Cosmetics Market (USD Million)
2025 379.45
2026 424.55
2027 475.00
2028 531.44
2029 594.60
2030 665.26
2031 744.31
2032 832.76
2033 931.72
2034 1,042.44
2035 1,166.32

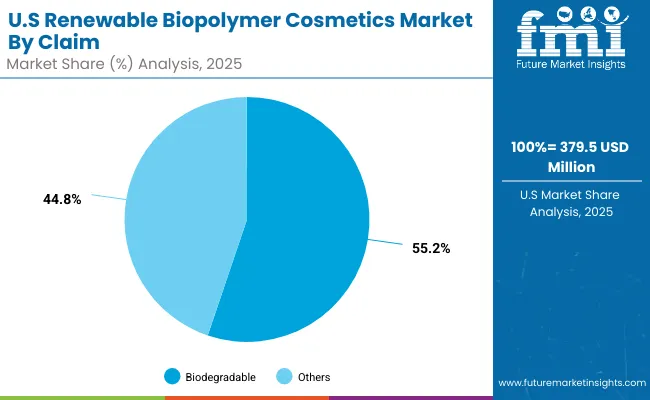
The Renewable Biopolymer Cosmetics Market in the United States is projected to grow at a CAGR of 9.2%, led by increased investment across skincare, haircare, and sun care categories. Biodegradable claims accounted for 55.2% of the USA market in 2025 (USD 209.3 million), reflecting consumer preference for eco-friendly everyday products. Retail adoption is expanding as mass retail and pharmacy chains accelerate shelf space for eco-certified and palm-free product lines. Meanwhile, indie clean-beauty brands are using biopolymer-based packaging to differentiate themselves in crowded e-commerce channels. Growth is also fueled by USA regulatory momentum, with state level restrictions on microplastics pushing large brands to reformulate.

  • Biodegradable claims dominate USA demand, with over half the 2025 market share.
  • Pharmacy and mass retail channels are key in mainstream adoption.
  • Indie beauty brands are leveraging biopolymer packaging for differentiation.

Growth and Expansion Outlook for Renewable Biopolymer Cosmetics in the United Kingdom

The Renewable Biopolymer Cosmetics Market in the United Kingdom is expected to grow at a CAGR of 13.9%, supported by demand in creams/lotions and haircare gels. Leading British skincare and haircare companies are rapidly moving toward palm-free and vegan-certified biopolymers to align with both consumer sentiment and UK environmental policies. Heritage brands are collaborating with packaging innovators to replace plastic jars and tubes with PLA- and starch-based biodegradable alternatives, often co-branded with eco-certifications. Specialty clean-beauty retailers dominate distribution, while e-commerce platforms provide transparency on sourcing and certifications, enhancing consumer trust.

  • Palm-free and vegan claims are shaping brand positioning in the UK
  • British heritage brands are leading adoption of biodegradable packaging.
  • Specialty clean-beauty retail channels drive strong consumer engagement.

Growth and Expansion Outlook for Renewable Biopolymer Cosmetics in India

India is witnessing rapid growth in the Renewable Biopolymer Cosmetics Market, which is forecast to expand at a CAGR of 24.1% through 2035. Expansion is fueled by tier-2 city adoption, as affordable clean-beauty products and biodegradable packaging reach beyond metro markets. Domestic brands are integrating starch-based and chitosan-derived polymers into affordable lotions and gels, offering sustainable products at competitive price points. Educational campaigns on eco-labels and government-backed initiatives on biodegradable plastics further reinforce demand. Local startups are positioning renewable biopolymer cosmetics as vegan, palm-free, and eco-certified, capturing younger urban consumers.

  • Tier-2 city consumers are adopting affordable biodegradable beauty products.
  • Local startups are expanding vegan and eco-certified offerings.
  • Government support and awareness campaigns accelerate biodegradable adoption.

Sales Outlook for Renewable Biopolymer Cosmetics in China

The Renewable Biopolymer Cosmetics Market in China is expected to grow at a CAGR of 20.2%, the highest among leading economies. Growth is driven by smart retail platforms, e-commerce penetration, and domestic innovation in film-formers and emulsifiers. Local manufacturers are scaling cost-effective PLA and PHA production, which reduces dependency on imports and accelerates adoption in mainstream cosmetics. Municipal initiatives on plastic reduction are encouraging brands to adopt biodegradable packaging, particularly for mass-market skincare. Competitive pricing by domestic suppliers enables biopolymer integration into color cosmetics and haircare gels, making sustainability accessible at scale.

  • E-commerce platforms drive adoption by highlighting eco-certifications.
  • Local manufacturers scale cost-efficient PLA and PHA for mainstream brands.
  • Biodegradable packaging adoption is pushed by municipal plastic-reduction programs.
Countries 2025 Share (%)
USA 22.3%
China 11.9%
Japan 7.0%
Germany 15.4%
UK 8.5%
India 5.3%
Countries 2035 Share (%)
USA 20.8%
China 12.9%
Japan 9.9%
Germany 13.4%
UK 7.7%
India 5.9%

Growth Outlook for Renewable Biopolymer Cosmetics Market in the United States

Usa Renewable Biopolymer Cosmetics Market By Claim

USA by Claim Value Share% 2025
Biodegradable 55.2%
Others 44.8%

The Renewable Biopolymer Cosmetics Market in the United States is projected at USD 379.5 million in 2025, growing at a CAGR of 9.2% through 2035. Biodegradable claims dominate with 55.2% share (USD 209.3 million), reflecting the strong influence of consumer awareness around microplastic pollution and environmental safety. This leadership is underpinned by widespread integration of PLA- and starch-based film-formers into mainstream skincare and sun care formulations. Mass retail chains and pharmacy outlets are accelerating adoption by allocating shelf space to eco-certified and palm-free brands, while specialty clean-beauty retailers drive premium positioning.

The USA market reflects a balanced mix between mainstream and indie innovation. Larger cosmetic brands emphasize scalable biodegradable packaging, while indie players leverage vegan and palm-free claims to capture younger demographics. The regulatory backdrop is also favorable, with several USA states pushing bans on non-biodegradable microplastics in cosmetics, driving rapid reformulation across mass and premium segments. By 2030, a significant portion of USA skincare and color cosmetics is expected to feature renewable biopolymers as a baseline expectation, not just a premium differentiator.
  • Market in the USA accounts for 22.3% of global share in 2025.
  • Biodegradable claims lead with 55.2% vs. 44.8% for others.
  • Growth is supported by state-level bans on microplastics and mass retail expansion.

Opportunity Analysis of China Renewable Biopolymer Cosmetics Market

China Renewable Biopolymer Cosmetics Market By Function

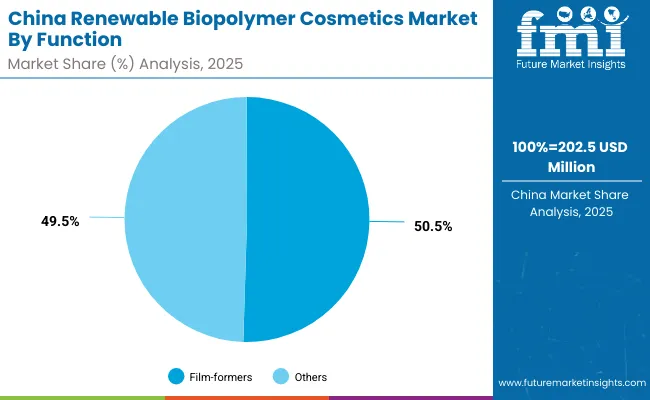
China by Function Value Share% 2025
Film-formers 50.5%
Others 49.5%

The Renewable Biopolymer Cosmetics Market in China is projected at USD 202.5 million in 2025, growing at a CAGR of 20.2%, the highest among major economies. Film-formers contribute 50.5% (USD 102.2 million), showing the strong pull from skincare and sun care formulations that rely heavily on water resistance and uniform skin coverage. The dominance of film-formers stems from the country’s large demand base in daily skincare and sun protection products, which are essential in urban markets with rising pollution and UV exposure concerns.

China’s opportunity lies in both demand and supply. Local manufacturers are scaling PLA and PHA capacity, offering cost-competitive inputs that reduce dependence on imports. E-commerce giants such as Tmall and JD.com amplify the market by promoting eco-certified and vegan-labeled beauty products, giving biopolymer-based cosmetics high visibility. Municipal policies on plastic waste reduction further accelerate adoption of biodegradable packaging systems. This combination of strong local supply, government policy, and consumer pull positions China as a core global hub for renewable biopolymer cosmetics.
  • Market size for China in 2025 is USD 202.5 million.
  • Global market share is approximately 11.9% in 2025, rising to 12.9% by 2035.
  • Film-formers dominate at 50.5% share due to daily skincare and sun care demand.

Competitive Landscape of Global Renewable Biopolymer Cosmetics Market

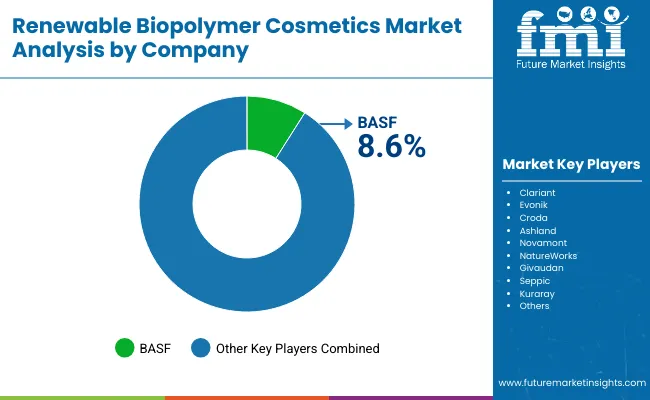
Renewable Biopolymer Cosmetics Market By Company

Company Global Value Share 2025
BASF 8.6%
Others 91.4%

The global Renewable Biopolymer Cosmetics Market is moderately fragmented, with a mix of global chemical leaders, biopolymer specialists, and cosmetic ingredient innovators competing for share. Global leaders such as BASF, Clariant, Evonik, and Croda hold significant market presence, driven by their established portfolios in PLA- and starch-based biopolymers and their ability to integrate into mass-market cosmetic supply chains. Their strategies increasingly emphasize biodegradable packaging systems, vegan-certified functional ingredients, and palm-free supply chain traceability, positioning them as the backbone of global adoption.

Mid-sized innovators such as Novamont, NatureWorks, Givaudan, and Seppic are carving out niches with advanced PHA and chitosan derivatives tailored for texture enhancement and clean-label emulsification. These companies benefit from strong R&D pipelines and close partnerships with clean-beauty brands that demand agility and rapid certification alignment. Kuraray and Ashland focus on high-performance polymers and emulsifiers, catering to color cosmetics and haircare segments where stability and sensory quality are critical.

Competitive differentiation is shifting from simple material supply to ecosystem-building around certifications, regulatory compliance, and brand alignment. Vendors offering renewable biopolymers with multi-certification portfolios (EcoCert, COSMOS, palm-free verification) gain preference from multinational brands aiming to harmonize global launches. Furthermore, partnerships between raw material suppliers and cosmetic giants are strengthening ensuring scalability, cost efficiency, and co-branding opportunities. The competitive edge is no longer just about material innovation but about lifecycle sustainability, regulatory readiness, and market storytelling.

Key Developments in Global Renewable Biopolymer Cosmetics Market

  • On March 18, 2025, NatureWorks launched the Ingeo Extend platform, introducing Ingeo Extend 4950D, a new PLA grade that enables faster biodegradation/disintegration of BOPLA films (up to ~8× faster than previous PLA grades), along with improved production efficiency and better mechanical properties (including higher stretch in the transverse direction).
  • On October 18, 2023, NatureWorks announced it is proceeding with construction on a fully integrated PLA biopolymer manufacturing facility in NakhonSawan Province, Thailand. The facility (to start full production in 2025) will include lactic acid fermentation, lactide monomer production, and polymerization, with an annual capacity of 75,000 tons of Ingeo biopolymer. Feedstock will be sugarcane, sourced locally.

Scope of the Report

Item Value
Quantitative Units USD 1,703.5 Million
Polymer Type PLA (polylactic acid), PHA (polyhydroxyalkanoates), Chitosan derivatives, Starch-based biopolymers
Function Film-formers, Emulsifiers, Texture enhancers, Biodegradable packaging systems
Application Creams/lotions, Haircare gels, Color cosmetics, Sun care
Channel E-commerce, Mass retail, Specialty clean-beauty retail, Pharmacies
Claim Biodegradable, Eco-certified, Vegan, Palm-free
Regions Covered North America, Europe, Asia-Pacific, Latin America, Middle East & Africa
Country Covered United States, Canada, Germany, France, United Kingdom, China, Japan, India, Brazil, South Africa
Key Companies Profiled BASF, Clariant, Evonik, Croda, Ashland, Novamont, NatureWorks, Givaudan, Seppic, Kuraray
Additional Attributes Dollar sales by claim, function, and application, adoption trends in biodegradable and eco-certified cosmetics, rising demand for vegan and palm-free formulations, sector-specific growth in skincare, haircare, and sun care, e-commerce and specialty clean-beauty retail channel expansion, certification-led positioning (EcoCert, COSMOS, USDA BioPreferred), integration of biodegradable packaging systems, regional trends shaped by consumer awareness and regulatory mandates, and innovations in PLA, PHA, starch, and chitosan derivatives.

Key Segmentation

By Polymer Type:

  • PLA (polylactic acid)
  • PHA (polyhydroxyalkanoates)
  • Chitosan derivatives
  • Starch-based biopolymers

By Function:

  • Film-formers
  • Emulsifiers
  • Texture enhancers
  • Biodegradable packaging systems

By Application:

  • Creams/lotions
  • Haircare gels
  • Color cosmetics
  • Sun care

By Channel:

  • E-commerce
  • Mass retail
  • Specialty clean-beauty retail
  • Pharmacies

By Claim:

  • Biodegradable
  • Eco-certified
  • Vegan
  • Palm-free

By Region:

  • North America
  • Latin America
  • Europe
  • East Asia
  • South Asia & Pacific
  • Middle East and Africa

Table of Content

  1. Executive Summary
    • Global Market Outlook
    • Demand-side Trends
    • Supply-side Trends
    • Technology Roadmap Analysis
    • Analysis and Recommendations
  2. Market Overview
    • Market Coverage / Taxonomy
    • Market Definition / Scope / Limitations
  3. Market Background
    • Market Dynamics
      • Drivers
      • Restraints
      • Opportunity
      • Trends
    • Scenario Forecast
      • Demand in Optimistic Scenario
      • Demand in Likely Scenario
      • Demand in Conservative Scenario
    • Opportunity Map Analysis
    • Product Life Cycle Analysis
    • Supply Chain Analysis
    • Investment Feasibility Matrix
    • Value Chain Analysis
    • PESTLE and Porter’s Analysis
    • Regulatory Landscape
    • Regional Parent Market Outlook
    • Production and Consumption Statistics
    • Import and Export Statistics
  4. Global Market Analysis 2020 to 2024 and Forecast, 2025 to 2035
    • Historical Market Size Value (USD Million) Analysis, 2020 to 2024
    • Current and Future Market Size Value (USD Million) Projections, 2025 to 2035
      • Y-o-Y Growth Trend Analysis
      • Absolute $ Opportunity Analysis
  5. Global Market Pricing Analysis 2020 to 2024 and Forecast 2025 to 2035
  6. Global Market Analysis 2020 to 2024 and Forecast 2025 to 2035, By Polymer Type
    • Introduction / Key Findings
    • Historical Market Size Value (USD Million) Analysis By Polymer Type, 2020 to 2024
    • Current and Future Market Size Value (USD Million) Analysis and Forecast By Polymer Type, 2025 to 2035
      • PLA (polylactic acid)
      • PHA (polyhydroxyalkanoates)
      • Chitosan derivatives
      • Starch-based biopolymers
    • Y-o-Y Growth Trend Analysis By Polymer Type, 2020 to 2024
    • Absolute $ Opportunity Analysis By Polymer Type, 2025 to 2035
  7. Global Market Analysis 2020 to 2024 and Forecast 2025 to 2035, By Function
    • Introduction / Key Findings
    • Historical Market Size Value (USD Million) Analysis By Function, 2020 to 2024
    • Current and Future Market Size Value (USD Million) Analysis and Forecast By Function, 2025 to 2035
      • Film-formers
      • Emulsifiers
      • Texture enhancers
      • Biodegradable packaging systems
    • Y-o-Y Growth Trend Analysis By Function, 2020 to 2024
    • Absolute $ Opportunity Analysis By Function, 2025 to 2035
  8. Global Market Analysis 2020 to 2024 and Forecast 2025 to 2035, By Application
    • Introduction / Key Findings
    • Historical Market Size Value (USD Million) Analysis By Application, 2020 to 2024
    • Current and Future Market Size Value (USD Million) Analysis and Forecast By Application, 2025 to 2035
      • Creams/lotions
      • Haircare gels
      • Color cosmetics
      • Sun care
    • Y-o-Y Growth Trend Analysis By Application, 2020 to 2024
    • Absolute $ Opportunity Analysis By Application, 2025 to 2035
  9. Global Market Analysis 2020 to 2024 and Forecast 2025 to 2035, By Channel
    • Introduction / Key Findings
    • Historical Market Size Value (USD Million) Analysis By Channel, 2020 to 2024
    • Current and Future Market Size Value (USD Million) Analysis and Forecast By Channel, 2025 to 2035
      • E-commerce
      • Mass retail
      • Specialty clean-beauty retail
      • Pharmacies
    • Y-o-Y Growth Trend Analysis By Channel, 2020 to 2024
    • Absolute $ Opportunity Analysis By Channel, 2025 to 2035
  10. Global Market Analysis 2020 to 2024 and Forecast 2025 to 2035, By Claim
    • Introduction / Key Findings
    • Historical Market Size Value (USD Million) Analysis By Claim, 2020 to 2024
    • Current and Future Market Size Value (USD Million) Analysis and Forecast By Claim, 2025 to 2035
      • Biodegradable
      • Eco-certified
      • Vegan
      • Palm-free
    • Y-o-Y Growth Trend Analysis By Claim, 2020 to 2024
    • Absolute $ Opportunity Analysis By Claim, 2025 to 2035
  11. Global Market Analysis 2020 to 2024 and Forecast 2025 to 2035, By Region
    • Introduction
    • Historical Market Size Value (USD Million) Analysis By Region, 2020 to 2024
    • Current Market Size Value (USD Million) Analysis and Forecast By Region, 2025 to 2035
      • North America
      • Latin America
      • Europe
      • East Asia
      • South Asia & Pacific
      • Middle East and Africa
    • Market Attractiveness Analysis By Region
  12. North America Market Analysis 2020 to 2024 and Forecast 2025 to 2035, By Country
    • Historical Market Size Value (USD Million) Trend Analysis By Market Taxonomy, 2020 to 2024
    • Market Size Value (USD Million) Forecast By Market Taxonomy, 2025 to 2035
      • By Country
        • USA
        • Canada
      • By Polymer Type
      • By Function
      • By Application
      • By Channel
      • By Claim
    • Market Attractiveness Analysis
      • By Country
      • By Polymer Type
      • By Function
      • By Application
      • By Channel
      • By Claim
    • Key Takeaways
  13. Latin America Market Analysis 2020 to 2024 and Forecast 2025 to 2035, By Country
    • Historical Market Size Value (USD Million) Trend Analysis By Market Taxonomy, 2020 to 2024
    • Market Size Value (USD Million) Forecast By Market Taxonomy, 2025 to 2035
      • By Country
        • Brazil
        • Mexico
        • Colombia
        • Rest of Latin America
      • By Polymer Type
      • By Function
      • By Application
      • By Channel
      • By Claim
    • Market Attractiveness Analysis
      • By Country
      • By Polymer Type
      • By Function
      • By Application
      • By Channel
      • By Claim
    • Key Takeaways
  14. Europe Market Analysis 2020 to 2024 and Forecast 2025 to 2035, By Country
    • Historical Market Size Value (USD Million) Trend Analysis By Market Taxonomy, 2020 to 2024
    • Market Size Value (USD Million) Forecast By Market Taxonomy, 2025 to 2035
      • By Country
        • Germany
        • UK
        • France
        • Italy
        • Spain
        • Belgium
        • Netherlands
        • Nordic
        • Switzerland
        • Russia
        • Poland
        • Rest of Europe
      • By Polymer Type
      • By Function
      • By Application
      • By Channel
      • By Claim
    • Market Attractiveness Analysis
      • By Country
      • By Polymer Type
      • By Function
      • By Application
      • By Channel
      • By Claim
    • Key Takeaways
  15. East Asia Market Analysis 2020 to 2024 and Forecast 2025 to 2035, By Country
    • Historical Market Size Value (USD Million) Trend Analysis By Market Taxonomy, 2020 to 2024
    • Market Size Value (USD Million) Forecast By Market Taxonomy, 2025 to 2035
      • By Country
        • China
        • Japan
        • South Korea
      • By Polymer Type
      • By Function
      • By Application
      • By Channel
      • By Claim
    • Market Attractiveness Analysis
      • By Country
      • By Polymer Type
      • By Function
      • By Application
      • By Channel
      • By Claim
    • Key Takeaways
  16. South Asia & Pacific Market Analysis 2020 to 2024 and Forecast 2025 to 2035, By Country
    • Historical Market Size Value (USD Million) Trend Analysis By Market Taxonomy, 2020 to 2024
    • Market Size Value (USD Million) Forecast By Market Taxonomy, 2025 to 2035
      • By Country
        • India
        • Thailand
        • Malaysia
        • Indonesia
        • Singapore
        • Vietnam
        • Australia
        • New Zealand
        • Rest of South Asia
      • By Polymer Type
      • By Function
      • By Application
      • By Channel
      • By Claim
    • Market Attractiveness Analysis
      • By Country
      • By Polymer Type
      • By Function
      • By Application
      • By Channel
      • By Claim
    • Key Takeaways
  17. Middle East and Africa Market Analysis 2020 to 2024 and Forecast 2025 to 2035, By Country
    • Historical Market Size Value (USD Million) Trend Analysis By Market Taxonomy, 2020 to 2024
    • Market Size Value (USD Million) Forecast By Market Taxonomy, 2025 to 2035
      • By Country
        • Turkey
        • UAE
        • Saudi Arabia
        • Israel
        • Other GCC Countries
        • North Africa
        • South Africa
      • By Polymer Type
      • By Function
      • By Application
      • By Channel
      • By Claim
    • Market Attractiveness Analysis
      • By Country
      • By Polymer Type
      • By Function
      • By Application
      • By Channel
      • By Claim
    • Key Takeaways
  18. Key Countries Market Analysis
    • USA
      • Pricing Analysis
      • Market Share Analysis, 2024
        • By Polymer Type
        • By Function
        • By Application
        • By Channel
        • By Claim
    • Canada
      • Pricing Analysis
      • Market Share Analysis, 2024
        • By Polymer Type
        • By Function
        • By Application
        • By Channel
        • By Claim
    • Mexico
      • Pricing Analysis
      • Market Share Analysis, 2024
        • By Polymer Type
        • By Function
        • By Application
        • By Channel
        • By Claim
    • Brazil
      • Pricing Analysis
      • Market Share Analysis, 2024
        • By Polymer Type
        • By Function
        • By Application
        • By Channel
        • By Claim
    • Chile
      • Pricing Analysis
      • Market Share Analysis, 2024
        • By Polymer Type
        • By Function
        • By Application
        • By Channel
        • By Claim
    • Germany
      • Pricing Analysis
      • Market Share Analysis, 2024
        • By Polymer Type
        • By Function
        • By Application
        • By Channel
        • By Claim
    • UK
      • Pricing Analysis
      • Market Share Analysis, 2024
        • By Polymer Type
        • By Function
        • By Application
        • By Channel
        • By Claim
    • Italy
      • Pricing Analysis
      • Market Share Analysis, 2024
        • By Polymer Type
        • By Function
        • By Application
        • By Channel
        • By Claim
    • Spain
      • Pricing Analysis
      • Market Share Analysis, 2024
        • By Polymer Type
        • By Function
        • By Application
        • By Channel
        • By Claim
    • France
      • Pricing Analysis
      • Market Share Analysis, 2024
        • By Polymer Type
        • By Function
        • By Application
        • By Channel
        • By Claim
    • India
      • Pricing Analysis
      • Market Share Analysis, 2024
        • By Polymer Type
        • By Function
        • By Application
        • By Channel
        • By Claim
    • ASEAN
      • Pricing Analysis
      • Market Share Analysis, 2024
        • By Polymer Type
        • By Function
        • By Application
        • By Channel
        • By Claim
    • Australia & New Zealand
      • Pricing Analysis
      • Market Share Analysis, 2024
        • By Polymer Type
        • By Function
        • By Application
        • By Channel
        • By Claim
    • China
      • Pricing Analysis
      • Market Share Analysis, 2024
        • By Polymer Type
        • By Function
        • By Application
        • By Channel
        • By Claim
    • Japan
      • Pricing Analysis
      • Market Share Analysis, 2024
        • By Polymer Type
        • By Function
        • By Application
        • By Channel
        • By Claim
    • South Korea
      • Pricing Analysis
      • Market Share Analysis, 2024
        • By Polymer Type
        • By Function
        • By Application
        • By Channel
        • By Claim
    • Russia
      • Pricing Analysis
      • Market Share Analysis, 2024
        • By Polymer Type
        • By Function
        • By Application
        • By Channel
        • By Claim
    • Poland
      • Pricing Analysis
      • Market Share Analysis, 2024
        • By Polymer Type
        • By Function
        • By Application
        • By Channel
        • By Claim
    • Hungary
      • Pricing Analysis
      • Market Share Analysis, 2024
        • By Polymer Type
        • By Function
        • By Application
        • By Channel
        • By Claim
    • Kingdom of Saudi Arabia
      • Pricing Analysis
      • Market Share Analysis, 2024
        • By Polymer Type
        • By Function
        • By Application
        • By Channel
        • By Claim
    • Turkiye
      • Pricing Analysis
      • Market Share Analysis, 2024
        • By Polymer Type
        • By Function
        • By Application
        • By Channel
        • By Claim
    • South Africa
      • Pricing Analysis
      • Market Share Analysis, 2024
        • By Polymer Type
        • By Function
        • By Application
        • By Channel
        • By Claim
  19. Market Structure Analysis
    • Competition Dashboard
    • Competition Benchmarking
    • Market Share Analysis of Top Players
      • By Regional
      • By Polymer Type
      • By Function
      • By Application
      • By Channel
      • By Claim
  20. Competition Analysis
    • Competition Deep Dive
      • BASF
        • Overview
        • Product Portfolio
        • Profitability by Market Segments (Product/Age /Sales Channel/Region)
        • Sales Footprint
        • Strategy Overview
        • Clariant
        • Evonik
        • Croda
        • Ashland
        • Novamont
        • NatureWorks
        • Givaudan
        • Seppic
        • Kuraray
  21. Assumptions & Acronyms Used
  22. Research Methodology

List of Tables

  • Table 1: Global Market Value (USD Million) Forecast by Region, 2020-2035
  • Table 2: Global Market Value (USD Million) Forecast by Polymer Type, 2020-2035
  • Table 3: Global Market Value (USD Million) Forecast by Function, 2020-2035
  • Table 4: Global Market Value (USD Million) Forecast by Application, 2020-2035
  • Table 5: Global Market Value (USD Million) Forecast by Channel, 2020-2035
  • Table 6: Global Market Value (USD Million) Forecast by Claim, 2020-2035
  • Table 7: North America Market Value (USD Million) Forecast by Country, 2020-2035
  • Table 8: North America Market Value (USD Million) Forecast by Polymer Type, 2020-2035
  • Table 9: North America Market Value (USD Million) Forecast by Function, 2020-2035
  • Table 10: North America Market Value (USD Million) Forecast by Application, 2020-2035
  • Table 11: North America Market Value (USD Million) Forecast by Channel, 2020-2035
  • Table 12: North America Market Value (USD Million) Forecast by Claim, 2020-2035
  • Table 13: Latin America Market Value (USD Million) Forecast by Country, 2020-2035
  • Table 14: Latin America Market Value (USD Million) Forecast by Polymer Type, 2020-2035
  • Table 15: Latin America Market Value (USD Million) Forecast by Function, 2020-2035
  • Table 16: Latin America Market Value (USD Million) Forecast by Application, 2020-2035
  • Table 17: Latin America Market Value (USD Million) Forecast by Channel, 2020-2035
  • Table 18: Latin America Market Value (USD Million) Forecast by Claim, 2020-2035
  • Table 19: Europe Market Value (USD Million) Forecast by Country, 2020-2035
  • Table 20: Europe Market Value (USD Million) Forecast by Polymer Type, 2020-2035
  • Table 21: Europe Market Value (USD Million) Forecast by Function, 2020-2035
  • Table 22: Europe Market Value (USD Million) Forecast by Application, 2020-2035
  • Table 23: Europe Market Value (USD Million) Forecast by Channel, 2020-2035
  • Table 24: Europe Market Value (USD Million) Forecast by Claim, 2020-2035
  • Table 25: East Asia Market Value (USD Million) Forecast by Country, 2020-2035
  • Table 26: East Asia Market Value (USD Million) Forecast by Polymer Type, 2020-2035
  • Table 27: East Asia Market Value (USD Million) Forecast by Function, 2020-2035
  • Table 28: East Asia Market Value (USD Million) Forecast by Application, 2020-2035
  • Table 29: East Asia Market Value (USD Million) Forecast by Channel, 2020-2035
  • Table 30: East Asia Market Value (USD Million) Forecast by Claim, 2020-2035
  • Table 31: South Asia & Pacific Market Value (USD Million) Forecast by Country, 2020-2035
  • Table 32: South Asia & Pacific Market Value (USD Million) Forecast by Polymer Type, 2020-2035
  • Table 33: South Asia & Pacific Market Value (USD Million) Forecast by Function, 2020-2035
  • Table 34: South Asia & Pacific Market Value (USD Million) Forecast by Application, 2020-2035
  • Table 35: South Asia & Pacific Market Value (USD Million) Forecast by Channel, 2020-2035
  • Table 36: South Asia & Pacific Market Value (USD Million) Forecast by Claim, 2020-2035
  • Table 37: Middle East and Africa Market Value (USD Million) Forecast by Country, 2020-2035
  • Table 38: Middle East and Africa Market Value (USD Million) Forecast by Polymer Type, 2020-2035
  • Table 39: Middle East and Africa Market Value (USD Million) Forecast by Function, 2020-2035
  • Table 40: Middle East and Africa Market Value (USD Million) Forecast by Application, 2020-2035
  • Table 41: Middle East and Africa Market Value (USD Million) Forecast by Channel, 2020-2035
  • Table 42: Middle East and Africa Market Value (USD Million) Forecast by Claim, 2020-2035

List of Figures

  • Figure 1: Global Market Pricing Analysis
  • Figure 2: Global Market Value (USD Million) Forecast 2020-2035
  • Figure 3: Global Market Value Share and BPS Analysis by Polymer Type, 2025 and 2035
  • Figure 4: Global Market Y-o-Y Growth Comparison by Polymer Type, 2025-2035
  • Figure 5: Global Market Attractiveness Analysis by Polymer Type
  • Figure 6: Global Market Value Share and BPS Analysis by Function, 2025 and 2035
  • Figure 7: Global Market Y-o-Y Growth Comparison by Function, 2025-2035
  • Figure 8: Global Market Attractiveness Analysis by Function
  • Figure 9: Global Market Value Share and BPS Analysis by Application, 2025 and 2035
  • Figure 10: Global Market Y-o-Y Growth Comparison by Application, 2025-2035
  • Figure 11: Global Market Attractiveness Analysis by Application
  • Figure 12: Global Market Value Share and BPS Analysis by Channel, 2025 and 2035
  • Figure 13: Global Market Y-o-Y Growth Comparison by Channel, 2025-2035
  • Figure 14: Global Market Attractiveness Analysis by Channel
  • Figure 15: Global Market Value Share and BPS Analysis by Claim, 2025 and 2035
  • Figure 16: Global Market Y-o-Y Growth Comparison by Claim, 2025-2035
  • Figure 17: Global Market Attractiveness Analysis by Claim
  • Figure 18: Global Market Value (USD Million) Share and BPS Analysis by Region, 2025 and 2035
  • Figure 19: Global Market Y-o-Y Growth Comparison by Region, 2025-2035
  • Figure 20: Global Market Attractiveness Analysis by Region
  • Figure 21: North America Market Incremental $ Opportunity, 2025-2035
  • Figure 22: Latin America Market Incremental $ Opportunity, 2025-2035
  • Figure 23: Europe Market Incremental $ Opportunity, 2025-2035
  • Figure 24: East Asia Market Incremental $ Opportunity, 2025-2035
  • Figure 25: South Asia & Pacific Market Incremental $ Opportunity, 2025-2035
  • Figure 26: Middle East and Africa Market Incremental $ Opportunity, 2025-2035
  • Figure 27: North America Market Value Share and BPS Analysis by Country, 2025 and 2035
  • Figure 28: North America Market Value Share and BPS Analysis by Polymer Type, 2025 and 2035
  • Figure 29: North America Market Y-o-Y Growth Comparison by Polymer Type, 2025-2035
  • Figure 30: North America Market Attractiveness Analysis by Polymer Type
  • Figure 31: North America Market Value Share and BPS Analysis by Function, 2025 and 2035
  • Figure 32: North America Market Y-o-Y Growth Comparison by Function, 2025-2035
  • Figure 33: North America Market Attractiveness Analysis by Function
  • Figure 34: North America Market Value Share and BPS Analysis by Application, 2025 and 2035
  • Figure 35: North America Market Y-o-Y Growth Comparison by Application, 2025-2035
  • Figure 36: North America Market Attractiveness Analysis by Application
  • Figure 37: North America Market Value Share and BPS Analysis by Channel, 2025 and 2035
  • Figure 38: North America Market Y-o-Y Growth Comparison by Channel, 2025-2035
  • Figure 39: North America Market Attractiveness Analysis by Channel
  • Figure 40: North America Market Value Share and BPS Analysis by Claim, 2025 and 2035
  • Figure 41: North America Market Y-o-Y Growth Comparison by Claim, 2025-2035
  • Figure 42: North America Market Attractiveness Analysis by Claim
  • Figure 43: Latin America Market Value Share and BPS Analysis by Country, 2025 and 2035
  • Figure 44: Latin America Market Value Share and BPS Analysis by Polymer Type, 2025 and 2035
  • Figure 45: Latin America Market Y-o-Y Growth Comparison by Polymer Type, 2025-2035
  • Figure 46: Latin America Market Attractiveness Analysis by Polymer Type
  • Figure 47: Latin America Market Value Share and BPS Analysis by Function, 2025 and 2035
  • Figure 48: Latin America Market Y-o-Y Growth Comparison by Function, 2025-2035
  • Figure 49: Latin America Market Attractiveness Analysis by Function
  • Figure 50: Latin America Market Value Share and BPS Analysis by Application, 2025 and 2035
  • Figure 51: Latin America Market Y-o-Y Growth Comparison by Application, 2025-2035
  • Figure 52: Latin America Market Attractiveness Analysis by Application
  • Figure 53: Latin America Market Value Share and BPS Analysis by Channel, 2025 and 2035
  • Figure 54: Latin America Market Y-o-Y Growth Comparison by Channel, 2025-2035
  • Figure 55: Latin America Market Attractiveness Analysis by Channel
  • Figure 56: Latin America Market Value Share and BPS Analysis by Claim, 2025 and 2035
  • Figure 57: Latin America Market Y-o-Y Growth Comparison by Claim, 2025-2035
  • Figure 58: Latin America Market Attractiveness Analysis by Claim
  • Figure 59: Europe Market Value Share and BPS Analysis by Country, 2025 and 2035
  • Figure 60: Europe Market Value Share and BPS Analysis by Polymer Type, 2025 and 2035
  • Figure 61: Europe Market Y-o-Y Growth Comparison by Polymer Type, 2025-2035
  • Figure 62: Europe Market Attractiveness Analysis by Polymer Type
  • Figure 63: Europe Market Value Share and BPS Analysis by Function, 2025 and 2035
  • Figure 64: Europe Market Y-o-Y Growth Comparison by Function, 2025-2035
  • Figure 65: Europe Market Attractiveness Analysis by Function
  • Figure 66: Europe Market Value Share and BPS Analysis by Application, 2025 and 2035
  • Figure 67: Europe Market Y-o-Y Growth Comparison by Application, 2025-2035
  • Figure 68: Europe Market Attractiveness Analysis by Application
  • Figure 69: Europe Market Value Share and BPS Analysis by Channel, 2025 and 2035
  • Figure 70: Europe Market Y-o-Y Growth Comparison by Channel, 2025-2035
  • Figure 71: Europe Market Attractiveness Analysis by Channel
  • Figure 72: Europe Market Value Share and BPS Analysis by Claim, 2025 and 2035
  • Figure 73: Europe Market Y-o-Y Growth Comparison by Claim, 2025-2035
  • Figure 74: Europe Market Attractiveness Analysis by Claim
  • Figure 75: East Asia Market Value Share and BPS Analysis by Country, 2025 and 2035
  • Figure 76: East Asia Market Value Share and BPS Analysis by Polymer Type, 2025 and 2035
  • Figure 77: East Asia Market Y-o-Y Growth Comparison by Polymer Type, 2025-2035
  • Figure 78: East Asia Market Attractiveness Analysis by Polymer Type
  • Figure 79: East Asia Market Value Share and BPS Analysis by Function, 2025 and 2035
  • Figure 80: East Asia Market Y-o-Y Growth Comparison by Function, 2025-2035
  • Figure 81: East Asia Market Attractiveness Analysis by Function
  • Figure 82: East Asia Market Value Share and BPS Analysis by Application, 2025 and 2035
  • Figure 83: East Asia Market Y-o-Y Growth Comparison by Application, 2025-2035
  • Figure 84: East Asia Market Attractiveness Analysis by Application
  • Figure 85: East Asia Market Value Share and BPS Analysis by Channel, 2025 and 2035
  • Figure 86: East Asia Market Y-o-Y Growth Comparison by Channel, 2025-2035
  • Figure 87: East Asia Market Attractiveness Analysis by Channel
  • Figure 88: East Asia Market Value Share and BPS Analysis by Claim, 2025 and 2035
  • Figure 89: East Asia Market Y-o-Y Growth Comparison by Claim, 2025-2035
  • Figure 90: East Asia Market Attractiveness Analysis by Claim
  • Figure 91: South Asia & Pacific Market Value Share and BPS Analysis by Country, 2025 and 2035
  • Figure 92: South Asia & Pacific Market Value Share and BPS Analysis by Polymer Type, 2025 and 2035
  • Figure 93: South Asia & Pacific Market Y-o-Y Growth Comparison by Polymer Type, 2025-2035
  • Figure 94: South Asia & Pacific Market Attractiveness Analysis by Polymer Type
  • Figure 95: South Asia & Pacific Market Value Share and BPS Analysis by Function, 2025 and 2035
  • Figure 96: South Asia & Pacific Market Y-o-Y Growth Comparison by Function, 2025-2035
  • Figure 97: South Asia & Pacific Market Attractiveness Analysis by Function
  • Figure 98: South Asia & Pacific Market Value Share and BPS Analysis by Application, 2025 and 2035
  • Figure 99: South Asia & Pacific Market Y-o-Y Growth Comparison by Application, 2025-2035
  • Figure 100: South Asia & Pacific Market Attractiveness Analysis by Application
  • Figure 101: South Asia & Pacific Market Value Share and BPS Analysis by Channel, 2025 and 2035
  • Figure 102: South Asia & Pacific Market Y-o-Y Growth Comparison by Channel, 2025-2035
  • Figure 103: South Asia & Pacific Market Attractiveness Analysis by Channel
  • Figure 104: South Asia & Pacific Market Value Share and BPS Analysis by Claim, 2025 and 2035
  • Figure 105: South Asia & Pacific Market Y-o-Y Growth Comparison by Claim, 2025-2035
  • Figure 106: South Asia & Pacific Market Attractiveness Analysis by Claim
  • Figure 107: Middle East and Africa Market Value Share and BPS Analysis by Country, 2025 and 2035
  • Figure 108: Middle East and Africa Market Value Share and BPS Analysis by Polymer Type, 2025 and 2035
  • Figure 109: Middle East and Africa Market Y-o-Y Growth Comparison by Polymer Type, 2025-2035
  • Figure 110: Middle East and Africa Market Attractiveness Analysis by Polymer Type
  • Figure 111: Middle East and Africa Market Value Share and BPS Analysis by Function, 2025 and 2035
  • Figure 112: Middle East and Africa Market Y-o-Y Growth Comparison by Function, 2025-2035
  • Figure 113: Middle East and Africa Market Attractiveness Analysis by Function
  • Figure 114: Middle East and Africa Market Value Share and BPS Analysis by Application, 2025 and 2035
  • Figure 115: Middle East and Africa Market Y-o-Y Growth Comparison by Application, 2025-2035
  • Figure 116: Middle East and Africa Market Attractiveness Analysis by Application
  • Figure 117: Middle East and Africa Market Value Share and BPS Analysis by Channel, 2025 and 2035
  • Figure 118: Middle East and Africa Market Y-o-Y Growth Comparison by Channel, 2025-2035
  • Figure 119: Middle East and Africa Market Attractiveness Analysis by Channel
  • Figure 120: Middle East and Africa Market Value Share and BPS Analysis by Claim, 2025 and 2035
  • Figure 121: Middle East and Africa Market Y-o-Y Growth Comparison by Claim, 2025-2035
  • Figure 122: Middle East and Africa Market Attractiveness Analysis by Claim
  • Figure 123: Global Market - Tier Structure Analysis
  • Figure 124: Global Market - Company Share Analysis

Frequently Asked Questions

How big is the global Renewable Biopolymer Cosmetics Market in 2025?

The global Renewable Biopolymer Cosmetics Market is estimated to be valued at USD 1,703.5 million in 2025.

What will be the size of the global Renewable Biopolymer Cosmetics Market in 2035?

The market size for the global Renewable Biopolymer Cosmetics Market is projected to reach USD 5,601.8 million by 2035.

How much will be the global Renewable Biopolymer Cosmetics Market growth between 2025 and 2035?

The global Renewable Biopolymer Cosmetics Market is expected to grow at a 12.6% CAGR between 2025 and 2035.

What are the key polymer types in the global Renewable Biopolymer Cosmetics Market?

The key polymer types in the global Renewable Biopolymer Cosmetics Market are PLA, PHA, chitosan derivatives, and starch-based biopolymers.

Which claim segment is expected to contribute significant share in the global Renewable Biopolymer Cosmetics Market in 2025?

In terms of claims, the biodegradable segment is expected to command 52.3% share in the global Renewable Biopolymer Cosmetics Market in 2025.

Explore Similar Insights

Future Market Insights

Renewable Biopolymer Cosmetics Market

Chat With

MaRIA

Hi There, I am MaRIA, Your Market Research Intelligence Assistant. How may I help you?