The bioplastic and biopolymer market is witnessing robust expansion, fueled by increasing environmental awareness, regulatory pressure to reduce plastic waste, and growing corporate commitments toward sustainable materials. Rising demand from packaging, consumer goods, and agricultural sectors is driving large-scale adoption of bio-based alternatives to traditional petrochemical plastics.
Technological advancements in polymerization processes and improved feedstock sourcing have enhanced product performance, bridging the gap with conventional plastics in terms of durability and functionality. Governments worldwide are supporting the industry through incentives, bans on single-use plastics, and mandates for recyclable content.
The market outlook remains favorable as major manufacturers scale production capacities to meet surging demand from eco-conscious brands and retailers. Expanding applications in automotive interiors, medical packaging, and textiles further underline the long-term growth potential of bioplastics and biopolymers.
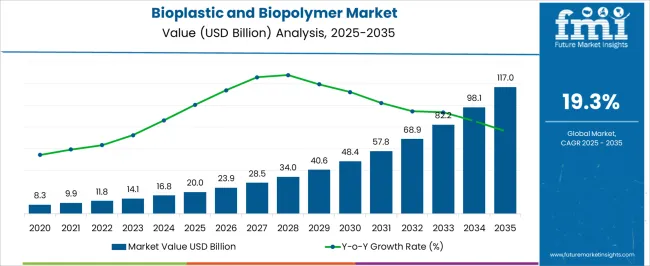
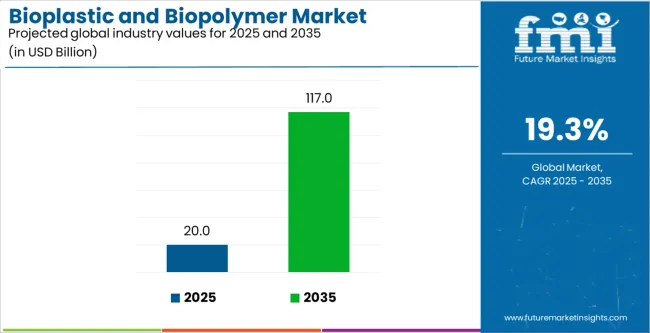
| Metric | Value |
|---|---|
| Bioplastic and Biopolymer Market Estimated Value in (2025 E) | USD 20.0 billion |
| Bioplastic and Biopolymer Market Forecast Value in (2035 F) | USD 117.0 billion |
| Forecast CAGR (2025 to 2035) | 19.3% |
The market is segmented by Type and End-Use Industry and region. By Type, the market is divided into Biodegradable, Non-Biodegradable, and Others. In terms of End-Use Industry, the market is classified into Packaging, Consumer Goods, Automotive And Transportation, Textile, Agriculture, and Others. Regionally, the market is classified into North America, Latin America, Western Europe, Eastern Europe, Balkan & Baltic Countries, Russia & Belarus, Central Asia, East Asia, South Asia & Pacific, and the Middle East & Africa.
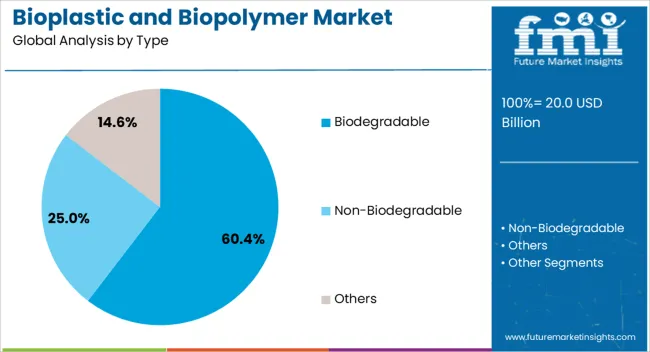
The biodegradable segment leads the type category, accounting for approximately 60.40% share of the bioplastic and biopolymer market. This dominance is attributed to increasing preference for compostable materials in packaging, agriculture, and disposable products.
The segment benefits from heightened environmental regulation and strong consumer demand for sustainable solutions. Biodegradable polymers such as PLA and PHA are being increasingly utilized due to their lower carbon footprint and compatibility with existing waste management systems.
Continuous innovation in blending and processing techniques has improved material strength and flexibility, making them suitable for diverse industrial applications. With rising restrictions on single-use plastics and a growing global push for circular economy initiatives, the biodegradable segment is expected to retain its leadership throughout the forecast period.
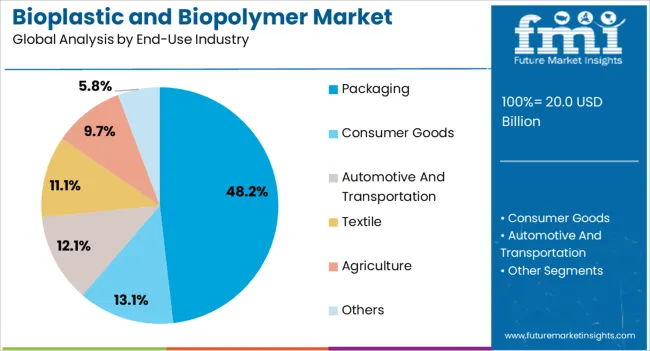
The packaging segment dominates the end-use industry category with approximately 48.20% share, driven by widespread adoption of bioplastics in food, beverage, and consumer goods packaging. The shift toward sustainable packaging solutions is motivated by both environmental concerns and brand-driven sustainability targets.
Biopolymers are increasingly replacing conventional plastics in bottles, films, and containers due to their biodegradability and reduced ecological impact. Investments in bio-based packaging technologies by major FMCG companies have further reinforced market penetration.
Regulatory mandates requiring recyclable or compostable materials in food packaging also support growth. As demand for environmentally responsible packaging continues to escalate, the packaging segment is projected to remain the largest contributor to the bioplastic and biopolymer market.
The scope for global bioplastic and biopolymer market insights expanded at a 23.3% CAGR between 2020 and 2025. The market is anticipated to develop at a CAGR of 19.3% over the forecast period from 2025 to 2035.
| Historical CAGR from 2020 to 2025 | 23.3% |
|---|---|
| Forecast CAGR from 2025 to 2035 | 19.3% |
Between 2020 and 2025, the global market exhibited a significant growth trajectory, expanding at an impressive CAGR of 23.3%. This surge reflects a heightened adoption of sustainable practices driven by increasing environmental awareness, stringent regulations, and a growing preference for eco-friendly alternatives.
The historical analysis of the market underscores robust development and the emergence of bioplastics and biopolymers as key players in the broader materials industry.
The market forecast from 2025 to 2035 anticipates continued growth, albeit at a slightly moderated CAGR of 19.3%. This projection aligns with the ongoing global commitment to sustainability and the escalating demand for environmentally friendly solutions.
Factors such as technological advancements, diversified applications, and a sustained focus on reducing carbon footprints are expected to sustain the momentum of the market, marking the next decade as a pivotal period for the widespread integration of bioplastics and biopolymers across various industries.
| Attributes | Details |
|---|---|
| Drivers |
|
The presented table highlights the CAGRs led by five key countries, with the United States, Japan, China, the United Kingdom, and South Korea taking the forefront.
South Korea emerges as a dynamic and rapidly advancing market, projecting substantial growth with an impressive 22.1% CAGR expected by 2035. Renowned for its commitment to innovation, the country plays a pivotal role across diverse industries, exemplifying a flourishing economic landscape in its ongoing evolution.
The substantial CAGR underscores the proactive stance of South Korea in adopting and driving market advancements, positioning itself as a significant contributor to the global sustainable materials industry.
| Countries | CAGR by 2035 |
|---|---|
| The United States | 19.6% |
| Japan | 21.1% |
| China | 19.9% |
| The United Kingdom | 20.6% |
| South Korea | 22.1% |
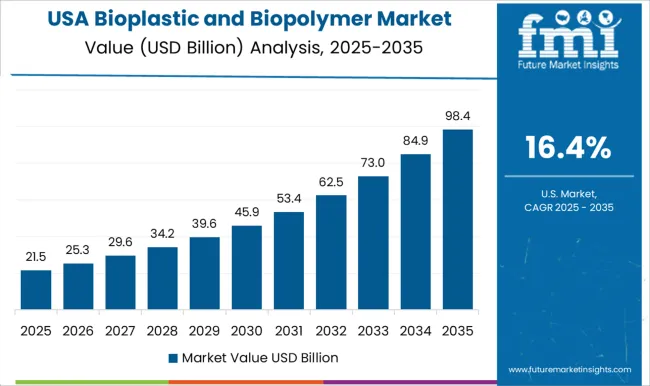
In the United States, the robust market growth is driven by a combination of environmental consciousness and stringent regulations. As a global economic powerhouse, the United States has witnessed a significant shift toward sustainable practices, with businesses prioritizing the adoption of bioplastics to meet consumer expectations and comply with regulatory requirements.
The market growth is further propelled by technological innovations and a strong emphasis on reducing carbon footprints, making bioplastics a preferred choice in various industries, including packaging, automotive, and consumer goods.
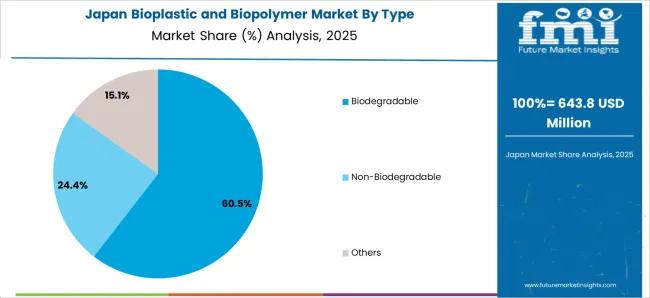
The notable CAGR in the market can be attributed to the commitment to technological advancements and sustainable initiatives of the country. With a mature industrial landscape, Japan highly values eco-friendly solutions.
The automotive industry, a key player in bioplastics, is driving market growth through innovations in lightweight materials for fuel efficiency. Consumer demand for sustainable packaging and governmental support for green technologies contribute to the strong trajectory of the market in Japan.
The rapid CAGR in the market reflects the proactive approach toward sustainable development and a circular economy of the nation. The government of China focuses on environmental conservation and green manufacturing has spurred the widespread adoption of bioplastics across various industries.
With a massive consumer base, the demand for sustainable products has increased, leading businesses to integrate bioplastics into their operations. The position of China as a manufacturing hub also amplifies the impact of its bioplastic market growth on a global scale.
The United Kingdom exhibits a notable CAGR in the market due to regulatory initiatives, consumer awareness, and corporate sustainability commitments. Stringent regulations, especially in packaging, have pushed businesses to explore greener alternatives.
A conscientious consumer base and the influence of sustainability-focused corporate policies contribute to the growing adoption of bioplastics. The commitment of the United Kingdom to reducing plastic waste and promoting sustainable practices positions bioplastics as a key player in the material landscape of the nation.
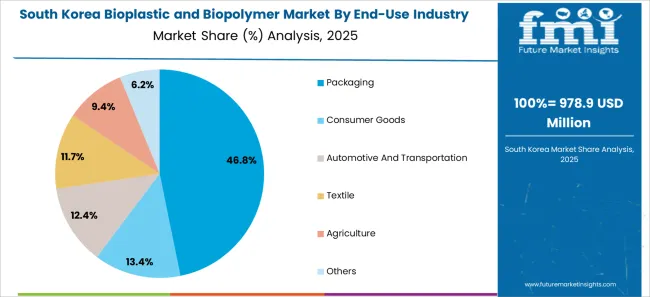
The exceptional CAGR in the market can be attributed to the technological prowess and strategic emphasis on sustainable innovation in the nation. With a thriving manufacturing sector, South Korea has quickly adopted bioplastics, especially in the automotive and electronics industries.
Government support for green technologies and a strong emphasis on corporate responsibility have further fueled the rapid growth of the bioplastic market in the country.
The table below provides an overview of the bioplastic and biopolymer landscape on the basis of type and end-use. Biodegradable type is projected to lead the type of market at an 18.9% CAGR by 2035, while packaging in the end user category is likely to expand at a CAGR of 18.7% by 2035.
A heightened global environmental consciousness primarily drives the projected dominance of biodegradable types in the market. Governments and regulatory bodies worldwide are implementing stringent measures to reduce single-use plastics and encourage the adoption of environmentally friendly packaging solutions.
| Category | CAGR from 2025 to 2035 |
|---|---|
| Biodegradable | 18.9% |
| Packaging | 18.7% |
The biodegradable type is anticipated to spearhead market growth, demonstrating a robust 18.9% CAGR by 2035.
This projection underscores a prevailing emphasis on environmentally friendly solutions, as biodegradable bioplastics align with global efforts to mitigate the environmental impact of traditional plastics.
The end-user category of packaging emerges as a pivotal driver, with an anticipated CAGR of 18.7% by 2035. A significant shift in regulatory frameworks favoring sustainable packaging practices influences this growth trajectory.
The increasing demand for eco-friendly and recyclable packaging materials aligns with regulatory requirements and consumer preferences, positioning packaging as a key sector propelling the market expansion.
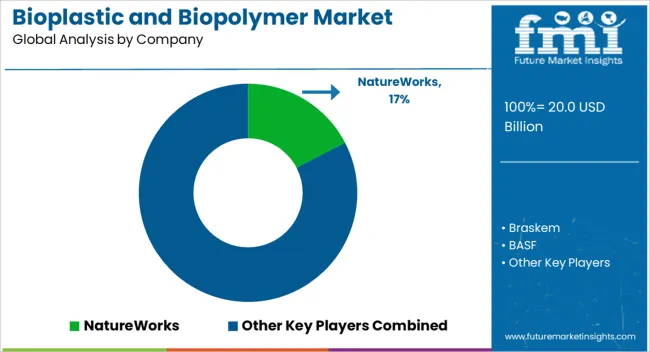
The competitive landscape of the bioplastic and biopolymer market is characterized by a diverse array of players vying for market share and prominence. Key industry participants include established multinational corporations and emerging players, contributing to the market dynamism.
Established companies often leverage their experience, financial strength, and extensive distribution networks to maintain a competitive edge. Meanwhile, newer entrants focus on innovation and niche segments to carve a niche in the market.
Research and development investments play a pivotal role as companies strive to enhance the performance and versatility of bioplastics and biopolymers, addressing specific industry demands.
As the industry continues to evolve, market players are anticipated to intensify their efforts in research, development, and strategic collaborations to maintain a competitive stance in the rapidly growing and environmentally conscious market.
Some of the key developments are
| Attributes | Details |
|---|---|
| Estimated Market Size in 2025 | USD 16.8 billion |
| Projected Market Valuation in 2035 | USD 98 billion |
| CAGR Share from 2025 to 2035 | 19.3% |
| Forecast Period | 2025 to 2035 |
| Historical Data Available for | 2020 to 2025 |
| Market Analysis | Value in USD billion |
| Key Regions Covered | North America; Latin America; Europe; East Asia; South Asia; Oceania; Middle East and Africa |
| Key Market Segments Covered | By Type, By End-use, By Region |
| Key Countries Profiled | The United States, Canada, Brazil, Mexico, Argentina, Germany, Italy, France, United Kingdom, Spain, Russia, BENELUX, China, Japan, South Korea, India, Thailand, Malaysia, Indonesia, Australia, New Zealand, GCC |
| Key Companies Profiled | NatureWorks; Braskem; BASF; Total Corbion; Novamont; Biome Bioplastics; Mitsubishi Chemical Holding Corporation; Biotec; Toray Industries; Plantic Technologies |
The global bioplastic and biopolymer market is estimated to be valued at USD 20.0 billion in 2025.
The market size for the bioplastic and biopolymer market is projected to reach USD 117.0 billion by 2035.
The bioplastic and biopolymer market is expected to grow at a 19.3% CAGR between 2025 and 2035.
The key product types in bioplastic and biopolymer market are biodegradable, non-biodegradable and others.
In terms of end-use industry, packaging segment to command 48.2% share in the bioplastic and biopolymer market in 2025.


Our Research Products

The "Full Research Suite" delivers actionable market intel, deep dives on markets or technologies, so clients act faster, cut risk, and unlock growth.

The Leaderboard benchmarks and ranks top vendors, classifying them as Established Leaders, Leading Challengers, or Disruptors & Challengers.

Locates where complements amplify value and substitutes erode it, forecasting net impact by horizon

We deliver granular, decision-grade intel: market sizing, 5-year forecasts, pricing, adoption, usage, revenue, and operational KPIs—plus competitor tracking, regulation, and value chains—across 60 countries broadly.

Spot the shifts before they hit your P&L. We track inflection points, adoption curves, pricing moves, and ecosystem plays to show where demand is heading, why it is changing, and what to do next across high-growth markets and disruptive tech

Real-time reads of user behavior. We track shifting priorities, perceptions of today’s and next-gen services, and provider experience, then pace how fast tech moves from trial to adoption, blending buyer, consumer, and channel inputs with social signals (#WhySwitch, #UX).

Partner with our analyst team to build a custom report designed around your business priorities. From analysing market trends to assessing competitors or crafting bespoke datasets, we tailor insights to your needs.
Supplier Intelligence
Discovery & Profiling
Capacity & Footprint
Performance & Risk
Compliance & Governance
Commercial Readiness
Who Supplies Whom
Scorecards & Shortlists
Playbooks & Docs
Category Intelligence
Definition & Scope
Demand & Use Cases
Cost Drivers
Market Structure
Supply Chain Map
Trade & Policy
Operating Norms
Deliverables
Buyer Intelligence
Account Basics
Spend & Scope
Procurement Model
Vendor Requirements
Terms & Policies
Entry Strategy
Pain Points & Triggers
Outputs
Pricing Analysis
Benchmarks
Trends
Should-Cost
Indexation
Landed Cost
Commercial Terms
Deliverables
Brand Analysis
Positioning & Value Prop
Share & Presence
Customer Evidence
Go-to-Market
Digital & Reputation
Compliance & Trust
KPIs & Gaps
Outputs
Full Research Suite comprises of:
Market outlook & trends analysis
Interviews & case studies
Strategic recommendations
Vendor profiles & capabilities analysis
5-year forecasts
8 regions and 60+ country-level data splits
Market segment data splits
12 months of continuous data updates
DELIVERED AS:
PDF EXCEL ONLINE
Bioplastics For Packaging Market Size and Share Forecast Outlook 2025 to 2035
Bioplastic For Interior Market Size and Share Forecast Outlook 2025 to 2035
Bioplastics Market Analysis - Size, Share & Forecast 2025 to 2035
Bioplastic Packaging Bag Market Growth – Demand & Forecast 2025 to 2035
Automotive Bioplastic Market Growth - Trends & Forecast 2025 to 2035
Demand for Bioplastics in USA Size and Share Forecast Outlook 2025 to 2035
Plant-Based Bioplastic Shrink Packaging Market Analysis - Size, Share, and Forecast Outlook 2025 to 2035
Evaluating Algae-Based Bioplastics Market Share & Provider Insights
Algae-Based Bioplastics Market Analysis – Growth & Forecast 2024-2034
Starch-Based Bioplastics Packaging Market Insights - Growth & Forecast 2025 to 2035
Android Automotive OS (AAOS) Market Size and Share Forecast Outlook 2025 to 2035
Anderson Cascade Impactor Market Size and Share Forecast Outlook 2025 to 2035
Andersen-Tawil Syndrome Treatment Market Trends - Growth & Future Prospects 2025 to 2035
Andro Supplements Market
Candle Filter Cartridges Market Size and Share Forecast Outlook 2025 to 2035
Handheld Electrostatic Meter Market Size and Share Forecast Outlook 2025 to 2035
Hand Towel Automatic Folding Machine Market Size and Share Forecast Outlook 2025 to 2035
Handheld Ultrasound Scanner Market Size and Share Forecast Outlook 2025 to 2035
Handheld Tagging Gun Market Forecast and Outlook 2025 to 2035
Handheld Imaging Systems Market Size and Share Forecast Outlook 2025 to 2035

Thank you!
You will receive an email from our Business Development Manager. Please be sure to check your SPAM/JUNK folder too.
Chat With
MaRIA