This site uses cookies, including third-party cookies, that help us to provide and improve our services.

Privacy Policy
- Global Locations -
Headquarters
Future Market Insights, Inc.
Christiana Corporate, 200 Continental Drive, Suite 401, Newark, Delaware - 19713, United States
T: +1-845-579-5705
MEA
Market Access DMCC

1602-6 Jumeirah Bay X2 Tower, Plot No: JLT-PH2-X2A,

Jumeirah Lakes Towers, Dubai,

United Arab Emirates

Americas
Future Market Insights
616 Corporate Way, Suite 2-9018,
Valley Cottage, NY 10989,
United States
T: +1-347-918-3531
Europe
Future Market Insights
3rd Floor, 207 Regent Street,
London W1B 3HH
United Kingdom
T: + 44 (0) 20 8123 9659
D: +44 (0) 20 3287 4268
APAC
Future Market Insights
Office No. 401-A, 4th Floor,
VANTAGE 9, S.No. 36/1/1,
Baner, Pune 411045 India

Bioplastics For Packaging Market

Market Insights on Bioplastics For Packaging covering sales outlook, demand forecast & up-to-date key trends

Bioplastics for Packaging Market By Material (Bio PET, Bio PA, Bio PE, Bio-PP), Application (Bottles, Cups, Trays, Clamshell, Films, Bags, Pouch & Sachet, Others), End Use (Food & Beverages, Cosmetics & Personal Care, Pharmaceuticals, Industrial Goods) & Region - Forecast 2022 - 2027

Bioplastics For Packaging Market Snapshot (2022-2027)

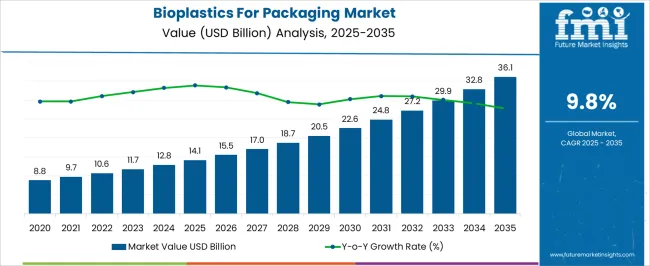
[270 Pages Report] The bioplastics for packaging market is estimated at USD 10.5 billion in 2022 and is projected to reach USD 16.6 billion by 2027, at a CAGR of 9.5% from 2013 to 2021.

The study conducted by FMI estimates that the bioplastics for packaging market will expand 1.7 times of base year value during the forecast period which is expected to generate lucrative investment opportunities for the manufacturers.

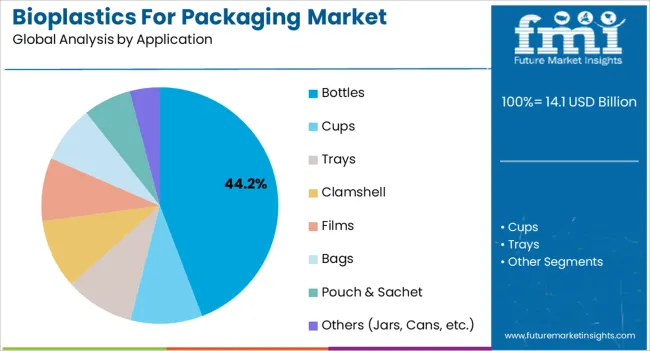
The bioplastics for packaging market analysis shows that global consumption of overall bioplastics for packaging is forecasted to increase at a year-on-year (YoY) growth of 10.3% in 2022. The films segment in the global bioplastics for packaging market is expected to hold a market share of 40.8% by 2027.

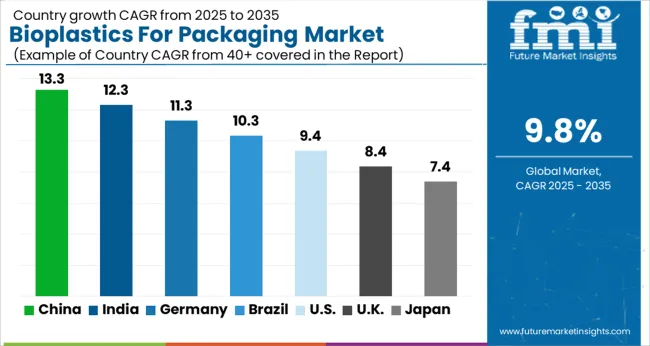
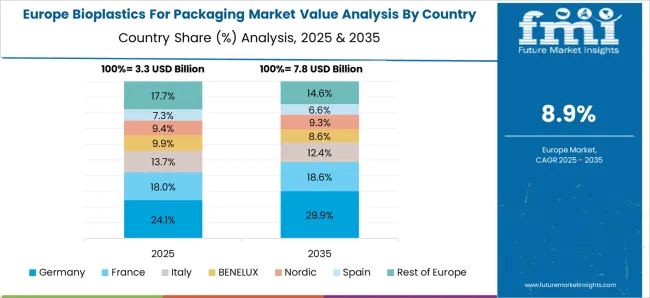
FMI team also analyzed that Italy and Germany are expected to hold a cumulative share of 48.8% of the bioplastics for packaging market in the Western Europe region in 2022 and the China bioplastics for packaging market is expected to expand by 11.8% CAGR over the forecast period. Bioplastics for packaging market is expected to be steered by the North American region which is expected to hold a prominent market share of 30.5% in 2022.

Market Size 2022

US$ 10.5 Bn

Market Size 2027

US$ 16.6 Bn

Value CAGR (2022-2027)

9.5%

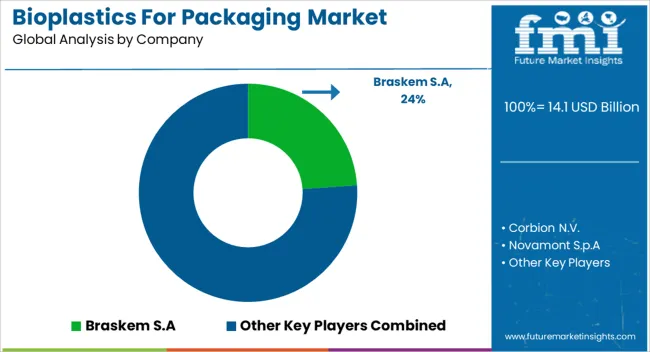
Top 5 Companies Market Share 2021

24.5%

Customize this Report

Let us know your requirement to get
100% FREE customization

Historic And Forecast Market Outlook For Bioplastics For Packaging

Driven by the growth of the sustainable packaging market across the globe, the bioplastics for packaging market is anticipated to rise at 9.5% CAGR from 2022 to 2027. Plastic plays an essential role in protecting, providing, and delivering high-quality products in every market segment to consumers across the globe.

In the plastic industry, the largest market segment is the packaging segment. The enormous consumption of conventional plastic in packaging has resulted in overarching problems such as climate change and future shortage of fossil resources has proliferated the search for better alternatives for plastic packaging.

Bioplastics are eco-friendly alternative solutions for traditional plastic solutions. Today, there is a bioplastic alternative for almost every traditional plastic material and application.

Bioplastics For Packaging Market Download Report Brochure

Bioplastics are bio-based, biodegradable, or both and offer similar or in some cases even better properties and functionalities as conventional plastics, also offer more benefits such as reduction of carbon footprint, organic recycling, better functionalities, etc.

With the growing environmental awareness of consumers, consumers want to buy products that have minimal impact on the environment. Furthermore, the ever-growing big brands are turning to compostable plastics solutions.

Due to Government regulations, the manufacturers are looking for innovative ways to reduce their environmental footprint and tapping into advanced technical properties that bioplastics have to offer. All these factors will significantly drive the bioplastics for packaging market.

How the Versatility, Innovation, and Sustainability of Bioplastics, Contributing to the Growth of Global Bioplastics for Packaging Market?

Bio-based plastics are used in a large number of markets such as packaging, catering products, consumer electronics, automotive, construction, and various other sectors. The packaging from bioplastics has evolved over the past decade.

New innovative materials such as PLA, PHA, and Bio PBS create packaging solutions with new functionalities like biodegradability, breathability, and increase in material strength, etc. Other new material like PEF offers better barrier properties than traditional polymers and can be easily mechanically recycled.

Biopolymers are certified compostable as per international standards like ASTM 6400 (USA), EN13432 (Europe), and ISO 17088. All these factors play a crucial role in packaging.

There is a high demand of bioplastic packaging for wrapping organic food also premium branded products. Materials such as PLA, bio-PE, or bio-PET are used in rigid bioplastics applications such as cosmetic packaging, beverage bottles, etc. In food packaging biodegradability is the most sought feature.

Flexible packaging solutions like films enable longer life of the products. When it comes to protecting food the performance of bioplastic packaging is comparable and sometimes better than existing conventional packaging. Thus the growth of bioplastics for packaging market will jump significantly.

Ismail Sutaria
Ismail Sutaria
Principal Consultant
LinkedIn
Talk to Analyst

Find your sweet spots for generating winning opportunities in this market.

Talk to Analyst

What Is The Impact Of COVID-19 Pandemic On The Global Bioplastics For Packaging Market?

Amid the Covid-19 pandemic, single-use packaging has seen an exponential rise due to the need to securely protect food products from contamination. Plastics are the key material in the healthcare, pharmaceutical industries.

In healthcare, plastic is indispensable in maintaining sterility in medical devices such as syringes, insulin pens, etc. However, the majority of these plastic packaging products come from conventional fossil fuel feedstocks contributing to the plastic waste generation crisis.

Bio-based plastics provide an environmentally friendly solution to fossil fuel plastics. The consumer’s inclination towards compostable and biodegradable packaging during pandemic has surged the demand for bioplastics.

The bioplastic industry has made an important contribution to the fight against Covid-19 as the PLA resin converted to PLA filaments used to produce medical masks, protective face shields, and protective equipment and and that resulted in the growth of the overall bioplastics for packaging market globally.

Country-Wise Insights

Why is Germany Considered One of the Most Lucrative Markets for Bioplastics for Packaging Market?

According to European Bioplastics (EUBP), bioplastic is a promising global market that is projected to grow significantly in the coming years. Innovative biopolymers like bio-based PP, PLA, and others continue to show a high growth rate. Every year around 4% of the oil is used to produce plastics globally.

With the rising global environmental crisis and the cost of oil rises, the Government and manufacturers are forced to take action to switch to a natural alternative. Germany supports the use and consumption of certified bio-based and compostable bio-waste garbage bags in the bio-waste ordinance since 2015.

The increasing government initiatives and promotion of bioplastics usage are expected to boost the market. The circular economy is the top priority for environmental policy in Germany and its people are aware of the importance of reducing plastic waste by opting the bio-based plastics to reduce the dependency on the limited fossil resources.

What will be the Impact of India on the Global Bioplastics for Packaging Market?

The Indian bioplastic for packaging is expected to grow at CAGR of 10.9% during the forecast period.

According to Down to Earth, the Central Pollution Control Board report in 2018-19 specifies as much as 3.3 million metric tonnes of plastic waste generated in India. The single-use plastics packaging is on an exponential rise. So in this pivotal time for bioplastics growth in India, the Indian Compostable Polymer Association was founded in 2018 to promote a sustainable circular economy and advocate compostable bioplastics in India.

In India, the increasing trend of supermarkets, malls, retail chains, and online shopping has created a huge demand for bags. The growing trend of outside food eating, quick-service restaurants, and food malls generated a massive growth for single-serve cutlery and cups. Hence, bioplastic bags, and garbage waste bags made from renewable resources are gaining high momentum.

Bioplastic bags are also used in industrial packaging of automobile parts, dust covers, and commercial applications in India due to the boom in the automobile sector. Thus, the increasing eco-awareness among consumers, stringent regulations imposed by the Government on single-use plastic consumptions will drive the Indian bioplastics for packaging market.

MarketNage
Become a MarketNgage Insider

A unified Market Research Subscription Platform, built for today's disparate research needs.

Category-Wise Insights

Why is Bio PET the Most Lucrative Segment among other Materials for Bioplastics for Packaging Market?

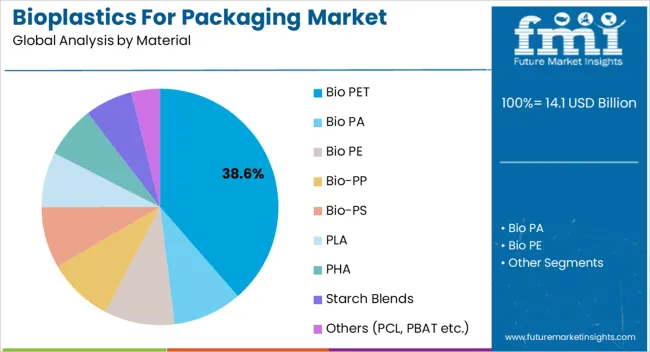
Bio PET segment is expected to hold ~30% market share by 2027. Bio PET is a form of biodegradable plastic and has mechanical and physical properties that make it suitable for packaging applications. They can be easily decomposed biologically or by industrial composting. Bio PET is a strong and versatile material that is used to produce a variety of products such as bottles, custom food packaging, and others.

Which End Use offers Lucrative Growth Opportunity for Global Bioplastics for Packaging Market?

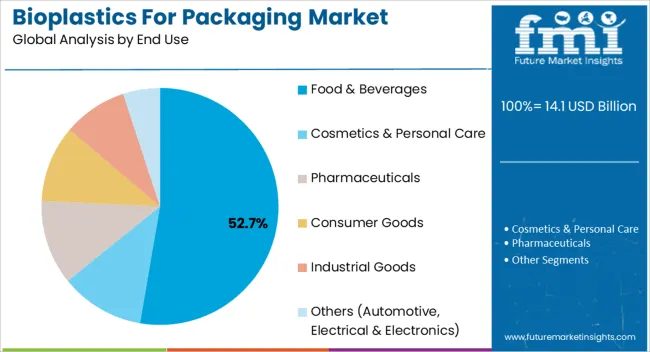
Food & beverages is considered to be the leading end use for bioplastics for packaging market. Eating and drinking on a go have become a lifestyle. The cutlery, bags, the entire product spectrum can be made from bioplastics. These products can be used in sports events, street festivals, trains, plains, etc. On the back of these factors, the food & beverages segment is anticipated to hold ~80% of the market share throughout the forecast period.
Competitive Landscape

The key manufacturers operating in the bioplastics for packaging market are focusing on partnerships, expansion and, innovative product launches to gain the customer’s attention.

  • In July 2021, Amcor Plc partnered with Syntegon to provide the coffee providers with a new mono-PE vacuum pack and it is designed to be recycled and more sustainable.
  • In February 2021, Braskem S.A invests US$ 61 Mn to increase biopolymer production.
  • In September 2020, Corbion N.V. and Total Corbion PLA have announced to build the first world-scale PLA plant in Europe and is expected to have a capacity of 100,000 tons per annum.
  • In November 2019, Tetra Pak International SA and its supplier Braskem, has become the 1st company to offer packaging with a fully traceable supply chain of plant-based polymers in the food and beverage industry.

Scope Of Report

Attribute

Details

Forecast Period

2022-2027

Historical Data Available for

2012-2021

Market Analysis

US$ Million for Value and Tonnes for Volume

Key Regions Covered

North America, Latin America, Western Europe, Eastern Europe, APEJ, Japan, and the Middle East & Africa (MEA)

Key Countries Covered

U.S., Canada, Brazil, Mexico, Germany, Italy, France, U.K., Spain, Poland, Russia, GCC Countries, South Africa, China, and India

Key Segments Covered

Material, Application, End Use and Region

Key Companies Profiled

  • Braskem S.A
  • Corbion N.V.
  • Novamont S.p.A
  • NatureWorks LLC
  • Amcor Plc
  • Mondi Group
  • Tetra Pak International SA
  • ALPLA-Werke Alwin Lehner GmbH & Co KG
  • Berry Global Inc.
  • Uflex Ltd.
  • Toray Industries Inc.
  • BARBIER GROUP
  • Jolybar Group
  • Biome Bioplastics Limited
  • Plastipak Holdings, Inc.
  • Virent, Inc.
  • SECOS Group Limited
  • Evo & Co.

Report Coverage

Market Forecast, Company Share Analysis, Competition Intelligence, DROT Analysis, Market Dynamics and Challenges, and Strategic Growth Initiatives

Customization & Pricing

Available upon Request

Bioplastics For Packaging Market By Category

By material, bioplastics for packaging market is segmented as:

  • Bio PET
  • Bio PA
  • Bio PE
  • Bio-PP
  • Bio-PS
  • PLA
  • PHA
  • Starch Blends
  • Others (PCL, PBAT etc.)

By application, bioplastics for packaging market is segmented as:

  • Bottles
  • Cups
  • Trays
  • Clamshell
  • Films
  • Bags
  • Pouch & Sachet
  • Others (Jars, Cans, etc.)

By end use, bioplastics for packaging market is segmented as:

  • Food & Beverages
  • Cosmetics & Personal Care
  • Pharmaceuticals
  • Consumer Goods
  • Industrial Goods
  • Others (Automotive, Electrical & Electronics )

By region, bioplastics for packaging market is segmented as:

  • North America
  • Latin America
  • Western Europe
  • Eastern Europe
  • APEJ
  • Japan
  • Middle East & Africa

Frequently Asked Questions

Bio PET (Bio Polyethylene Terephthalate), PLA (Polylactic Acid), and Starch Blends are the most successful bioplastics for the market.

Bioplastics are bio-based plastics that are either made up of food material of corn, sugarcane, etc. or non-food materials like sawdust, weeds, and others. They are being extensively preferred as they reduce the carbon footprints and landfill issues. Bioplastics are used for packaging that is rigid and flexible. There is a variety of bioplastics used for packaging such as Bio PET, Bio PA, Bio PE, Bio-PP, PLA, PHA, and others.

Bioplastics are used for packaging the products of food & beverage, pharmaceutical, consumer goods, industrial goods, cosmetics, personal care, and others. From niche products in organic trade to premium packaging for branded goods the bioplastics are conquering all packaging segments.

As per FMI, the bioplastics for packaging market is expected to surpass a valuation of US$ 10.5 Bn by 2022.

The U.S., China, Italy, Germany, and Japan are among the leading markets for bioplastics for packaging market, exhibiting consistently high demand.

Table of Content

1. Executive Summary

    1.1. Global Market Analysis

    1.2. Global Market Outlook

    1.3. Analysis and Recommendations

2. Market Introduction

    2.1. Market Definition

    2.2. Market Coverage

3. Key Market Trends

    3.1. Key Trends Impacting the Market

    3.2. Product Innovation

4. Key Success Factors

5. Global Bioplastics for Packaging Market Demand Analysis 2012-2021 and Forecast, 2022-2027

    5.1. Historical Market Volume (Tonnes) Analysis, 2012-2021

    5.2. Current and Future Market Volume (Tonnes) Projections, 2022-2027

    5.3. Y-o-Y Growth Trend Analysis

6. Global Bioplastics for Packaging Market - Pricing Analysis

    6.1. Regional Pricing Analysis, by Material

    6.2. Pricing Break-up

    6.3. Global Average Pricing Analysis Benchmark

7. Global Bioplastics for Packaging Market Demand (Value in US$ Mn) Analysis 2012-2021 and Forecast, 2022-2027

    7.1. Historical Market Value (US$ Mn) Analysis, 2012-2021

    7.2. Current and Future Market Value (US$ Mn) Projections, 2022-2027

        7.2.1. Y-o-Y Growth Trend Analysis

        7.2.2. Absolute $ Opportunity Analysis

8. Market Background

    8.1. Global Packaging Industry Outlook

    8.2. Global Flexible Packaging Market Outlook

    8.3. Global Rigid Packaging Market Outlook

    8.4. Macro-Economic Factors

    8.5. Forecast Factors - Relevance & Impact

    8.6. Value Chain

        8.6.1. Key Participants

            8.6.1.1. Raw Material  Suppliers

            8.6.1.2. Bioplastics for Packaging Manufacturers

            8.6.1.3. Distributors

            8.6.1.4. End Users

        8.6.2. Profitability Margin

    8.7.  Market Dynamics

        8.7.1. Drivers

        8.7.2. Restraints

        8.7.3. Opportunity Analysis

9. Impact of COVID-19

        9.1.1. Current Statistics and Probable Future Impact 

        9.1.2. Impact of COVID-19 on Packaging Market

        9.1.3. Impact of COVID-19 on Bioplastics for Packaging Market

10. Global Bioplastics for Packaging Market Analysis 2012-2021 and Forecast 2022-2027, by Material 

    10.1. Introduction

    10.2. Historical Market Size (US$ Mn) and Volume (Tonnes) Analysis, by Material, 2012-2021

    10.3. Current and Future Market Size (US$ Mn) and Volume (Tonnes) Analysis and Forecast, by Material, 2022-2027

        10.3.1. Bio PET

        10.3.2. Bio PA

        10.3.3. Bio PE

        10.3.4. Bio-PP

        10.3.5. Bio-PS

        10.3.6. PLA

        10.3.7. PHA

        10.3.8. Starch Blends

        10.3.9. Others (PCL, PBAT etc.)

    10.4. Market Attractiveness Analysis, by Material

11. Global Bioplastics for Packaging Market Analysis 2012-2021 and Forecast 2022-2027, by Application

    11.1. Introduction

    11.2. Historical Market Size (US$ Mn) and Volume (Tonnes) Analysis, by Application, 2012-2021

    11.3. Current and Future Market Size (US$ Mn) and Volume (Tonnes) Analysis and Forecast, by Application, 2022-2027

        11.3.1. Bottles

        11.3.2. Cups

        11.3.3. Trays

        11.3.4. Clamshell

        11.3.5. Films

        11.3.6. Bags

        11.3.7. Pouch & Sachet

        11.3.8. Others

    11.4. Market Attractiveness Analysis, by Application

12. Global Bioplastics for Packaging Market Analysis 2012-2021 and Forecast 2022-2027, by End Use

    12.1. Introduction

    12.2. Historical Market Size (US$ Mn) and Volume (Tonnes) Analysis, by End Use, 2012-2021

    12.3. Current and Future Market Size (US$ Mn) and Volume (Tonnes) Analysis and Forecast, by End Use, 2022-2027

        12.3.1. Food & Beverages

        12.3.2. Cosmetics & Personal Care

        12.3.3. Pharmaceuticals

        12.3.4. Consumers Goods

        12.3.5. Industrial Goods

        12.3.6. Others (Automotive, Electrical & Electronics, etc.)

    12.4. Market Attractiveness Analysis, by End Use

13. Global Bioplastics for Packaging Market Analysis 2012-2021 and Forecast 2022-2027, by Region

    13.1. Introduction

    13.2. Historical Market Size (US$ Mn) and Volume (Tonnes) Analysis, by Region, 2012-2021

    13.3. Current Market Size (US$ Mn) and Volume (Tonnes) Analysis and Forecast, by Region, 2022-2027

        13.3.1. North America 

        13.3.2. Latin America

        13.3.3. Western Europe

        13.3.4. Eastern Europe

        13.3.5. APEJ

        13.3.6. Japan

        13.3.7. Middle East and Africa (MEA)

    13.4. Market Attractiveness Analysis, by Region

14. North America Bioplastics for Packaging Market Analysis 2012–2021 and Forecast 2022–2027

    14.1. Introduction

    14.2. Historical Market Size (US$ Mn) and Volume (Tonnes) Analysis, by Market Taxonomy, 2012–2021

    14.3. Market Size (US$ Mn) and Volume (Tonnes) Forecast, by Market Taxonomy, 2022–2027

        14.3.1.  By Country

            14.3.1.1. U.S.

            14.3.1.2. Canada

        14.3.2. By Material

        14.3.3. By Application

        14.3.4. By End Use

    14.4. Market Attractiveness Analysis

        14.4.1. By Country

        14.4.2. By Material

        14.4.3. By Application

        14.4.4. By End Use

15. Latin America Bioplastics for Packaging Market Analysis 2012–2021 and Forecast 2022–2027

    15.1. Introduction

    15.2. Historical Market Size (US$ Mn) and Volume (Tonnes) Analysis, by Market Taxonomy, 2012–2021

    15.3. Market Size (US$ Mn) and Volume (Tonnes) Forecast, by Market Taxonomy, 2022–2027

        15.3.1.  By Country

            15.3.1.1. Brazil

            15.3.1.2. Mexico

            15.3.1.3. Rest of Latin America

        15.3.2. By Material

        15.3.3. By Application

        15.3.4. By End Use

    15.4. Market Attractiveness Analysis

        15.4.1. By Country

        15.4.2. By Material

        15.4.3. By Application

        15.4.4. By End Use

16. Western Europe Bioplastics for Packaging Market Analysis 2012–2021 and Forecast 2022–2027

    16.1. Introduction

    16.2. Historical Market Size (US$ Mn) and Volume (Tonnes) Analysis, by Market Taxonomy, 2012–2021

    16.3. Market Size (US$ Mn) and Volume (Tonnes) Forecast, by Market Taxonomy, 2022–2027

        16.3.1.  By Country

            16.3.1.1. Germany

            16.3.1.2. Italy

            16.3.1.3. France

            16.3.1.4. U.K.

            16.3.1.5. Spain

            16.3.1.6. BENELUX

            16.3.1.7. Nordics

            16.3.1.8. Rest of Europe

        16.3.2. By Material

        16.3.3. By Application

        16.3.4. By End Use

    16.4. Market Attractiveness Analysis

        16.4.1. By Country

        16.4.2. By Material

        16.4.3. By Application

        16.4.4. By End Use

17. Eastern Europe Bioplastics for Packaging Market Analysis 2012–2021 and Forecast 2022–2027

    17.1. Introduction

    17.2. Historical Market Size (US$ Mn) and Volume (Tonnes) Analysis, by Market Taxonomy, 2012–2021

    17.3. Market Size (US$ Mn) and Volume (Tonnes) Forecast, by Market Taxonomy, 2022–2027

        17.3.1.  By Country

            17.3.1.1. Russia

            17.3.1.2. Poland

            17.3.1.3. Rest of Eastern Europe

        17.3.2. By Material

        17.3.3. By Application

        17.3.4. By End Use

    17.4. Market Attractiveness Analysis

        17.4.1. By Country

        17.4.2. By Material

        17.4.3. By Application

        17.4.4. By End Use

18. APEJ Bioplastics for Packaging Market Analysis 2012–2021 and Forecast 2022–2027

    18.1. Introduction

    18.2. Historical Market Size (US$ Mn) and Volume (Tonnes) Analysis, by Market Taxonomy, 2012–2021

    18.3. Market Size (US$ Mn) and Volume (Tonnes) Forecast, by Market Taxonomy, 2022–2027

        18.3.1.  By Country

            18.3.1.1. India

            18.3.1.2. China

            18.3.1.3. Australia & New Zealand

            18.3.1.4. ASEAN

            18.3.1.5. Rest of APEJ

        18.3.2. By Material

        18.3.3. By Application

        18.3.4. By End Use

    18.4. Market Attractiveness Analysis

        18.4.1. By Country

        18.4.2. By Material

        18.4.3. By Application

        18.4.4. By End Use

19. Middle East and Africa Bioplastics for Packaging Market Analysis 2012–2021 and Forecast 2022–2027

    19.1. Introduction

    19.2. Historical Market Size (US$ Mn) and Volume (Tonnes) Analysis, by Market Taxonomy, 2012–2021

    19.3. Market Size (US$ Mn) and Volume (Tonnes) Forecast, by Market Taxonomy, 2022–2027

        19.3.1.  By Country

            19.3.1.1. GCC Countries

            19.3.1.2. North Africa

            19.3.1.3. South Africa

            19.3.1.4. Rest of Middle East and Africa

        19.3.2. By Material

        19.3.3. By Application

        19.3.4. By End Use

    19.4. Market Attractiveness Analysis

        19.4.1. By Country

        19.4.2. By Material

        19.4.3. By Application

        19.4.4. By End Use

20. Japan Bioplastics for Packaging Market Analysis 2012–2021 and Forecast 2022–2027

    20.1. Introduction

    20.2. Historical Market Size (US$ Mn) and Volume (Tonnes) Analysis, by Market Taxonomy, 2012–2021

    20.3. Market Size (US$ Mn) and Volume (Tonnes) Forecast, by Market Taxonomy, 2022–2027

        20.3.1. By Material

        20.3.2. By Application

        20.3.3. By End Use

    20.4. Market Attractiveness Analysis

        20.4.1. By Material

        20.4.2. By Application

        20.4.3. By End Use

21. Bioplastics for Packaging Market Country wise Analysis 2022 & 2027

    21.1. U.S. Bioplastics for Packaging Market Analysis

        21.1.1. Market Volume (Tonnes) and Value (US$ Mn) Analysis and Forecast, by Market Taxonomy

            21.1.1.1. By Material

            21.1.1.2. By Application

            21.1.1.3. By End Use

    21.2. Canada Bioplastics for Packaging Market Analysis

        21.2.1. Market Volume (Tonnes) and Value (US$ Mn) Analysis and Forecast, by Market Taxonomy

            21.2.1.1. By Material

            21.2.1.2. By Application

            21.2.1.3. By End Use

    21.3. Brazil Bioplastics for Packaging Market Analysis

        21.3.1. Market Volume (Tonnes) and Value (US$ Mn) Analysis and Forecast, by Market Taxonomy

            21.3.1.1. By Material

            21.3.1.2. By Application

            21.3.1.3. By End Use

    21.4. Mexico Bioplastics for Packaging Market Analysis

        21.4.1. Market Volume (Tonnes) and Value (US$ Mn) Analysis and Forecast, by Market Taxonomy

            21.4.1.1. By Material

            21.4.1.2. By Application

            21.4.1.3. By End Use

    21.5. Germany Bioplastics for Packaging Market Analysis

        21.5.1. Market Volume (Tonnes) and Value (US$ Mn) Analysis and Forecast, by Market Taxonomy

            21.5.1.1. By Material

            21.5.1.2. By Application

            21.5.1.3. By End Use

    21.6. Italy Bioplastics for Packaging Market Analysis

        21.6.1. Market Volume (Tonnes) and Value (US$ Mn) Analysis and Forecast, by Market Taxonomy

            21.6.1.1. By Material

            21.6.1.2. By Application

            21.6.1.3. By End Use

    21.7. France Bioplastics for Packaging Market Analysis

        21.7.1. Market Volume (Tonnes) and Value (US$ Mn) Analysis and Forecast, by Market Taxonomy

            21.7.1.1. By Material

            21.7.1.2. By Application

            21.7.1.3. By End Use

    21.8. U.K. Bioplastics for Packaging Market Analysis

        21.8.1. Market Volume (Tonnes) and Value (US$ Mn) Analysis and Forecast, by Market Taxonomy

            21.8.1.1. By Material

            21.8.1.2. By Application

            21.8.1.3. By End Use

    21.9. Spain Bioplastics for Packaging Market Analysis

        21.9.1. Market Volume (Tonnes) and Value (US$ Mn) Analysis and Forecast, by Market Taxonomy

            21.9.1.1. By Material

            21.9.1.2. By Application

            21.9.1.3. By End Use

    21.10. Russia Bioplastics for Packaging Market Analysis

        21.10.1. Market Volume (Tonnes) and Value (US$ Mn) Analysis and Forecast, by Market Taxonomy

            21.10.1.1. By Material

            21.10.1.2. By Application

            21.10.1.3. By End Use

    21.11. Poland Bioplastics for Packaging Market Analysis

        21.11.1. Market Volume (Tonnes) and Value (US$ Mn) Analysis and Forecast, by Market Taxonomy

            21.11.1.1. By Material

            21.11.1.2. By Application

            21.11.1.3. By End Use

    21.12. South Africa Bioplastics for Packaging Market Analysis

        21.12.1. Market Volume (Tonnes) and Value (US$ Mn) Analysis and Forecast, by Market Taxonomy

            21.12.1.1. By Material

            21.12.1.2. By Application

            21.12.1.3. By End Use

    21.13. GCC Countries Bioplastics for Packaging Market Analysis

        21.13.1. Market Volume (Tonnes) and Value (US$ Mn) Analysis and Forecast, by Market Taxonomy

            21.13.1.1. By Material

            21.13.1.2. By Application

            21.13.1.3. By End Use

    21.14. India Bioplastics for Packaging Market Analysis

        21.14.1. Market Volume (Tonnes) and Value (US$ Mn) Analysis and Forecast, by Market Taxonomy

            21.14.1.1. By Material

            21.14.1.2. By Application

            21.14.1.3. By End Use

    21.15. China Bioplastics for Packaging Market Analysis

        21.15.1. Market Volume (Tonnes) and Value (US$ Mn) Analysis and Forecast, by Market Taxonomy

            21.15.1.1. By Material

            21.15.1.2. By Application

            21.15.1.3. By End Use

22. Market Structure Analysis

    22.1. Market Analysis, by Tier of Bioplastics for Packaging Companies 

    22.2. Market Share Analysis of Top Players

    22.3. Market Presence Analysis

        22.3.1. By Regional footprint of Players

        22.3.2. Product foot print by Players

23. Competition Analysis

    23.1. Competition Dashboard

    23.2. Competition Benchmarking

    23.3. Competition Deep Dive

        23.3.1. Braskem SA

            23.3.1.1. Overview

            23.3.1.2. Product Portfolio

            23.3.1.3. Profitability by Market Segments

            23.3.1.4. Sales Footprint

            23.3.1.5. Strategy Overview

                23.3.1.5.1. Marketing Strategy

                23.3.1.5.2. Product Strategy

                23.3.1.5.3. Channel Strategy

        23.3.2. Tetra Pak International SA

            23.3.2.1. Overview

            23.3.2.2. Product Portfolio

            23.3.2.3. Profitability by Market Segments

            23.3.2.4. Sales Footprint

            23.3.2.5. Strategy Overview

                23.3.2.5.1. Marketing Strategy

                23.3.2.5.2. Product Strategy

                23.3.2.5.3. Channel Strategy

        23.3.3. ALPLA-Werke Alwin Lehner GmbH & Co KG

            23.3.3.1. Overview

            23.3.3.2. Product Portfolio

            23.3.3.3. Profitability by Market Segments

            23.3.3.4. Sales Footprint

            23.3.3.5. Strategy Overview

                23.3.3.5.1. Marketing Strategy

                23.3.3.5.2. Product Strategy

                23.3.3.5.3. Channel Strategy

        23.3.4. Corbion N.V.

            23.3.4.1. Overview

            23.3.4.2. Product Portfolio

            23.3.4.3. Profitability by Market Segments

            23.3.4.4. Sales Footprint

            23.3.4.5. Strategy Overview

                23.3.4.5.1. Marketing Strategy

                23.3.4.5.2. Product Strategy

                23.3.4.5.3. Channel Strategy

        23.3.5. NatureWorks LLC

            23.3.5.1. Overview

            23.3.5.2. Product Portfolio

            23.3.5.3. Profitability by Market Segments

            23.3.5.4. Sales Footprint

            23.3.5.5. Strategy Overview

                23.3.5.5.1. Marketing Strategy

                23.3.5.5.2. Product Strategy

                23.3.5.5.3. Channel Strategy

        23.3.6. Novamont S.p.A.

            23.3.6.1. Overview

            23.3.6.2. Product Portfolio

            23.3.6.3. Profitability by Market Segments

            23.3.6.4. Sales Footprint

            23.3.6.5. Strategy Overview

                23.3.6.5.1. Marketing Strategy

                23.3.6.5.2. Product Strategy

                23.3.6.5.3. Channel Strategy

        23.3.7. Amcor Plc

            23.3.7.1. Overview

            23.3.7.2. Product Portfolio

            23.3.7.3. Profitability by Market Segments

            23.3.7.4. Sales Footprint

            23.3.7.5. Strategy Overview

                23.3.7.5.1. Marketing Strategy

                23.3.7.5.2. Product Strategy

                23.3.7.5.3. Channel Strategy

        23.3.8. Berry Global Inc.

            23.3.8.1. Overview

            23.3.8.2. Product Portfolio

            23.3.8.3. Profitability by Market Segments

            23.3.8.4. Sales Footprint

            23.3.8.5. Strategy Overview

                23.3.8.5.1. Marketing Strategy

                23.3.8.5.2. Product Strategy

                23.3.8.5.3. Channel Strategy

        23.3.9. Uflex Ltd.

            23.3.9.1. Overview

            23.3.9.2. Product Portfolio

            23.3.9.3. Profitability by Market Segments

            23.3.9.4. Sales Footprint

            23.3.9.5. Strategy Overview

                23.3.9.5.1. Marketing Strategy

                23.3.9.5.2. Product Strategy

                23.3.9.5.3. Channel Strategy

        23.3.10. Mondi Group

            23.3.10.1. Overview

            23.3.10.2. Product Portfolio

            23.3.10.3. Profitability by Market Segments

            23.3.10.4. Sales Footprint

            23.3.10.5. Strategy Overview

                23.3.10.5.1. Marketing Strategy

                23.3.10.5.2. Product Strategy

                23.3.10.5.3. Channel Strategy

        23.3.11. Toray Industries Inc.

            23.3.11.1. Overview

            23.3.11.2. Product Portfolio

            23.3.11.3. Profitability by Market Segments

            23.3.11.4. Sales Footprint

            23.3.11.5. Strategy Overview

                23.3.11.5.1. Marketing Strategy

                23.3.11.5.2. Product Strategy

                23.3.11.5.3. Channel Strategy

        23.3.12.  BARBIER GROUP

            23.3.12.1. Overview

            23.3.12.2. Product Portfolio

            23.3.12.3. Profitability by Market Segments

            23.3.12.4. Sales Footprint

            23.3.12.5. Strategy Overview

                23.3.12.5.1. Marketing Strategy

                23.3.12.5.2. Product Strategy

                23.3.12.5.3. Channel Strategy

        23.3.13. Jolybar Group

            23.3.13.1. Overview

            23.3.13.2. Product Portfolio

            23.3.13.3. Profitability by Market Segments

            23.3.13.4. Sales Footprint

            23.3.13.5. Strategy Overview

                23.3.13.5.1. Marketing Strategy

                23.3.13.5.2. Product Strategy

                23.3.13.5.3. Channel Strategy

        23.3.14. Biome Bioplastics Limited

            23.3.14.1. Overview

            23.3.14.2. Product Portfolio

            23.3.14.3. Profitability by Market Segments

            23.3.14.4. Sales Footprint

            23.3.14.5. Strategy Overview

                23.3.14.5.1. Marketing Strategy

                23.3.14.5.2. Product Strategy

                23.3.14.5.3. Channel Strategy

        23.3.15. Plastipak Holdings, Inc.

            23.3.15.1. Overview

            23.3.15.2. Product Portfolio

            23.3.15.3. Profitability by Market Segments

            23.3.15.4. Sales Footprint

            23.3.15.5. Strategy Overview

                23.3.15.5.1. Marketing Strategy

                23.3.15.5.2. Product Strategy

                23.3.15.5.3. Channel Strategy

        23.3.16. Virent, Inc.

            23.3.16.1. Overview

            23.3.16.2. Product Portfolio

            23.3.16.3. Profitability by Market Segments

            23.3.16.4. Sales Footprint

            23.3.16.5. Strategy Overview

                23.3.16.5.1. Marketing Strategy

                23.3.16.5.2. Product Strategy

                23.3.16.5.3. Channel Strategy

        23.3.17. SECOS Group Limited

            23.3.17.1. Overview

            23.3.17.2. Product Portfolio

            23.3.17.3. Profitability by Market Segments

            23.3.17.4. Sales Footprint

            23.3.17.5. Strategy Overview

                23.3.17.5.1. Marketing Strategy

                23.3.17.5.2. Product Strategy

                23.3.17.5.3. Channel Strategy

        23.3.18. Evo & Co.

            23.3.18.1. Overview

            23.3.18.2. Product Portfolio

            23.3.18.3. Profitability by Market Segments

            23.3.18.4. Sales Footprint

            23.3.18.5. Strategy Overview

                23.3.18.5.1. Marketing Strategy

                23.3.18.5.2. Product Strategy

                23.3.18.5.3. Channel Strategy

            23.3.18.6. *The above list is indicative in nature and is subject to change during the course of research

24. Assumptions and Acronyms Used

25. Research Methodology
Customize this Report

Let us know your requirement to get
100% FREE customization

List of Tables

Table 01: Global Bioplastics for Packaging Market Value (US$ Mn) 2012H-2027F, by Material

Table 02: Global Bioplastics for Packaging Market Volume (Tonnes) 2012H-2027F, by Material

Table 03: Global Bioplastics for Packaging Market Value (US$ Mn) 2012H-2027F, by Application

Table 04: Global Bioplastics for Packaging Market Volume (Tonnes) 2012H-2027F, by Application

Table 05: Global Bioplastics for Packaging Market Value (US$ Mn) 2012H-2027F, by End Use

Table 06: Global Bioplastics for Packaging Market Volume (Tonnes) 2012H-2027F, by End Use

Table 07: Global Bioplastics for Packaging Market Value (US$ Mn) 2012H-2027F, by Region

Table 08: Global Bioplastics for Packaging Market Volume (Tonnes) 2012H-2027F, by Region

Table 09: North America Bioplastics for Packaging Market Value (US$ Mn) 2012H-2027F, by Material

Table 10: North America Bioplastics for Packaging Market Volume (Tonnes) 2012H-2027F, by Material

Table 11: North America Bioplastics for Packaging Market Value (US$ Mn) 2012H-2027F, by Application

Table 12: North America Bioplastics for Packaging Market Volume (Tonnes) 2012H-2027F, by Application

Table 13: North America Bioplastics for Packaging Market Value (US$ Mn) 2012H-2027F, by End Use

Table 14: North America Bioplastics for Packaging Market Volume (Tonnes) 2012H-2027F, by End Use

Table 15: North America Bioplastics for Packaging Market Value (US$ Mn) 2012H-2027F, by Country

Table 16: North America Bioplastics for Packaging Market Volume (Tonnes) 2012H-2027F, by Country

Table 17: Latin America Bioplastics for Packaging Market Value (US$ Mn) 2012H-2027F, by Material

Table 18: Latin America Bioplastics for Packaging Market Volume (Tonnes) 2012H-2027F, by Material

Table 19: Latin America Bioplastics for Packaging Market Value (US$ Mn) 2012H-2027F, by Application

Table 20: Latin America Bioplastics for Packaging Market Volume (Tonnes) 2012H-2027F, by Application

Table 21: Latin America Bioplastics for Packaging Market Value (US$ Mn) 2012H-2027F, by End Use

Table 22: Latin America Bioplastics for Packaging Market Volume (Tonnes) 2012H-2027F, by End Use

Table 23: Latin America Bioplastics for Packaging Market Value (US$ Mn) 2012H-2027F, by Country

Table 24: Latin America Bioplastics for Packaging Market Volume (Tonnes) 2012H-2027F, by Country

Table 25: Western Europe Bioplastics for Packaging Market Value (US$ Mn) 2012H-2027F, by Material

Table 26: Western Europe Bioplastics for Packaging Market Volume (Tonnes) 2012H-2027F, by Material

Table 27: Western Europe Bioplastics for Packaging Market Value (US$ Mn) 2012H-2027F, by Application

Table 28: Western Europe Bioplastics for Packaging Market Volume (Tonnes) 2012H-2027F, by Application

Table 29: Western Europe Bioplastics for Packaging Market Value (US$ Mn) 2012H-2027F, by End Use

Table 30: Western Europe Bioplastics for Packaging Market Volume (Tonnes) 2012H-2027F, by End Use

Table 31: Western Europe Bioplastics for Packaging Market Value (US$ Mn) 2012H-2027F, by Country

Table 32: Western Europe Bioplastics for Packaging Market Volume (Tonnes) 2012H-2027F, by Country

Table 33: Eastern Europe Bioplastics for Packaging Market Value (US$ Mn) 2012H-2027F, by Material

Table 34: Eastern Europe Bioplastics for Packaging Market Volume (Tonnes) 2012H-2027F, by Material

Table 35: Eastern Europe Bioplastics for Packaging Market Value (US$ Mn) 2012H-2027F, by Application

Table 36: Eastern Europe Bioplastics for Packaging Market Volume (Tonnes) 2012H-2027F, by Application

Table 37: Eastern Europe Bioplastics for Packaging Market Value (US$ Mn) 2012H-2027F, by End Use

Table 38: Eastern Europe Bioplastics for Packaging Market Volume (Tonnes) 2012H-2027F, by End Use

Table 39: Eastern Europe Bioplastics for Packaging Market Value (US$ Mn) 2012H-2027F, by Country

Table 40: Eastern Europe Bioplastics for Packaging Market Volume (Tonnes) 2012H-2027F, by Country

Table 41: MEA Bioplastics for Packaging Market Value (US$ Mn) 2012H-2027F, by Material

Table 42: MEA Bioplastics for Packaging Market Volume (Tonnes) 2012H-2027F, by Material

Table 43: MEA Bioplastics for Packaging Market Value (US$ Mn) 2012H-2027F, by Application

Table 44: MEA Bioplastics for Packaging Market Volume (Tonnes) 2012H-2027F, by Application

Table 45: MEA Bioplastics for Packaging Market Value (US$ Mn) 2012H-2027F, by End Use

Table 46: MEA Bioplastics for Packaging Market Volume (Tonnes) 2012H-2027F, by End Use

Table 47: MEA Bioplastics for Packaging Market Value (US$ Mn) 2012H-2027F, by Country

Table 48: MEA Bioplastics for Packaging Market Volume (Tonnes) 2012H-2027F, by Country

Table 49: APEJ Bioplastics for Packaging Market Value (US$ Mn) 2012H-2027F, by Material

Table 50: APEJ Bioplastics for Packaging Market Volume (Tonnes) 2012H-2027F, by Material

Table 51: APEJ Bioplastics for Packaging Market Value (US$ Mn) 2012H-2027F, by Application

Table 52: APEJ Bioplastics for Packaging Market Volume (Tonnes) 2012H-2027F, by Application

Table 53: APEJ Bioplastics for Packaging Market Value (US$ Mn) 2012H-2027F, by Application

Table 54: APEJ Bioplastics for Packaging Market Volume (Tonnes) 2012H-2027F, by Application

Table 55: APEJ Bioplastics for Packaging Market Value (US$ Mn) 2012H-2027F, by End Use

Table 56: APEJ Bioplastics for Packaging Market Volume (Tonnes) 2012H-2027F, by End Use

Table 57: APEJ Bioplastics for Packaging Market Value (US$ Mn) 2012H-2027F, by Country

Table 58: APEJ Bioplastics for Packaging Market Volume (Tonnes) 2012H-2027F, by Country

Table 59: Japan Bioplastics for Packaging Market Value (US$ Mn) 2012H-2027F, by Material

Table 60: Japan Bioplastics for Packaging Market Volume (Tonnes) 2012H-2027F, by Material

Table 61: Japan Bioplastics for Packaging Market Value (US$ Mn) 2012H-2027F, by Application

Table 62: Japan Bioplastics for Packaging Market Volume (Tonnes) 2012H-2027F, by Application

Table 63: Japan Bioplastics for Packaging Market Value (US$ Mn) 2012H-2027F, by End Use

Table 64: Japan Bioplastics for Packaging Market Volume (Tonnes) 2012H-2027F, by End Use

Table 65: United States Bioplastics for Packaging Market Analysis by Material, Application, End Use

Table 66: Canada Bioplastics for Packaging Market Analysis by Material, Application, and End Use

Table 67: Brazil Bioplastics for Packaging Market Analysis by Material, Application, and End Use

Table 68: Mexico Bioplastics for Packaging Market Analysis by Material, Application, and End Use

Table 69: Germany Bioplastics for Packaging Market Analysis by Material, Application, and End Use

Table 70: Italy Bioplastics for Packaging Market Analysis by Material, Application, and End Use

Table 71: France Bioplastics for Packaging Market Analysis by Material, Application, and End Use

Table 72: U.K. Bioplastics for Packaging Market Analysis by Material, Application, and End Use

Table 73: Spain Bioplastics for Packaging Market Analysis by Material, Application, and End Use

Table 74: Russia Bioplastics for Packaging Market Analysis by Material, Application, and End Use

Table 75: Poland Bioplastics for Packaging Market Analysis by Material, Application, and End Use

Table 76: South Africa Bioplastics for Packaging Market Analysis by Material, Application, and End Use

Table 77: GCC Bioplastics for Packaging Market Analysis by Material, Application, and End Use

Table 78: India Bioplastics for Packaging Market Analysis by Material, Application, and End Use

Table 79: China Bioplastics for Packaging Market Analysis by Material, Application, and End Use
Ismail Sutaria
Principal Consultant
LinkedIn
Talk to Analyst

Find your sweet spots for generating winning opportunities in this market.

Talk to Analyst

List of Charts

Figure 01: Global Bioplastics for Packaging Market Share Analysis by Material, 2022E & 2027F

Figure 02: Global Bioplastics for Packaging Market Attractiveness Analysis by Material, 2022E-2027F

Figure 03: Global Bioplastics for Packaging Market Share Analysis by Application, 2022E & 2027F

Figure 04: Global Bioplastics for Packaging Market Attractiveness Analysis by Application, 2022E-2027F

Figure 05: Global Bioplastics for Packaging Market Share Analysis by End Use, 2022E & 2027F

Figure 06: Global Bioplastics for Packaging Market Attractiveness Analysis by End Use, 2022E-2027F

Figure 07: Global Bioplastics for Packaging Market Share Analysis by Region, 2022E & 2027F

Figure 08: Global Bioplastics for Packaging Market Attractiveness Analysis by Region, 2022E-2027F

Figure 09: North America Bioplastics for Packaging Market Share Market Share Analysis by Material, 2022E & 2027F

Figure 10: North America Bioplastics for Packaging Market Attractiveness Analysis by Material, 2022E-2027F

Figure 11: North America Bioplastics for Packaging Market Share Market Share Analysis by Application, 2022E & 2027F

Figure 12: North America Bioplastics for Packaging Market Attractiveness Analysis by Application, 2022E-2027F

Figure 13: North America Bioplastics for Packaging Market Share Market Share Analysis by End Use, 2022E & 2027F

Figure 14: North America Bioplastics for Packaging Market Attractiveness Analysis by End Use, 2022E-2027F

Figure 15: North America Bioplastics for Packaging Market Share Market Share Analysis by Country, 2022E & 2027F

Figure 16: North America Bioplastics for Packaging Market Attractiveness Analysis by Country, 2022E-2027F

Figure 17: Latin America Bioplastics for Packaging Market Share Market Share Analysis by Material, 2022E & 2027F

Figure 18: Latin America Bioplastics for Packaging Market Attractiveness Analysis by Material, 2022E-2027F

Figure 19: Latin America Bioplastics for Packaging Market Share Market Share Analysis by Application, 2022E & 2027F

Figure 20: Latin America Bioplastics for Packaging Market Attractiveness Analysis by Application, 2022E-2027F

Figure 21: Latin America Bioplastics for Packaging Market Share Market Share Analysis by End Use, 2022E & 2027F

Figure 22: Latin America Bioplastics for Packaging Market Attractiveness Analysis by End Use, 2022E-2027F

Figure 23: Latin America Bioplastics for Packaging Market Share Market Share Analysis by Country, 2022E & 2027F

Figure 24: Latin America Bioplastics for Packaging Market Attractiveness Analysis by Country, 2022E-2027F

Figure 25: Western Europe Bioplastics for Packaging Market Share Market Share Analysis by Material, 2022E & 2027F

Figure 26: Western Europe Bioplastics for Packaging Market Attractiveness Analysis by Material, 2022E-2027F

Figure 27: Western Europe Bioplastics for Packaging Market Share Market Share Analysis by Application, 2022E & 2027F

Figure 28: Western Europe Bioplastics for Packaging Market Attractiveness Analysis by Application, 2022E-2027F

Figure 29: Western Europe Bioplastics for Packaging Market Share Market Share Analysis by End Use, 2022E & 2027F

Figure 30: Western Europe Bioplastics for Packaging Market Attractiveness Analysis by End Use, 2022E-2027F

Figure 31: Western Europe Bioplastics for Packaging Market Share Market Share Analysis by Country, 2022E & 2027F

Figure 32: Western Europe Bioplastics for Packaging Market Attractiveness Analysis by Country, 2022E-2027F

Figure 33: Eastern Europe Bioplastics for Packaging Market Share Market Share Analysis by Material, 2022E & 2027F

Figure 34: Eastern Europe Bioplastics for Packaging Market Attractiveness Analysis by Material, 2022E-2027F

Figure 35: Eastern Europe Bioplastics for Packaging Market Share Market Share Analysis by Application, 2022E & 2027F

Figure 36: Eastern Europe Bioplastics for Packaging Market Attractiveness Analysis by Application, 2022E-2027F

Figure 37: Eastern Europe Bioplastics for Packaging Market Share Market Share Analysis by End Use, 2022E & 2027F

Figure 38: Eastern Europe Bioplastics for Packaging Market Attractiveness Analysis by End Use, 2022E-2027F

Figure 39: Eastern Europe Bioplastics for Packaging Market Share Market Share Analysis by Country, 2022E & 2027F

Figure 40: Eastern Europe Bioplastics for Packaging Market Attractiveness Analysis by Country, 2022E-2027F

Figure 41: MEA Bioplastics for Packaging Market Share Market Share Analysis by Material, 2022E & 2027F

Figure 42: MEA Bioplastics for Packaging Market Attractiveness Analysis by Material, 2022E-2027F

Figure 43: MEA Bioplastics for Packaging Market Share Market Share Analysis by Application, 2022E & 2027F

Figure 44: MEA Bioplastics for Packaging Market Attractiveness Analysis by Application, 2022E-2027F

Figure 45: MEA Bioplastics for Packaging Market Share Market Share Analysis by End Use, 2022E & 2027F

Figure 46: MEA Bioplastics for Packaging Market Attractiveness Analysis by End Use, 2022E-2027F

Figure 47: MEA Bioplastics for Packaging Market Share Market Share Analysis by End User Industry, 2022E & 2027F

Figure 48: MEA Bioplastics for Packaging Market Attractiveness Analysis by End User Industry, 2022E-2027F

Figure 49: MEA Bioplastics for Packaging Market Share Market Share Analysis by Country, 2022E & 2027F

Figure 50: MEA Bioplastics for Packaging Market Attractiveness Analysis by Country, 2022E-2027F

Figure 51: APEJ Bioplastics for Packaging Market Share Market Share Analysis by Material, 2022E & 2027F

Figure 52: APEJ Bioplastics for Packaging Market Attractiveness Analysis by Material, 2022E-2027F

Figure 53: APEJ Bioplastics for Packaging Market Share Market Share Analysis by Application, 2022E & 2027F

Figure 54: APEJ Bioplastics for Packaging Market Attractiveness Analysis by Application, 2022E-2027F

Figure 55: APEJ Bioplastics for Packaging Market Share Market Share Analysis by End Use, 2022E & 2027F

Figure 56: APEJ Bioplastics for Packaging Market Attractiveness Analysis by End Use, 2022E-2027F

Figure 57: APEJ Bioplastics for Packaging Market Share Market Share Analysis by Country, 2022E & 2027F

Figure 58: APEJ Bioplastics for Packaging Market Attractiveness Analysis by Country, 2022E-2027F

Figure 59: Japan Bioplastics for Packaging Market Share Market Share Analysis by Material, 2022E & 2027F

Figure 60: Japan Bioplastics for Packaging Market Attractiveness Analysis by Material, 2022E-2027F

Figure 61: Japan Bioplastics for Packaging Market Share Market Share Analysis by Application, 2022E & 2027F

Figure 62: Japan Bioplastics for Packaging Market Attractiveness Analysis by Application, 2022E-2027F

Figure 63: Japan Bioplastics for Packaging Market Share Market Share Analysis by End Use, 2022E & 2027F

Figure 64: Japan Bioplastics for Packaging Market Attractiveness Analysis by End Use, 2022E-2027F

Need specific information?

Request Customization

Explore Packaging Insights

View Reports

Recommendations

Packaging

Flexible Packaging Paper Market

Published : December 2018

Packaging

Biodegradable Packaging Market

Published : July 2020

Packaging

Beverage Packaging Market

Published : February 2022

Packaging

FMCG Packaging Market

Published : January 2022

Google translate

Bioplastics For Packaging Market