Fortified Eggs Market Size and Share Forecast Outlook 2025 to 2035

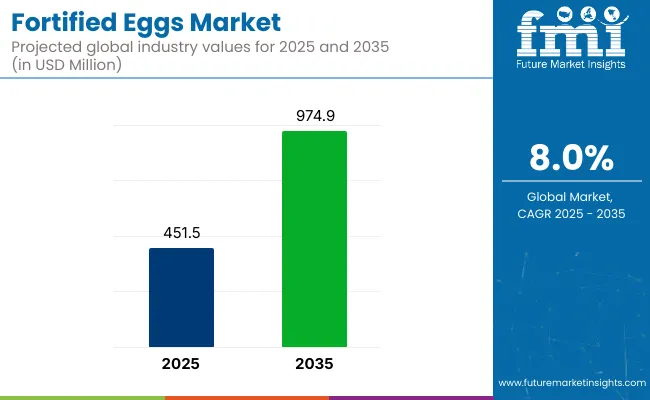
The global fortified eggs market is valued at USD 451.5 million in 2025 and is projected to reach USD 974.9 million by 2035, reflecting a compound annual growth rate (CAGR) of 8.0%.
Quick Stats for Fortified Eggs Market

  • Market Value (2025): USD 451.5 million
  • Forecast Value (2035): USD 974.9 million
  • Forecast CAGR: 8.0%
  • Micronutrients Leader in 2025: Omega-3 Fatty Acids (45% market share)
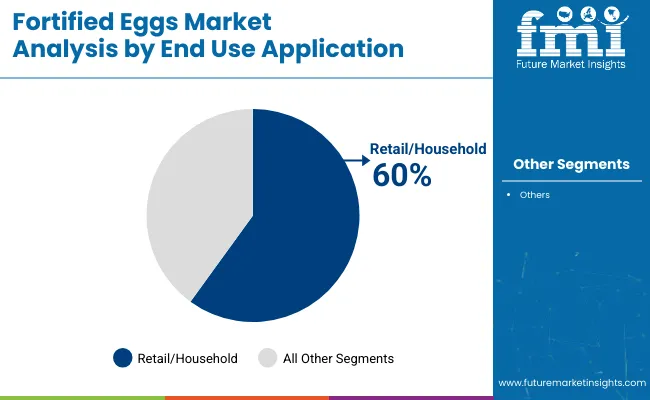
  • Top End Use Application: Retail/Household (60% market share)
  • Key Growth Region: North America (fastest-growing market in the USA with 8.1% CAGR)

Fortified Eggs Market

Metric Value
Estimated Size (2025) USD 451.5 million
Projected Value (2035) USD 974.9 million
CAGR (2025-2035) 8.0%

Factors contributing to this growth include the rising consumer preference for health-conscious foods and the increasing awareness about the nutritional benefits of fortified eggs, such as those enriched with omega-3 fatty acids, vitamins, and minerals. Additionally, the growing trend toward functional foods and personalized nutrition is expected to drive the demand for fortified eggs as consumers seek products that contribute to heart health, cognitive function, and overall well-being.

In 2025, the USA is expected to remain the largest market for fortified eggs, growing at a significant CAGR of 8.1% due to its health-conscious population and rising demand for omega-3 and vitamin D-enriched eggs.

Meanwhile, the UK. and Germany closely follow this rapid growth with prominent CAGRs of 7.9% and 7.5% respectively. By micronutrients, omega-3 fatty acids account for a market share of 45%, while the retail/household segment by end-use application holds a prominent share of 60% in 2025.

The market holds a relatively small share within its parent markets. In the functional foods market, it accounts for a small portion, typically under 5%, as fortified eggs are just one category within the broader functional food spectrum. In the organic food market, the share is also small, likely under 3%, given the dominance of organic produce and other food items.

Within the nutritional supplements market, fortified eggs contribute to a niche segment, likely under 2%. In broader markets like dairy products, food and beverage, and health and wellness, the market share of fortified eggs is similarly limited but growing steadily.

Looking ahead, the market is poised for continued innovation. Companies are focusing on AI-driven poultry nutrition optimization and bio-fortification techniques to improve the nutritional profile of eggs. Additionally, developments in smart food packaging and real-time nutritional tracking are expected to enhance consumer engagement and drive demand for fortified eggs. Sustainable farming practices, including regenerative agriculture, will likely become a key theme in the industry as consumer demand for ethically produced, nutrient-enriched food continues to rise.

Fortified Eggs Market Analysis by Top Investment Segments

The global fortified eggs market is segmented into the following categories:bymicronutrients, end-use application, and region. By micronutrients, itincludes vitamins, omega-3 fatty acids, and others (such as minerals and trace elements). By end use application, itincludes food processing, food service industry, and retail/household. By region, it covers North America, Latin America, Western Europe, Eastern Europe, East Asia, South Asia Pacific, the Middle East and Africa.

By Micronutrients, Omega-3 Fatty Acids Account for 45% of the Market Share

Omega-3 fatty acids will dominate this segment, accounting for approximately 45% of the market share in 2025. These eggs are particularly popular in North America and Europe, where the demand for heart-healthy and brain-boosting foods is rising.

The omega-3 fatty acids, sourced from flaxseeds, fish oil, and algae, are added to the eggs, providing essential nutrients. Vitamins, especially Vitamin D and B12, also play a crucial role in the market, though omega-3 remains the most lucrative segment.
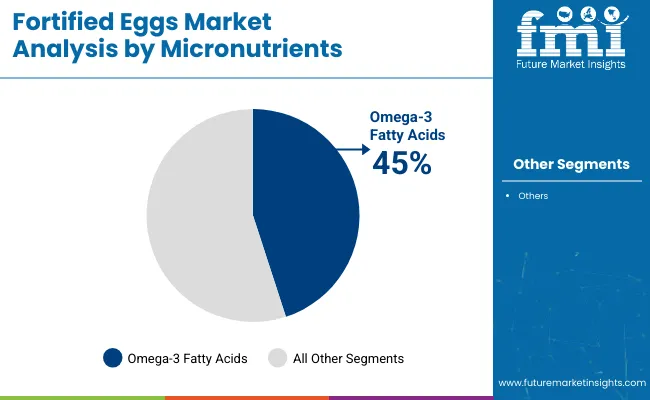
  • Omega-3 fortified eggs lead the market with a 45% share in 2025.
  • Vitamins such as Vitamin D and B12 are gaining traction but remain second.
  • The "others" category, including minerals like selenium, is growing but represents a smaller share of the market.

Fortified Eggs Market By Micronutrients

By End Use Application, Retail/Household Accounts for 60% Market Share

Retail/household will account for 60% of the market share in 2025. The strong performance of this segment is attributed to growing consumer awareness about the health benefits of fortified eggs. These eggs are easily accessible in supermarkets and health food stores, which has boosted their popularity. The food service industry is expanding, with more cafes and restaurants incorporating fortified eggs into their offerings. However, the food processing segment still remains less dominant, primarily due to the focus on direct consumer sales.
  • The food service industry is expanding steadily as demand for nutritious meals grows.
  • Food processing accounts for a smaller share but is still an important segment for the industry.

Fortified Eggs Market By End Use Application

Top Fortified Eggs Market Dynamics

Recent Trends in the Fortified Eggs Market

  • Increasing consumer demand for functional foods with added health benefits like omega-3 and vitamin-enriched eggs.
  • Rising adoption of AI-powered poultry nutrition optimization to enhance the nutritional content of eggs.
  • Growing focus on sustainable farming practices, including organic feed fortification.
  • The shift towards personalized nutrition, with fortified eggs catering to specific dietary needs.

Challenges in the Fortified Eggs Market
  • High production costs associated with the nutrient enrichment process for fortified eggs.
  • Regulatory compliance with food safety standards and nutritional labeling can be complex and costly.

Analyzing Top Countries Producing and Supplying Fortified Eggs

Fortified Eggs Market Country Wise

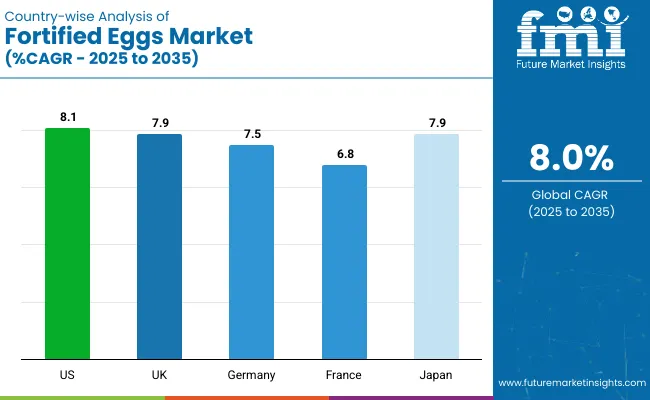
The market is projected to grow at varying rates across these countries. The USA leads with the highest growth, expected to grow at a CAGR of 8.1% from 2025 to 2035, driven by strong consumer demand for omega-3 and vitamin-enriched eggs. The UK and Japan follow closely with a CAGR of 7.9%, supported by increasing interest in functional foods and health-conscious diets.

Germany shows steady growth at 7.5%, benefiting from its focus on sustainable food production and health-driven consumer behavior. France has the slowest growth, at 6.8%, though it still reflects solid demand for nutrient-dense eggs.

The report covers in-depth analysis of 40+ countries; five top-performing OECD countries are highlighted below.

USA Fortified Eggs Market Analysis

The USA is projected to remain the largest market for fortified eggs, with a CAGR of 8.1% from 2025 to 2035. This growth is driven by the increasing consumer awareness of the health benefits of omega-3 and vitamin-enriched eggs, particularly among health-conscious consumers.

The country’s demand for nutrient-dense, high-protein foods and the growing trend towards organic and sustainable food production will continue to boost the market. A well-established retail sector and a growing presence in the foodservice industry will further fuel this expansion.

  • Increasing preference for omega-3 and vitamin-enriched eggs in consumer diets.
  • Growth in demand for organic and sustainably produced fortified eggs.
  • Strong retail channels and high consumer awareness of food quality.

Fortified Eggs Demand Analysis in the UK

The fortified eggs revenuein the UK is projected to grow at a CAGR of 7.9% from 2025 to 2035, driven by the increasing consumer demand for functional foods, particularly those enriched with omega-3 and vitamins.

The country’s focus on wellness and health, along with government-led health campaigns encouraging functional food consumption, is expected to sustain market growth. The expanding retail and food service sectors will continue to provide more opportunities for fortified egg products to reach a larger audience.

  • Rising consumer interest in functional foods for heart health and immunity.
  • Government initiatives encouraging the consumption of fortified foods.
  • Increasing presence of fortified eggs in both retail and foodservice sectors.

Fortified Eggs Sales Analysis in Germany

The sales of fortified eggs in Germany areexpected to grow at a CAGR of 7.5% from 2025 to 2035, driven by a strong consumer base focused on natural and functional foods. Consumers are becoming increasingly health-conscious, contributing to the demand for nutrient-enriched eggs, especially those fortified with omega-3 and vitamins. The country’s high food safety standards, emphasis on sustainable food production, and a well-developed retail sector will support steady market growth in this region.

  • Strong demand for health-focused, nutrient-enriched egg products.
  • Government regulations supporting functional food growth.
  • Robust retail channels, with increasing availability of fortified eggs.

France Fortified Eggs Market Analysis

In France, the revenue from fortified eggs is expected to grow at a CAGR of 6.8% from 2025 to 2035. This growth is fueled by rising consumer interest in health and wellness products, particularly omega-3 and vitamin-enriched eggs. The market is also supported by the French preference for organic and sustainable farming practices. Though the demand for fortified eggs is growing steadily, France's focus on renewable energy and environmental sustainability will shape the future of food production, encouraging innovation in egg fortification.

  • Growing consumer preference for heart-healthy and immune-boosting foods.
  • Increasing integration of organic and sustainable food production practices.
  • Expanding retail channels and foodservice integration of fortified eggs.

Fortified Eggs Industry Analysis in Japan

The fortified eggs demand in Japan is projected to see steady growth in the fortified eggs market, with a CAGR of 7.9% from 2025 to 2035. This growth is driven by the demand for high-protein diets and functional foods, particularly among Japan’s aging population. Omega-3 and vitamin D-enriched eggs are gaining popularity due to their health benefits. Japan’s focus on high-quality food production and the rising consumer awareness about nutrition will continue to propel the market forward, particularly in retail and foodservice sectors.

  • Growing demand for fortified eggs due to aging population and high-protein diets.
  • Strong retail and foodservice adoption of omega-3 and vitamin-enriched eggs.
  • Increasing consumer focus on functional and nutrient-dense food options.

Leading Fortified Eggs Suppliers

The market is moderately consolidated, with key players like Eggland’s Best, Cal-Maine Foods, Vital Farms, Clover Stornetta Farms, Inc. capturing a significant portion of the market share. These companies are focusing on innovation, sustainability, and expanding their product offerings to meet the growing consumer demand for nutrient-enriched eggs.

They are competing through strategies such as pricing, partnerships, technological advancements, and sustainability initiatives. With increasing awareness of health benefits, these companies aim to diversify their portfolios and improve production efficiency through innovation in egg fortification and feed technology.

Eggland’s Best leads the fortified eggs market with a strong focus on omega-3 and vitamin-enriched eggs. Their innovative approach includes AI-driven poultry nutrition optimization and sustainable feed fortification. Companies like Vital Farms emphasize pasture-raised eggs, while Cal-Maine Foods focuses on large-scale production and distribution. These companies invest heavily in both operational efficiency and consumer engagement to maintain their competitive edge.

Recent Fortified Eggs Industry News

Eggland’s Best introduced a new range of organic, vitamin D-fortified eggs in partnership with sustainable farming initiatives in early 2025.

In February 2025, Clover Sonoma (formerly Clover Stornetta Farms, Inc.) launched a new Pasture Raised Organic A2 4% Whole Milk, expanding its premium dairy offerings with a focus on organic and specialty nutrition

Report Scope Table

Report Attributes Details
Current Total Market Size (2025) USD 451.5 million
Projected Market Size (2035) USD 974.9 million
CAGR (2025 to 2035) 8.0%
Base Year for Estimation 2024
Historical Period 2020-2024
Projections Period 2025-2035
Market Analysis Parameters Revenue in USD millions/Volume in Units
By Micronutrient s Vitamins, Omega-3 fatty acids, Others (minerals, selenium, DHA)
By End Use Application Food Processing, Food Service Industry, Retail/Household
Regions Covered North America, Latin America, Western Europe, Eastern Europe, East Asia, South Asia Pacific, Middle East and Africa
Countries Covered United States, United Kingdom, Germany, France, Japan, China, South Korea, Brazil, India, Australia
Key Players Clover Stornetta Farms, Inc., Eggland's Best, Inc., Oakdell , NutriPlus , Boulder Brands USA, Inc., Farm Pride Foods Ltd., Vital Farms, Wilcox, Organic Valley, Nutrigroupe , and Suguna Foods
Additional Attributes Dollar sales by value, market share analysis by region, and country-wise analysis

Key Segments

By Micronutrients:

  • Vitamins
  • Omega-3 fatty acids
  • Others

By End Use Application:

  • Food Processing
  • Food Service Industry
  • Retail/Household

By Region:

  • North America
  • Latin America
  • Western Europe
  • Eastern Europe
  • East Asia
  • South Asia Pacific
  • Middle East and Africa

Table of Content

  1. Executive Summary
    • Global Market Outlook
    • Demand-side Trends
    • Supply-side Trends
    • Technology Roadmap Analysis
    • Analysis and Recommendations
  2. Market Overview
    • Market Coverage / Taxonomy
    • Market Definition / Scope / Limitations
  3. Market Background
    • Market Dynamics
      • Drivers
      • Restraints
      • Opportunity
      • Trends
    • Scenario Forecast
      • Demand in Optimistic Scenario
      • Demand in Likely Scenario
      • Demand in Conservative Scenario
    • Opportunity Map Analysis
    • Product Life Cycle Analysis
    • Supply Chain Analysis
      • Supply Side Participants and their Roles
        • Producers
        • Mid-Level Participants (Traders/ Agents/ Brokers)
        • Wholesalers and Distributors
      • Value Added and Value Created at Node in the Supply Chain
      • List of Raw Material Suppliers
      • List of Existing and Potential Buyer’s
    • Investment Feasibility Matrix
    • Value Chain Analysis
      • Profit Margin Analysis
      • Wholesalers and Distributors
      • Retailers
    • PESTLE and Porter’s Analysis
    • Regulatory Landscape
      • By Key Regions
      • By Key Countries
    • Regional Parent Market Outlook
    • Production and Consumption Statistics
    • Import and Export Statistics
  4. Global Market Analysis 2020-2024 and Forecast, 2025-2035
    • Historical Market Size Value (USD Million) & Volume (Units) Analysis, 2020-2024
    • Current and Future Market Size Value (USD Million) & Volume (Units) Projections, 2025-2035
      • Y-o-Y Growth Trend Analysis
      • Absolute $ Opportunity Analysis
  5. Global Market Pricing Analysis 2020-2024 and Forecast 2025-2035
  6. Global Market Analysis 2020-2024 and Forecast 2025-2035, By Micronutrients
    • Introduction / Key Findings
    • Historical Market Size Value (USD Million) & Volume (Units) Analysis By Micronutrients, 2020-2024
    • Current and Future Market Size Value (USD Million) & Volume (Units) Analysis and Forecast By Micronutrients, 2025-2035
      • Vitamins
      • Omega-3 fatty acids
      • Others
    • Y-o-Y Growth Trend Analysis By Micronutrients, 2020-2024
    • Absolute $ Opportunity Analysis By Micronutrients, 2025-2035
  7. Global Market Analysis 2020-2024 and Forecast 2025-2035, By End Use Application
    • Introduction / Key Findings
    • Historical Market Size Value (USD Million) & Volume (Units) Analysis By End Use Application, 2020-2024
    • Current and Future Market Size Value (USD Million) & Volume (Units) Analysis and Forecast By End Use Application, 2025-2035
      • Food Processing
      • Food Service Industry
      • Retail/Household
    • Y-o-Y Growth Trend Analysis By End Use Application, 2020-2024
    • Absolute $ Opportunity Analysis By End Use Application, 2025-2035
  8. Global Market Analysis 2020-2024 and Forecast 2025-2035, By Region
    • Introduction
    • Historical Market Size Value (USD Million) & Volume (Units) Analysis By Region, 2020-2024
    • Current Market Size Value (USD Million) & Volume (Units) Analysis and Forecast By Region, 2025-2035
      • North America
      • Latin America
      • Western Europe
      • Eastern Europe
      • East Asia
      • South Asia & Pacific
      • Middle East and Africa
    • Market Attractiveness Analysis By Region
  9. North America Market Analysis 2020-2024 and Forecast 2025-2035, By Country
    • Historical Market Size Value (USD Million) & Volume (Units) Trend Analysis By Market Taxonomy, 2020-2024
    • Market Size Value (USD Million) & Volume (Units) Forecast By Market Taxonomy, 2025-2035
      • By Country
        • USA
        • Canada
        • Mexico
      • By Micronutrients
      • By End Use Application
    • Market Attractiveness Analysis
      • By Country
      • By Micronutrients
      • By End Use Application
    • Key Takeaways
  10. Latin America Market Analysis 2020-2024 and Forecast 2025-2035, By Country
    • Historical Market Size Value (USD Million) & Volume (Units) Trend Analysis By Market Taxonomy, 2020-2024
    • Market Size Value (USD Million) & Volume (Units) Forecast By Market Taxonomy, 2025-2035
      • By Country
        • Brazil
        • Argentina
        • Rest of LATAM
      • By Micronutrients
      • By End Use Application
    • Market Attractiveness Analysis
      • By Country
      • By Micronutrients
      • By End Use Application
    • Key Takeaways
  11. Western Europe Market Analysis 2020-2024 and Forecast 2025-2035, By Country
    • Historical Market Size Value (USD Million) & Volume (Units) Trend Analysis By Market Taxonomy, 2020-2024
    • Market Size Value (USD Million) & Volume (Units) Forecast By Market Taxonomy, 2025-2035
      • By Country
        • Germany
        • Italy
        • France
        • UK
        • Spain
        • BENELUX
        • Nordic
        • Rest of W.Europe
      • By Micronutrients
      • By End Use Application
    • Market Attractiveness Analysis
      • By Country
      • By Micronutrients
      • By End Use Application
    • Key Takeaways
  12. Eastern Europe Market Analysis 2020-2024 and Forecast 2025-2035, By Country
    • Historical Market Size Value (USD Million) & Volume (Units) Trend Analysis By Market Taxonomy, 2020-2024
    • Market Size Value (USD Million) & Volume (Units) Forecast By Market Taxonomy, 2025-2035
      • By Country
        • Russia
        • Hungary
        • Poland
        • Balkan & Baltics
        • Rest of E. Europe
      • By Micronutrients
      • By End Use Application
    • Market Attractiveness Analysis
      • By Country
      • By Micronutrients
      • By End Use Application
    • Key Takeaways
  13. East Asia Market Analysis 2020-2024 and Forecast 2025-2035, By Country
    • Historical Market Size Value (USD Million) & Volume (Units) Trend Analysis By Market Taxonomy, 2020-2024
    • Market Size Value (USD Million) & Volume (Units) Forecast By Market Taxonomy, 2025-2035
      • By Country
        • China
        • Japan
        • South Korea
      • By Micronutrients
      • By End Use Application
    • Market Attractiveness Analysis
      • By Country
      • By Micronutrients
      • By End Use Application
    • Key Takeaways
  14. South Asia & Pacific Market Analysis 2020-2024 and Forecast 2025-2035, By Country
    • Historical Market Size Value (USD Million) & Volume (Units) Trend Analysis By Market Taxonomy, 2020-2024
    • Market Size Value (USD Million) & Volume (Units) Forecast By Market Taxonomy, 2025-2035
      • By Country
        • India
        • Australia & New Zealand
        • ASEAN
        • Rest of SAP
      • By Micronutrients
      • By End Use Application
    • Market Attractiveness Analysis
      • By Country
      • By Micronutrients
      • By End Use Application
    • Key Takeaways
  15. Middle East and Africa Market Analysis 2020-2024 and Forecast 2025-2035, By Country
    • Historical Market Size Value (USD Million) & Volume (Units) Trend Analysis By Market Taxonomy, 2020-2024
    • Market Size Value (USD Million) & Volume (Units) Forecast By Market Taxonomy, 2025-2035
      • By Country
        • GCC Countries
        • Northern Africa
        • South Africa
        • Turkiye
        • Rest of MEA
      • By Micronutrients
      • By End Use Application
    • Market Attractiveness Analysis
      • By Country
      • By Micronutrients
      • By End Use Application
    • Key Takeaways
  16. Key Countries Market Analysis
    • USA
      • Pricing Analysis
      • Market Share Analysis, 2024
        • By Micronutrients
        • By End Use Application
    • Canada
      • Pricing Analysis
      • Market Share Analysis, 2024
        • By Micronutrients
        • By End Use Application
    • Brazil
      • Pricing Analysis
      • Market Share Analysis, 2024
        • By Micronutrients
        • By End Use Application
    • Mexico
      • Pricing Analysis
      • Market Share Analysis, 2024
        • By Micronutrients
        • By End Use Application
    • Argentina
      • Pricing Analysis
      • Market Share Analysis, 2024
        • By Micronutrients
        • By End Use Application
  17. Market Structure Analysis
    • Competition Dashboard
    • Competition Benchmarking
    • Market Share Analysis of Top Players
      • By Regional
      • By Micronutrients
      • By End Use Application
  18. Competition Analysis
    • Competition Deep Dive
      • Clover Stornetta Farms, Inc.
        • Overview
        • Product Portfolio
        • Profitability by Market Segments (Product/Age /Sales Channel/Region)
        • Sales Footprint
        • Strategy Overview
          • Marketing Strategy
          • Product Strategy
          • Channel Strategy
      • Eggland's Best, Inc.
        • Overview
        • Product Portfolio
        • Profitability by Market Segments (Product/Age /Sales Channel/Region)
        • Sales Footprint
        • Strategy Overview
          • Marketing Strategy
          • Product Strategy
          • Channel Strategy
      • Oakdell, NutriPlus
        • Overview
        • Product Portfolio
        • Profitability by Market Segments (Product/Age /Sales Channel/Region)
        • Sales Footprint
        • Strategy Overview
          • Marketing Strategy
          • Product Strategy
          • Channel Strategy
      • Boulder Brands USA, Inc.
        • Overview
        • Product Portfolio
        • Profitability by Market Segments (Product/Age /Sales Channel/Region)
        • Sales Footprint
        • Strategy Overview
          • Marketing Strategy
          • Product Strategy
          • Channel Strategy
      • Farm Pride Foods Ltd.
        • Overview
        • Product Portfolio
        • Profitability by Market Segments (Product/Age /Sales Channel/Region)
        • Sales Footprint
        • Strategy Overview
          • Marketing Strategy
          • Product Strategy
          • Channel Strategy
      • Vital Farms
        • Overview
        • Product Portfolio
        • Profitability by Market Segments (Product/Age /Sales Channel/Region)
        • Sales Footprint
        • Strategy Overview
          • Marketing Strategy
          • Product Strategy
          • Channel Strategy
      • Wilcox
        • Overview
        • Product Portfolio
        • Profitability by Market Segments (Product/Age /Sales Channel/Region)
        • Sales Footprint
        • Strategy Overview
          • Marketing Strategy
          • Product Strategy
          • Channel Strategy
      • Organic Valley
        • Overview
        • Product Portfolio
        • Profitability by Market Segments (Product/Age /Sales Channel/Region)
        • Sales Footprint
        • Strategy Overview
          • Marketing Strategy
          • Product Strategy
          • Channel Strategy
      • Nutrigroupe
        • Overview
        • Product Portfolio
        • Profitability by Market Segments (Product/Age /Sales Channel/Region)
        • Sales Footprint
        • Strategy Overview
          • Marketing Strategy
          • Product Strategy
          • Channel Strategy
      • Suguna Foods
        • Overview
        • Product Portfolio
        • Profitability by Market Segments (Product/Age /Sales Channel/Region)
        • Sales Footprint
        • Strategy Overview
          • Marketing Strategy
          • Product Strategy
          • Channel Strategy
  19. Assumptions & Acronyms Used
  20. Research Methodology

List of Tables

  • Table 1: Global Market Value (USD Million) Forecast by Region, 2020-2035
  • Table 2: Global Market Volume (Units) Forecast by Region, 2020-2035
  • Table 3: Global Market Value (USD Million) Forecast by Micronutrients, 2020-2035
  • Table 4: Global Market Volume (Units) Forecast by Micronutrients, 2020-2035
  • Table 5: Global Market Value (USD Million) Forecast by End Use Application, 2020-2035
  • Table 6: Global Market Volume (Units) Forecast by End Use Application, 2020-2035
  • Table 7: North America Market Value (USD Million) Forecast by Country, 2020-2035
  • Table 8: North America Market Volume (Units) Forecast by Country, 2020-2035
  • Table 9: North America Market Value (USD Million) Forecast by Micronutrients, 2020-2035
  • Table 10: North America Market Volume (Units) Forecast by Micronutrients, 2020-2035
  • Table 11: North America Market Value (USD Million) Forecast by End Use Application, 2020-2035
  • Table 12: North America Market Volume (Units) Forecast by End Use Application, 2020-2035
  • Table 13: Latin America Market Value (USD Million) Forecast by Country, 2020-2035
  • Table 14: Latin America Market Volume (Units) Forecast by Country, 2020-2035
  • Table 15: Latin America Market Value (USD Million) Forecast by Micronutrients, 2020-2035
  • Table 16: Latin America Market Volume (Units) Forecast by Micronutrients, 2020-2035
  • Table 17: Latin America Market Value (USD Million) Forecast by End Use Application, 2020-2035
  • Table 18: Latin America Market Volume (Units) Forecast by End Use Application, 2020-2035
  • Table 19: Western Europe Market Value (USD Million) Forecast by Country, 2020-2035
  • Table 20: Western Europe Market Volume (Units) Forecast by Country, 2020-2035
  • Table 21: Western Europe Market Value (USD Million) Forecast by Micronutrients, 2020-2035
  • Table 22: Western Europe Market Volume (Units) Forecast by Micronutrients, 2020-2035
  • Table 23: Western Europe Market Value (USD Million) Forecast by End Use Application, 2020-2035
  • Table 24: Western Europe Market Volume (Units) Forecast by End Use Application, 2020-2035
  • Table 25: Eastern Europe Market Value (USD Million) Forecast by Country, 2020-2035
  • Table 26: Eastern Europe Market Volume (Units) Forecast by Country, 2020-2035
  • Table 27: Eastern Europe Market Value (USD Million) Forecast by Micronutrients, 2020-2035
  • Table 28: Eastern Europe Market Volume (Units) Forecast by Micronutrients, 2020-2035
  • Table 29: Eastern Europe Market Value (USD Million) Forecast by End Use Application, 2020-2035
  • Table 30: Eastern Europe Market Volume (Units) Forecast by End Use Application, 2020-2035
  • Table 31: East Asia Market Value (USD Million) Forecast by Country, 2020-2035
  • Table 32: East Asia Market Volume (Units) Forecast by Country, 2020-2035
  • Table 33: East Asia Market Value (USD Million) Forecast by Micronutrients, 2020-2035
  • Table 34: East Asia Market Volume (Units) Forecast by Micronutrients, 2020-2035
  • Table 35: East Asia Market Value (USD Million) Forecast by End Use Application, 2020-2035
  • Table 36: East Asia Market Volume (Units) Forecast by End Use Application, 2020-2035
  • Table 37: South Asia & Pacific Market Value (USD Million) Forecast by Country, 2020-2035
  • Table 38: South Asia & Pacific Market Volume (Units) Forecast by Country, 2020-2035
  • Table 39: South Asia & Pacific Market Value (USD Million) Forecast by Micronutrients, 2020-2035
  • Table 40: South Asia & Pacific Market Volume (Units) Forecast by Micronutrients, 2020-2035
  • Table 41: South Asia & Pacific Market Value (USD Million) Forecast by End Use Application, 2020-2035
  • Table 42: South Asia & Pacific Market Volume (Units) Forecast by End Use Application, 2020-2035
  • Table 43: Middle East and Africa Market Value (USD Million) Forecast by Country, 2020-2035
  • Table 44: Middle East and Africa Market Volume (Units) Forecast by Country, 2020-2035
  • Table 45: Middle East and Africa Market Value (USD Million) Forecast by Micronutrients, 2020-2035
  • Table 46: Middle East and Africa Market Volume (Units) Forecast by Micronutrients, 2020-2035
  • Table 47: Middle East and Africa Market Value (USD Million) Forecast by End Use Application, 2020-2035
  • Table 48: Middle East and Africa Market Volume (Units) Forecast by End Use Application, 2020-2035

List of Figures

  • Figure 1: Global Market Volume (Units) Forecast 2020-2035
  • Figure 2: Global Market Pricing Analysis
  • Figure 3: Global Market Value (USD Million) Forecast 2020-2035
  • Figure 4: Global Market Value Share and BPS Analysis by Micronutrients, 2025 and 2035
  • Figure 5: Global Market Y-o-Y Growth Comparison by Micronutrients, 2025-2035
  • Figure 6: Global Market Attractiveness Analysis by Micronutrients
  • Figure 7: Global Market Value Share and BPS Analysis by End Use Application, 2025 and 2035
  • Figure 8: Global Market Y-o-Y Growth Comparison by End Use Application, 2025-2035
  • Figure 9: Global Market Attractiveness Analysis by End Use Application
  • Figure 10: Global Market Value (USD Million) Share and BPS Analysis by Region, 2025 and 2035
  • Figure 11: Global Market Y-o-Y Growth Comparison by Region, 2025-2035
  • Figure 12: Global Market Attractiveness Analysis by Region
  • Figure 13: North America Market Incremental $ Opportunity, 2025-2035
  • Figure 14: Latin America Market Incremental $ Opportunity, 2025-2035
  • Figure 15: Western Europe Market Incremental $ Opportunity, 2025-2035
  • Figure 16: Eastern Europe Market Incremental $ Opportunity, 2025-2035
  • Figure 17: East Asia Market Incremental $ Opportunity, 2025-2035
  • Figure 18: South Asia & Pacific Market Incremental $ Opportunity, 2025-2035
  • Figure 19: Middle East and Africa Market Incremental $ Opportunity, 2025-2035
  • Figure 20: North America Market Value Share and BPS Analysis by Country, 2025 and 2035
  • Figure 21: North America Market Value Share and BPS Analysis by Micronutrients, 2025 and 2035
  • Figure 22: North America Market Y-o-Y Growth Comparison by Micronutrients, 2025-2035
  • Figure 23: North America Market Attractiveness Analysis by Micronutrients
  • Figure 24: North America Market Value Share and BPS Analysis by End Use Application, 2025 and 2035
  • Figure 25: North America Market Y-o-Y Growth Comparison by End Use Application, 2025-2035
  • Figure 26: North America Market Attractiveness Analysis by End Use Application
  • Figure 27: Latin America Market Value Share and BPS Analysis by Country, 2025 and 2035
  • Figure 28: Latin America Market Value Share and BPS Analysis by Micronutrients, 2025 and 2035
  • Figure 29: Latin America Market Y-o-Y Growth Comparison by Micronutrients, 2025-2035
  • Figure 30: Latin America Market Attractiveness Analysis by Micronutrients
  • Figure 31: Latin America Market Value Share and BPS Analysis by End Use Application, 2025 and 2035
  • Figure 32: Latin America Market Y-o-Y Growth Comparison by End Use Application, 2025-2035
  • Figure 33: Latin America Market Attractiveness Analysis by End Use Application
  • Figure 34: Western Europe Market Value Share and BPS Analysis by Country, 2025 and 2035
  • Figure 35: Western Europe Market Value Share and BPS Analysis by Micronutrients, 2025 and 2035
  • Figure 36: Western Europe Market Y-o-Y Growth Comparison by Micronutrients, 2025-2035
  • Figure 37: Western Europe Market Attractiveness Analysis by Micronutrients
  • Figure 38: Western Europe Market Value Share and BPS Analysis by End Use Application, 2025 and 2035
  • Figure 39: Western Europe Market Y-o-Y Growth Comparison by End Use Application, 2025-2035
  • Figure 40: Western Europe Market Attractiveness Analysis by End Use Application
  • Figure 41: Eastern Europe Market Value Share and BPS Analysis by Country, 2025 and 2035
  • Figure 42: Eastern Europe Market Value Share and BPS Analysis by Micronutrients, 2025 and 2035
  • Figure 43: Eastern Europe Market Y-o-Y Growth Comparison by Micronutrients, 2025-2035
  • Figure 44: Eastern Europe Market Attractiveness Analysis by Micronutrients
  • Figure 45: Eastern Europe Market Value Share and BPS Analysis by End Use Application, 2025 and 2035
  • Figure 46: Eastern Europe Market Y-o-Y Growth Comparison by End Use Application, 2025-2035
  • Figure 47: Eastern Europe Market Attractiveness Analysis by End Use Application
  • Figure 48: East Asia Market Value Share and BPS Analysis by Country, 2025 and 2035
  • Figure 49: East Asia Market Value Share and BPS Analysis by Micronutrients, 2025 and 2035
  • Figure 50: East Asia Market Y-o-Y Growth Comparison by Micronutrients, 2025-2035
  • Figure 51: East Asia Market Attractiveness Analysis by Micronutrients
  • Figure 52: East Asia Market Value Share and BPS Analysis by End Use Application, 2025 and 2035
  • Figure 53: East Asia Market Y-o-Y Growth Comparison by End Use Application, 2025-2035
  • Figure 54: East Asia Market Attractiveness Analysis by End Use Application
  • Figure 55: South Asia & Pacific Market Value Share and BPS Analysis by Country, 2025 and 2035
  • Figure 56: South Asia & Pacific Market Value Share and BPS Analysis by Micronutrients, 2025 and 2035
  • Figure 57: South Asia & Pacific Market Y-o-Y Growth Comparison by Micronutrients, 2025-2035
  • Figure 58: South Asia & Pacific Market Attractiveness Analysis by Micronutrients
  • Figure 59: South Asia & Pacific Market Value Share and BPS Analysis by End Use Application, 2025 and 2035
  • Figure 60: South Asia & Pacific Market Y-o-Y Growth Comparison by End Use Application, 2025-2035
  • Figure 61: South Asia & Pacific Market Attractiveness Analysis by End Use Application
  • Figure 62: Middle East and Africa Market Value Share and BPS Analysis by Country, 2025 and 2035
  • Figure 63: Middle East and Africa Market Value Share and BPS Analysis by Micronutrients, 2025 and 2035
  • Figure 64: Middle East and Africa Market Y-o-Y Growth Comparison by Micronutrients, 2025-2035
  • Figure 65: Middle East and Africa Market Attractiveness Analysis by Micronutrients
  • Figure 66: Middle East and Africa Market Value Share and BPS Analysis by End Use Application, 2025 and 2035
  • Figure 67: Middle East and Africa Market Y-o-Y Growth Comparison by End Use Application, 2025-2035
  • Figure 68: Middle East and Africa Market Attractiveness Analysis by End Use Application
  • Figure 69: Global Market - Tier Structure Analysis
  • Figure 70: Global Market - Company Share Analysis

Frequently Asked Questions

What is the projected size of the fortified eggs market in 2025?

The market is valued at USD 451.5 million in 2025.

What is the outlook on fortified eggs demand by 2035?

The market is forecasted to reach USD 974.9 million by 2035, reflecting a CAGR of 8.0%.

Which micronutrient leads the fortified eggs market in 2025?

Omega-3 fatty acids are expected to lead the market with a 45% share in 2025.

What is the projected share of retail/household in the fortified eggs market by 2025?

Retail/household is expected to hold a 60% share of the market in 2025.

Which country is projected to have the fastest-growing fortified eggs market?

The USA is anticipated to be the fastest-growing market with a CAGR of 8.1% from 2025 to 2035.

Explore Similar Insights

Future Market Insights

Fortified Eggs Market