Reports

- Global Locations -

Headquarters

Future Market Insights, Inc.

Christiana Corporate, 200
Continental Drive, Suite 401,
Newark, Delaware - 19713,
United States

T: +1-845-579-5705

Americas

Future Market Insights, Inc.

616 Corporate Way, Suite 2-9018,
Valley Cottage, NY 10989, United States

T: +1-347-918-3531

MEA

Future Market Insights

1602-6 Jumeirah Bay X2 Tower, Plot No: JLT-PH2-X2A,
Jumeirah Lakes Towers, Dubai,
United Arab Emirates

Europe

Future Market Insights

3rd Floor, 207 Regent Street,
W1B 3HH London
United Kingdom

T: + 44 (0) 20 8123 9659
D: +44 (0) 20 3287 4268

Asia Pacific

Future Market Insights

IndiaLand Global Tech Park, Unit UG-1, Behind Grand HighStreet, Phase 1, Hinjawadi, MH, Pune – 411057, India

Fortified Rice Market Outlook- 2023 to 2033

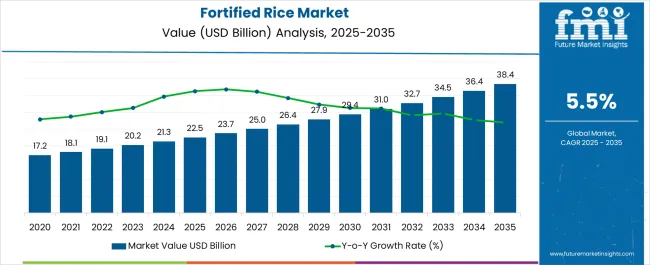
The global market for fortified rice is estimated to reach US$ 34.50 billion by 2033, up from US$ 20.20 billion in 2023, recording a CAGR of 5.5%.

The food & beverage industry is expected to drive the growth of the global market for high acyl l fortified rice for texture in milk products, plant-based protein drinks, fruit juices, and other beverages. High-acyl-fortified rice is used as a suspension agent in milk products, plant-based protein drinks, fruit juices, and other beverages.

The global market for fortified rice is expanding rapidly as a result of the sustainable and economical steps that producers are taking to ensure that the populace has access to nutrients. Another major reason for the market's growth is the growing initiative of manufacturers to enhance the nutritional value of rice. It is also becoming more common for governments across the globe to take initiative to improve the nutritional content of food products.

People around the world suffer from micronutrient deficiencies that can affect productivity, the development of organs, and health. For instance, India has a child population that is almost half malnourished and deficient in vitamins and minerals. It is possible to alleviate the issue by enriching regular foods like rice with minerals & vitamins along with micronutrient supplementation and diet diversification. This has led to the fortification of rice, which is emerging as a sustainable & cost-effective measure for providing nutrition to people globally.

Fortified rice market growth is anticipated to be driven by consumer awareness of health and healthy food products around the world over the forecast period. The demand for the fortified rice market is driven by an increase in nutritional deficiencies in the worldwide population. This is a result of an increase in demand for fortified rice. The fortified rice market growth is expected to be boosted by increasing rice consumption as food in the coming years.

The fortified rice market growth is expected to be positively impacted by the growing population and increasing disposable incomes of consumers. However, the high cost associated with various technologies for improving rice is predicted to hinder the growth of the fortified rice market during the forecast period. This is due to the high cost associated with these technologies.

Attributes Details
Fortified Rice Market Value (2023) US$ 20.20 billion
Fortified Rice Market Expected Value (2033) US$ 34.50 billion
Fortified Rice Market Projected CAGR (2023 to 2033) 5.5%

Don't pay for what you don't need

Customize your report by selecting specific countries or regions and save 30%!

Global Fortified Rice Market Historical Analysis (2018 to 2022) Vs. Forecast Outlook (2023 to 2033)

The global fortified rice market recorded a CAGR of 6.4% over the past 10 years. The market is expected to record a CAGR of close to 5.5% over the forecast period.

Adding essential micronutrients to rice, such as calcium, vitamin B12, iron, and folic acid, is a cost-effective complementary strategy for improving the nutritional content of rice. To solve malnutrition problems in any region, rice can be fortified. Rice is categorized into different varieties and is known for its nutrient-rich nature.

These changes in growth rate have been attributed to an improvement in end user demand in key economies and their growing populations, as well as the slow/rapid adoption of the market during the first half of the forecast period.

Infertile soil and inherent inefficiencies, for example, lead to the loss of nutrients in black rice, which is rich in proteins, fiber, carbohydrates, antioxidants, and anthocyanins. As a result, food fortification has emerged as a key strategy used by international organizations to tackle nutrient deficiencies all over the world, including the UN Food and Agriculture Organization (FAO) and the World Health Organization (WHO).

  • Short Term (2022 to 2025): During the post-pandemic period, environmental complications, inflation soaring, and unemployment rates rising are said to limit the market growth.
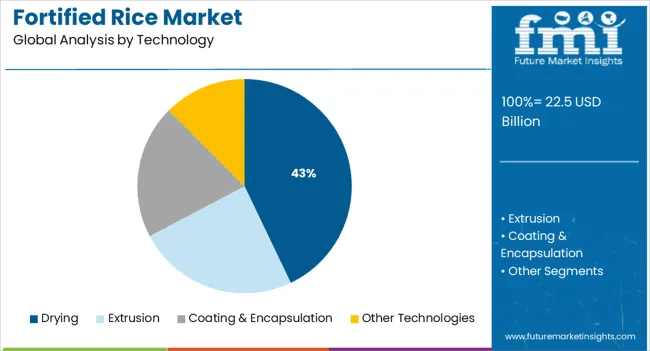
  • Medium Term (2025 to 2028): Technology such as coating and encapsulation is expected to see a relatively quicker adoption by 2026 than other technologies. However, the fortified rice market will continue to lead in terms of revenue through 2026.
  • Long Term (2028 to 2033): International agencies and governments are expanding initiatives to eradicate nutrient deficiencies around the world. They are broadening health consciousness among people due to rapid urbanization and an increasing standard of living. The overwhelming consumption of rice across geographies.
Historical CAGR (2018 to 2022) 6.4%
Historical Market Value (2022) US$ 19.14 billion
Forecast CAGR 5.5%

Comparative Analysis of Adjacent Fortified Rice Markets

Fortified Rice Market:

Differentiating Aspects Fortified Rice Market
CAGR (2023 to 2033) 5.5%
Market Valuation in 2023 US$ 20.20 billion
Projected Market Value in 2033 US$ 34.50 billion
Growth Factors Malnourishment or lack of nutrients in diet among the population.
Opportunities Providing nutrition to people globally in a sustainable and cost-effective manner.
Key Trends Emerged as a key to reducing nutrition deficiencies.

Fortified Eggs Market:

Differentiating Aspects Fortified Eggs Market
CAGR (2023 to 2033) 8.1%
Market Valuation in 2023 US$ 382.89 million
Projected Market Value in 2033 US$ 834.32 million
Growth Factors Increased consumption of processed foods due to the easy availability of products.
Opportunities Rising usage in bakery and confectionery Items.
Key Trends Greater demand for nutritious foods with more nutrients.

Fortified Dairy Products Market:

Differentiating Aspects Fortified Dairy Products Market
CAGR (2023 to 2033) 6.5%
Market Valuation in 2023 US$ 116601.53 million
Projected Market Value in 2033 US$ 218877.09 million
Growth Factors Growing awareness about malnourishment among the kids.
Opportunities Multiple channels are available for the distribution of fortified milk products.
Key Trends Increased adoption of fortification technology in yogurt.
Nandini Roy Choudhury

Principal Consultant

Talk to Analyst

Find your sweet spots for generating winning opportunities in this market.

Major Factors Driving the Fortified Rice Market

Consumption of Rice in Different Cuisines is on the Rise

Over the past decade, global rice consumption has grown radically. From 2008 to 2009 crop year produced 437.18 million metric tons, while from 2021 to 2022 crop year produced 509.87 million metric tons. In Asia Pacific, rice is much more than just food, so a significant portion of this consumption can be attributed to them.

Approximately 154.9 million metric tons of rice were consumed by China in 2021, whereas 103.5 million metric tons were consumed by India. India's rice consumption per capita in 2021 reached around 6.8 kilograms. The availability of fortified rice due to an expanding retail network and rising consumer awareness of health issues are attracting customers.

Malnutrition Incidence in Low-income Countries is being addressed by Government Initiatives

In 2021, nearly 17.7 lacs (1.7 million) Indian children suffered from severe acute malnutrition, according to the Women and Child Development Ministry. Somalia, with a 50.8 Hunger Index in 2021, was the world's most malnourished country, according to the International Food Policy Research Institute's Hunger Index.

International organizations like the World Health Organization and the Food and Research Organization have adopted food fortification as a core strategy to rehabilitate the situation. At the individual level, the government is doing its part to solve the problem.

As an example, in 2021, the government in India announced that fortified rice would be distributed in the country under the Mid-Day Meal and Public Distribution System schemes by 2024.

Major Challenges Faced by the Fortified Rice Market

Post-pandemic Unemployment, Rising Inflation, and Environmental Hazards

As pesticide use disrupts biotic communities in the soil, pesticide use in conventional agriculture is the primary reason for the disruption of the soil carbon sequestration process. Pesticides kill the worms and insects that break down dung and leaf litter and maintain soil nutrients; as a result, fertility issues are rising at an unprecedented rate.

According to a report published by CMIE in 2022, with a 1.09 % hike in unemployment rates in metropolitan areas in India, the unemployment rate reached 9.3 %. However, soaring unemployment and inflation rates worldwide pose a severe threat to the aforementioned market.

The unemployment rate in rural areas, on the other hand, increased from 6.44 % to 7.28 % by 0.84 %. A global wave of staggering inflation has also been unleashed as a result of rising crude oil prices. Together, these factors hinder the fortified rice market.

Get the data you need at a Fraction of the cost

Personalize your report by choosing insights you need
and save 40%!

Fortified Rice Market Category-Wise Insights

Fortified Rice Market Segment Analysis - By Nature

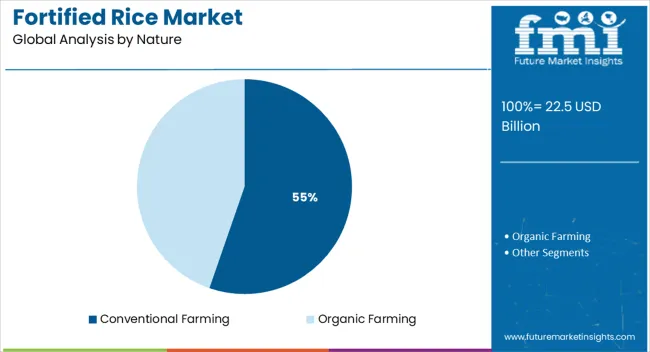
Based on its nature, the fortified rice market can be divided into two segments. The non-organic segment accounted for the significant share in 2023, primarily because conventionally produced cereal grains are readily available. The objective of conventional farming is to boost crop yields as much as possible without using pesticides.

Conventional farming curbs expenses and maximizes farmers' revenue by utilizing less labor and producing more on a smaller amount of land; therefore, farmers' revenue is maximized. Non-organic rice can be obtained around the corner regardless of geography, unlike organic rice. Despite this, the organic segment is expected to record at the considerable rate with a CAGR of 8.6% between 2023 and 2033.

Due to conventional farming's shortcomings, such as harmful effects on the environment, health problems, adverse effects on animals, a high risk of plant bugs, and many others, the demand for organic products is soaring as consumers become increasingly aware of their health and environmental health.

Fortified Rice Market Segment Analysis - By Distribution Channel

Fortified rice is distributed offline (supermarkets, convenience stores, brick-and-mortar stores) and online. In 2023, the offline segment held the significant share. This growth can be attributed to its comprehensive presence in both metropolitan and rural areas.

In contrast, online or e-commerce services are often subject to certain requirements, such as a suitable infrastructure to function properly; otherwise, doorstep delivery is not feasible. The majority also prefer shopping offline because of advantages such as instant purchases, hassle-free returns, bulk purchases, bargains, and quality checks.

The growing existence of modern outlets like supermarkets has attracted billions of consumers worldwide because of their well-established nature, easy shopping, lucrative sales, and one-stop shopping experience. It is expected that online shopping will grow at the significant rate with a 7.7% CAGR during the forecast period.

This growth can be attributed to technological advancements like Google maps and e-banking. All-weather network access, the time-saving nature of e-commerce purchases, and the increasing number of smartphone users are driving people to online platforms.

Region Wise: Asia Pacific Dominates the Market

It is common for Asian countries excluding Japan (APEJ) to possess centralized rice milling industries, which facilitate rice fortification. Having a reliable channel to reach people in dire need of nutrition, these countries have significant safety nets, which distribute fortified rice subsidized to populations below the poverty line.

As a result of the presence of world-leading rice-growing countries in the region, Asia Pacific held the significant share of the overall market in 2023, accounting for 43% of the overall market. India produces more than 170 million tons of rice every year. The majority of rice is produced in Asian countries, including the Philippines, Indonesia, Bangladesh, Vietnam, Pakistan, and Thailand.

According to a report, nearly 85-90 % of global rice consumption is accounted for by Asian countries, and nearly 60 % is accounted by Indonesia, India, and China. Asia Pacific is expected to be the significant segment over the forecast period. This growth is owing to high incidences of malnourishment in Asia Pacific.

Rising disposable incomes with the flourishing of economies, increasing health consciousness among people, and soaring government initiatives to eradicate nutrient deficiency problems. According to the 2016 Census, the population of Asia Pacific was 4741.4 million, but in 2017 it is 4912.3 million.

Countries Leading in Fortified Rice Market: Country-Wise Analysis

What Makes the United States a Leader in the Fortified Rice Market in North America?

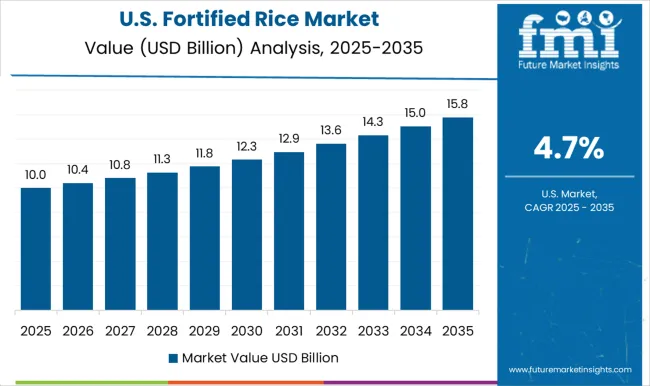
The United States dominates the fortified rice market in North America with a total market share of 51% in 2023 and is projected to continue exhibiting high demand through over the forecast period. The United States fortified rice market is estimated to record a CAGR of 3.8% and is projected to surpass the value of US$ 5.26 billion in 2023.

A significant supply of raw materials is readily available in the United States to create fortified rice, which has led to tremendous growth in the fortified rice market. Several factors are driving the fortified rice market in the United States., including increased nutrition and health expenditures, disposable income, and consumer awareness of healthy foods.
Why is the market for Fortified Rice in Germany regarded as profitable in Europe?

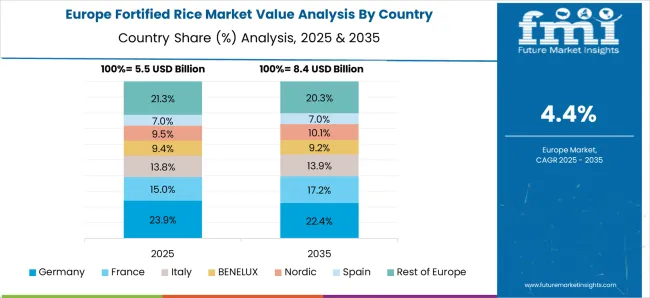
Germany dominates the fortified rice market in Europe, with a share of 30%. The fortified rice market in Germany is estimated to record a CAGR of 3.7%. Due to the increasing number of people with gluten allergies and coeliac disease, gluten-free products are becoming more popular. Both adults and children are being diagnosed with gluten allergies and coeliac disease at an increased rate; thus, gluten-free products help to drive market growth in Germany.

What Makes China Fortified Rice Market Highly Attractive?

China holds a 40% share in Asia Pacific and is projected to record a CAGR of over 9.2%. The market size of US$ 8.82 billion is expected to reach by 2033. With more than 210 million tons of production, China is the world's second-largest rice producer, and it accounts for almost 20% of the market for fortified rice. A significant part of the reason for the growth of fortified rice is due to factors such as the presence of world-leading rice-producing manufacturers in China.

Start-up Ecosystem: The Fortified Rice Market

While fortified rice may be affordable, it can be tough to start a business based on the price of raw materials. As the availability of cost-effective raw materials increases, fortified rice products are expected to be introduced soon, providing ample growth opportunities.

When a variety of businesses offer the same product, the market will expand significantly. With the emergence of food start-ups, this rising potential has spurred food companies to take advantage of it. Companies and producers will develop cost-effective solutions to meet demand.

For fortified rice production, fixed costs, such as initial capital investment for equipment and facilities, are primarily influenced by the choice of technology. Among the various technologies, coating and encapsulation require relatively lower capital investments.
Competitive Landscape

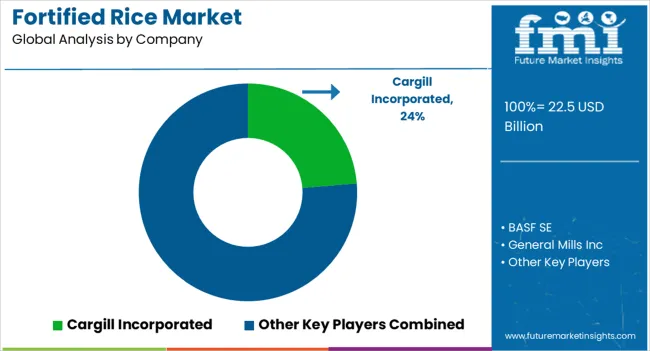
Several strategies are employed by key manufacturers to compete in an increasingly competitive environment, including new product launches and approvals, mergers and acquisitions, partnerships, and collaborations. The prominent companies are as follows:

  • Cargill Incorporated
  • BASF SE
  • General Mills Inc
  • Willmar International Ltd
  • Aroma Fields
  • KRBL Ltd
  • Bunge Ltd
  • REI Agro Ltd
  • LT Foods
  • Hain Celestial (Tida Rice)

Recent Development:

A coalition of key players in the global fortified rice market, including private and public sectors, is focusing on addressing growth barriers to the implementation of fortified rice around the world.

  • A renowned food company based in Minnesota, the United States, and Cargill has submitted a bid to acquire Sanderson farms in Mississippi, the United States. It was approved by Sanderson's stockholders. The acquisition is worth around US$ 4.5 billion ($203 per share).
  • "LT Foods," a rice milling company based in Gurugram, India, announced on January 20, 2021, that it had purchased a 30 percent stake in Leev.nu, the Netherlands-based packaged food company. As part of the acquisition, LT acquired organic food producer Nature Bio Foods BV (a subsidiary of LT). The transaction aimed to strengthen Nature Bio's snacking business.
  • The Madrid, Spain-based food processing company “Ebro Foods”, known for its significant amount of rice production, announced the successful acquisition of Tuna Rice from New York-based Hain Celestial on August 28, 2019. For the acquisition to be completed, Ebro made a cash payment of $342 million (all cash).

Scope of Report

Attribute Details
Forecast Period 2023 to 2033
Historical Data Available for 2018 to 2022
Market Analysis US$ million for Value and MT for Volume
Key Regions Covered
  • North America
  • Latin America
  • Europe
  • The Middle East and Africa
  • East Asia
Key Countries Covered The United States, Canada, Brazil, Mexico, Chile, Peru, Germany, the United Kingdom, Spain, Italy, France, Russia, Poland, China, India, Japan, Australia, New Zealand, GCC Countries, North Africa, South Africa, and Türkiye
Key Segments Covered
  • Micronutrients
  • Technology
  • Distribution Channel
  • Region
Key Companies Profiled
  • Cargill Incorporated
  • BASF SE
  • General Mills Inc
  • Willmar International Ltd
  • Aroma Fields
  • KRBL Ltd
  • Bunge Ltd
  • REI Agro Ltd
  • LT Foods
  • Hain Celestial (Tida Rice)
Report Coverage Market Forecast, Company Share Analysis, Competition Intelligence, DROT Analysis, Market Dynamics and Challenges, and Strategic Growth Initiatives
Customization & Pricing Available upon Request

Fortified Rice Market Segmentation by Category

By Micronutrients:

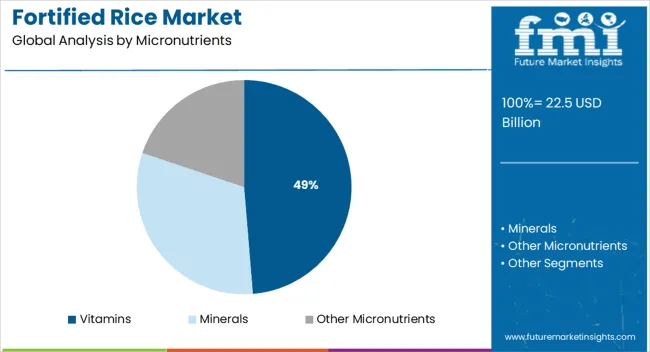
  • Vitamins
  • Minerals
  • Other Micronutrients

By Technology:

  • Drying
  • Extrusion
  • Coating & Encapsulation
  • Other Technologies

By Nature:

  • Conventional Farming
  • Organic Farming

By Distribution Channel:

  • Modern Trade
  • Convenience Stores
  • Departmental Stores
  • Drug Stores
  • Online Stores
  • Other Distribution Channels

By End-Use:

  • Residential
  • Commercial

By Region:

  • North America
  • Latin America
  • Europe
  • The Middle East and Africa
  • East Asia

Frequently Asked Questions

How Big is the Fortified Rice Market?

The market is valued at US$ 20.20 billion in 2023.

Who are the Key Fortified Rice Market Players?

Cargill Inc., BASF SE, General Mills Inc, and more are key players.

Which is the Key Segment by Micronutrients?

Vitamins, minerals, and other micronutrients are key segments.

What is the Go-to Market Strategy for Fortified Rice?

The market strategy involves product diversification and expanded distribution channels.

Which are the Key Asian Countries in the Fortified Rice Market?

China and India are key Asian countries in the market.

Table of Content

1. Executive Summary | Fortified Rice Market

    1.1. Global Market Outlook

    1.2. Demand-side Trends

    1.3. Supply-side Trends

    1.4. Technology Roadmap Analysis

    1.5. Analysis and Recommendations

2. Market Overview

    2.1. Market Coverage / Taxonomy

    2.2. Market Definition / Scope / Limitations

3. Market Background

    3.1. Market Dynamics

        3.1.1. Drivers

        3.1.2. Restraints

        3.1.3. Opportunity

        3.1.4. Trends

    3.2. Scenario Forecast

        3.2.1. Demand in Optimistic Scenario

        3.2.2. Demand in Likely Scenario

        3.2.3. Demand in Conservative Scenario

    3.3. Opportunity Map Analysis

    3.4. Product Life Cycle Analysis

    3.5. Supply Chain Analysis

        3.5.1. Supply Side Participants and their Roles

            3.5.1.1. Producers

            3.5.1.2. Mid-Level Participants (Traders/ Agents/ Brokers)

            3.5.1.3. Wholesalers and Distributors

        3.5.2. Value Added and Value Created at Node in the Supply Chain

        3.5.3. List of Raw Material Suppliers

        3.5.4. List of Existing and Potential Buyer’s

    3.6. Investment Feasibility Matrix

    3.7. Value Chain Analysis

        3.7.1. Profit Margin Analysis

        3.7.2. Wholesalers and Distributors

        3.7.3. Retailers

    3.8. PESTLE and Porter’s Analysis

    3.9. Regulatory Landscape

        3.9.1. By Key Regions

        3.9.2. By Key Countries

    3.10. Regional Parent Market Outlook

    3.11. Production and Consumption Statistics

    3.12. Import and Export Statistics

4. Global Market Analysis 2018 to 2022 and Forecast, 2023 to 2033

    4.1. Historical Market Size Value (US$ Million) & Volume (Tons) Analysis, 2018 to 2022

    4.2. Current and Future Market Size Value (US$ Million) & Volume (Tons) Projections, 2023 to 2033

        4.2.1. Y-o-Y Growth Trend Analysis

        4.2.2. Absolute $ Opportunity Analysis

5. Global Market Analysis 2018 to 2022 and Forecast 2023 to 2033, By Nature

    5.1. Introduction / Key Findings

    5.2. Historical Market Size Value (US$ Million) & Volume (Tons) Analysis By Nature , 2018 to 2022

    5.3. Current and Future Market Size Value (US$ Million) & Volume (Tons) Analysis and Forecast By Nature , 2023 to 2033

        5.3.1. Organic

        5.3.2. Conventional

    5.4. Y-o-Y Growth Trend Analysis By Nature , 2018 to 2022

    5.5. Absolute $ Opportunity Analysis By Nature , 2023 to 2033

6. Global Market Analysis 2018 to 2022 and Forecast 2023 to 2033, By Micronutrients

    6.1. Introduction / Key Findings

    6.2. Historical Market Size Value (US$ Million) & Volume (Tons) Analysis By Micronutrients , 2018 to 2022

    6.3. Current and Future Market Size Value (US$ Million) & Volume (Tons) Analysis and Forecast By Micronutrients , 2023 to 2033

        6.3.1. Vitamins

        6.3.2. Minerals

        6.3.3. Others

    6.4. Y-o-Y Growth Trend Analysis By Micronutrients , 2018 to 2022

    6.5. Absolute $ Opportunity Analysis By Micronutrients , 2023 to 2033

7. Global Market Analysis 2018 to 2022 and Forecast 2023 to 2033, By Technology

    7.1. Introduction / Key Findings

    7.2. Historical Market Size Value (US$ Million) & Volume (Tons) Analysis By Technology , 2018 to 2022

    7.3. Current and Future Market Size Value (US$ Million) & Volume (Tons) Analysis and Forecast By Technology , 2023 to 2033

        7.3.1. Coating

        7.3.2. Encapsulation

        7.3.3. Hot Extrusion

        7.3.4. Drying

        7.3.5. Others

    7.4. Y-o-Y Growth Trend Analysis By Technology , 2018 to 2022

    7.5. Absolute $ Opportunity Analysis By Technology , 2023 to 2033

8. Global Market Analysis 2018 to 2022 and Forecast 2023 to 2033, By Distribution Channel

    8.1. Introduction / Key Findings

    8.2. Historical Market Size Value (US$ Million) & Volume (Tons) Analysis By Distribution Channel, 2018 to 2022

    8.3. Current and Future Market Size Value (US$ Million) & Volume (Tons) Analysis and Forecast By Distribution Channel, 2023 to 2033

        8.3.1. Offline

            8.3.1.1. Supermarkets

            8.3.1.2. Convenience Stores

            8.3.1.3. Brick-and-Mortar

        8.3.2. Online

    8.4. Y-o-Y Growth Trend Analysis By Distribution Channel, 2018 to 2022

    8.5. Absolute $ Opportunity Analysis By Distribution Channel, 2023 to 2033

9. Global Market Analysis 2018 to 2022 and Forecast 2023 to 2033, By End User

    9.1. Introduction / Key Findings

    9.2. Historical Market Size Value (US$ Million) & Volume (Tons) Analysis By End User, 2018 to 2022

    9.3. Current and Future Market Size Value (US$ Million) & Volume (Tons) Analysis and Forecast By End User, 2023 to 2033

        9.3.1. Commercial

        9.3.2. Residential

    9.4. Y-o-Y Growth Trend Analysis By End User, 2018 to 2022

    9.5. Absolute $ Opportunity Analysis By End User, 2023 to 2033

10. Global Market Analysis 2018 to 2022 and Forecast 2023 to 2033, By Region

    10.1. Introduction

    10.2. Historical Market Size Value (US$ Million) & Volume (Tons) Analysis By Region, 2018 to 2022

    10.3. Current Market Size Value (US$ Million) & Volume (Tons) Analysis and Forecast By Region, 2023 to 2033

        10.3.1. North America

        10.3.2. Latin America

        10.3.3. Europe

        10.3.4. Asia Pacific

        10.3.5. Middle East & Africa (MEA)

    10.4. Market Attractiveness Analysis By Region

11. North America Market Analysis 2018 to 2022 and Forecast 2023 to 2033, By Country

    11.1. Historical Market Size Value (US$ Million) & Volume (Tons) Trend Analysis By Market Taxonomy, 2018 to 2022

    11.2. Market Size Value (US$ Million) & Volume (Tons) Forecast By Market Taxonomy, 2023 to 2033

        11.2.1. By Country

            11.2.1.1. The USA

            11.2.1.2. Canada

        11.2.2. By Nature

        11.2.3. By Micronutrients

        11.2.4. By Technology

        11.2.5. By Distribution Channel

        11.2.6. By End User

    11.3. Market Attractiveness Analysis

        11.3.1. By Country

        11.3.2. By Nature

        11.3.3. By Micronutrients

        11.3.4. By Technology

        11.3.5. By Distribution Channel

        11.3.6. By End User

    11.4. Key Takeaways

12. Latin America Market Analysis 2018 to 2022 and Forecast 2023 to 2033, By Country

    12.1. Historical Market Size Value (US$ Million) & Volume (Tons) Trend Analysis By Market Taxonomy, 2018 to 2022

    12.2. Market Size Value (US$ Million) & Volume (Tons) Forecast By Market Taxonomy, 2023 to 2033

        12.2.1. By Country

            12.2.1.1. Brazil

            12.2.1.2. Mexico

            12.2.1.3. Rest of Latin America

        12.2.2. By Nature

        12.2.3. By Micronutrients

        12.2.4. By Technology

        12.2.5. By Distribution Channel

        12.2.6. By End User

    12.3. Market Attractiveness Analysis

        12.3.1. By Country

        12.3.2. By Nature

        12.3.3. By Micronutrients

        12.3.4. By Technology

        12.3.5. By Distribution Channel

        12.3.6. By End User

    12.4. Key Takeaways

13. Europe Market Analysis 2018 to 2022 and Forecast 2023 to 2033, By Country

    13.1. Historical Market Size Value (US$ Million) & Volume (Tons) Trend Analysis By Market Taxonomy, 2018 to 2022

    13.2. Market Size Value (US$ Million) & Volume (Tons) Forecast By Market Taxonomy, 2023 to 2033

        13.2.1. By Country

            13.2.1.1. Germany

            13.2.1.2. United Kingdom (UK)

            13.2.1.3. France

            13.2.1.4. Spain

            13.2.1.5. Italy

            13.2.1.6. Rest of Europe

        13.2.2. By Nature

        13.2.3. By Micronutrients

        13.2.4. By Technology

        13.2.5. By Distribution Channel

        13.2.6. By End User

    13.3. Market Attractiveness Analysis

        13.3.1. By Country

        13.3.2. By Nature

        13.3.3. By Micronutrients

        13.3.4. By Technology

        13.3.5. By Distribution Channel

        13.3.6. By End User

    13.4. Key Takeaways

14. Asia Pacific Market Analysis 2018 to 2022 and Forecast 2023 to 2033, By Country

    14.1. Historical Market Size Value (US$ Million) & Volume (Tons) Trend Analysis By Market Taxonomy, 2018 to 2022

    14.2. Market Size Value (US$ Million) & Volume (Tons) Forecast By Market Taxonomy, 2023 to 2033

        14.2.1. By Country

            14.2.1.1. China

            14.2.1.2. Japan

            14.2.1.3. South Korea

            14.2.1.4. Singapore

            14.2.1.5. Thailand

            14.2.1.6. Indonesia

            14.2.1.7. Australia

            14.2.1.8. New Zealand

            14.2.1.9. Rest of Asia Pacific

        14.2.2. By Nature

        14.2.3. By Micronutrients

        14.2.4. By Technology

        14.2.5. By Distribution Channel

        14.2.6. By End User

    14.3. Market Attractiveness Analysis

        14.3.1. By Country

        14.3.2. By Nature

        14.3.3. By Micronutrients

        14.3.4. By Technology

        14.3.5. By Distribution Channel

        14.3.6. By End User

    14.4. Key Takeaways

15. MEA Market Analysis 2018 to 2022 and Forecast 2023 to 2033, By Country

    15.1. Historical Market Size Value (US$ Million) & Volume (Tons) Trend Analysis By Market Taxonomy, 2018 to 2022

    15.2. Market Size Value (US$ Million) & Volume (Tons) Forecast By Market Taxonomy, 2023 to 2033

        15.2.1. By Country

            15.2.1.1. GCC Countries

            15.2.1.2. South Africa

            15.2.1.3. Israel

            15.2.1.4. Rest of MEA

        15.2.2. By Nature

        15.2.3. By Micronutrients

        15.2.4. By Technology

        15.2.5. By Distribution Channel

        15.2.6. By End User

    15.3. Market Attractiveness Analysis

        15.3.1. By Country

        15.3.2. By Nature

        15.3.3. By Micronutrients

        15.3.4. By Technology

        15.3.5. By Distribution Channel

        15.3.6. By End User

    15.4. Key Takeaways

16. Key Countries Market Analysis

    16.1. USA

        16.1.1. Pricing Analysis

        16.1.2. Market Share Analysis, 2022

            16.1.2.1. By Nature

            16.1.2.2. By Micronutrients

            16.1.2.3. By Technology

            16.1.2.4. By Distribution Channel

            16.1.2.5. By End User

    16.2. Canada

        16.2.1. Pricing Analysis

        16.2.2. Market Share Analysis, 2022

            16.2.2.1. By Nature

            16.2.2.2. By Micronutrients

            16.2.2.3. By Technology

            16.2.2.4. By Distribution Channel

            16.2.2.5. By End User

    16.3. Brazil

        16.3.1. Pricing Analysis

        16.3.2. Market Share Analysis, 2022

            16.3.2.1. By Nature

            16.3.2.2. By Micronutrients

            16.3.2.3. By Technology

            16.3.2.4. By Distribution Channel

            16.3.2.5. By End User

    16.4. Mexico

        16.4.1. Pricing Analysis

        16.4.2. Market Share Analysis, 2022

            16.4.2.1. By Nature

            16.4.2.2. By Micronutrients

            16.4.2.3. By Technology

            16.4.2.4. By Distribution Channel

            16.4.2.5. By End User

    16.5. Germany

        16.5.1. Pricing Analysis

        16.5.2. Market Share Analysis, 2022

            16.5.2.1. By Nature

            16.5.2.2. By Micronutrients

            16.5.2.3. By Technology

            16.5.2.4. By Distribution Channel

            16.5.2.5. By End User

    16.6. United Kingdom

        16.6.1. Pricing Analysis

        16.6.2. Market Share Analysis, 2022

            16.6.2.1. By Nature

            16.6.2.2. By Micronutrients

            16.6.2.3. By Technology

            16.6.2.4. By Distribution Channel

            16.6.2.5. By End User

    16.7. France

        16.7.1. Pricing Analysis

        16.7.2. Market Share Analysis, 2022

            16.7.2.1. By Nature

            16.7.2.2. By Micronutrients

            16.7.2.3. By Technology

            16.7.2.4. By Distribution Channel

            16.7.2.5. By End User

    16.8. Spain

        16.8.1. Pricing Analysis

        16.8.2. Market Share Analysis, 2022

            16.8.2.1. By Nature

            16.8.2.2. By Micronutrients

            16.8.2.3. By Technology

            16.8.2.4. By Distribution Channel

            16.8.2.5. By End User

    16.9. Italy

        16.9.1. Pricing Analysis

        16.9.2. Market Share Analysis, 2022

            16.9.2.1. By Nature

            16.9.2.2. By Micronutrients

            16.9.2.3. By Technology

            16.9.2.4. By Distribution Channel

            16.9.2.5. By End User

    16.10. China

        16.10.1. Pricing Analysis

        16.10.2. Market Share Analysis, 2022

            16.10.2.1. By Nature

            16.10.2.2. By Micronutrients

            16.10.2.3. By Technology

            16.10.2.4. By Distribution Channel

            16.10.2.5. By End User

    16.11. Japan

        16.11.1. Pricing Analysis

        16.11.2. Market Share Analysis, 2022

            16.11.2.1. By Nature

            16.11.2.2. By Micronutrients

            16.11.2.3. By Technology

            16.11.2.4. By Distribution Channel

            16.11.2.5. By End User

    16.12. South Korea

        16.12.1. Pricing Analysis

        16.12.2. Market Share Analysis, 2022

            16.12.2.1. By Nature

            16.12.2.2. By Micronutrients

            16.12.2.3. By Technology

            16.12.2.4. By Distribution Channel

            16.12.2.5. By End User

    16.13. Singapore

        16.13.1. Pricing Analysis

        16.13.2. Market Share Analysis, 2022

            16.13.2.1. By Nature

            16.13.2.2. By Micronutrients

            16.13.2.3. By Technology

            16.13.2.4. By Distribution Channel

            16.13.2.5. By End User

    16.14. Thailand

        16.14.1. Pricing Analysis

        16.14.2. Market Share Analysis, 2022

            16.14.2.1. By Nature

            16.14.2.2. By Micronutrients

            16.14.2.3. By Technology

            16.14.2.4. By Distribution Channel

            16.14.2.5. By End User

    16.15. Indonesia

        16.15.1. Pricing Analysis

        16.15.2. Market Share Analysis, 2022

            16.15.2.1. By Nature

            16.15.2.2. By Micronutrients

            16.15.2.3. By Technology

            16.15.2.4. By Distribution Channel

            16.15.2.5. By End User

    16.16. Australia

        16.16.1. Pricing Analysis

        16.16.2. Market Share Analysis, 2022

            16.16.2.1. By Nature

            16.16.2.2. By Micronutrients

            16.16.2.3. By Technology

            16.16.2.4. By Distribution Channel

            16.16.2.5. By End User

    16.17. New Zealand

        16.17.1. Pricing Analysis

        16.17.2. Market Share Analysis, 2022

            16.17.2.1. By Nature

            16.17.2.2. By Micronutrients

            16.17.2.3. By Technology

            16.17.2.4. By Distribution Channel

            16.17.2.5. By End User

    16.18. GCC Countries

        16.18.1. Pricing Analysis

        16.18.2. Market Share Analysis, 2022

            16.18.2.1. By Nature

            16.18.2.2. By Micronutrients

            16.18.2.3. By Technology

            16.18.2.4. By Distribution Channel

            16.18.2.5. By End User

    16.19. South Africa

        16.19.1. Pricing Analysis

        16.19.2. Market Share Analysis, 2022

            16.19.2.1. By Nature

            16.19.2.2. By Micronutrients

            16.19.2.3. By Technology

            16.19.2.4. By Distribution Channel

            16.19.2.5. By End User

    16.20. Israel

        16.20.1. Pricing Analysis

        16.20.2. Market Share Analysis, 2022

            16.20.2.1. By Nature

            16.20.2.2. By Micronutrients

            16.20.2.3. By Technology

            16.20.2.4. By Distribution Channel

            16.20.2.5. By End User

17. Market Structure Analysis

    17.1. Competition Dashboard

    17.2. Competition Benchmarking

    17.3. Market Share Analysis of Top Players

        17.3.1. By Regional

        17.3.2. By Nature

        17.3.3. By Micronutrients

        17.3.4. By Technology

        17.3.5. By Distribution Channel

        17.3.6. By End User

18. Competition Analysis

    18.1. Competition Deep Dive

        18.1.1. Cargill Incorporated

            18.1.1.1. Overview

            18.1.1.2. Product Portfolio

            18.1.1.3. Profitability by Market Segments

            18.1.1.4. Sales Footprint

            18.1.1.5. Strategy Overview

                18.1.1.5.1. Marketing Strategy

                18.1.1.5.2. Product Strategy

                18.1.1.5.3. Channel Strategy

        18.1.2. BASF SE

            18.1.2.1. Overview

            18.1.2.2. Product Portfolio

            18.1.2.3. Profitability by Market Segments

            18.1.2.4. Sales Footprint

            18.1.2.5. Strategy Overview

                18.1.2.5.1. Marketing Strategy

                18.1.2.5.2. Product Strategy

                18.1.2.5.3. Channel Strategy

        18.1.3. General Mills Inc

            18.1.3.1. Overview

            18.1.3.2. Product Portfolio

            18.1.3.3. Profitability by Market Segments

            18.1.3.4. Sales Footprint

            18.1.3.5. Strategy Overview

                18.1.3.5.1. Marketing Strategy

                18.1.3.5.2. Product Strategy

                18.1.3.5.3. Channel Strategy

        18.1.4. Wilmar International Ltd

            18.1.4.1. Overview

            18.1.4.2. Product Portfolio

            18.1.4.3. Profitability by Market Segments

            18.1.4.4. Sales Footprint

            18.1.4.5. Strategy Overview

                18.1.4.5.1. Marketing Strategy

                18.1.4.5.2. Product Strategy

                18.1.4.5.3. Channel Strategy

        18.1.5. Aroma Fields

            18.1.5.1. Overview

            18.1.5.2. Product Portfolio

            18.1.5.3. Profitability by Market Segments

            18.1.5.4. Sales Footprint

            18.1.5.5. Strategy Overview

                18.1.5.5.1. Marketing Strategy

                18.1.5.5.2. Product Strategy

                18.1.5.5.3. Channel Strategy

        18.1.6. KRBL Ltd

            18.1.6.1. Overview

            18.1.6.2. Product Portfolio

            18.1.6.3. Profitability by Market Segments

            18.1.6.4. Sales Footprint

            18.1.6.5. Strategy Overview

                18.1.6.5.1. Marketing Strategy

                18.1.6.5.2. Product Strategy

                18.1.6.5.3. Channel Strategy

        18.1.7. Bunge Ltd

            18.1.7.1. Overview

            18.1.7.2. Product Portfolio

            18.1.7.3. Profitability by Market Segments

            18.1.7.4. Sales Footprint

            18.1.7.5. Strategy Overview

                18.1.7.5.1. Marketing Strategy

                18.1.7.5.2. Product Strategy

                18.1.7.5.3. Channel Strategy

        18.1.8. REI Agro Ltd

            18.1.8.1. Overview

            18.1.8.2. Product Portfolio

            18.1.8.3. Profitability by Market Segments

            18.1.8.4. Sales Footprint

            18.1.8.5. Strategy Overview

                18.1.8.5.1. Marketing Strategy

                18.1.8.5.2. Product Strategy

                18.1.8.5.3. Channel Strategy

        18.1.9. LT Foods

            18.1.9.1. Overview

            18.1.9.2. Product Portfolio

            18.1.9.3. Profitability by Market Segments

            18.1.9.4. Sales Footprint

            18.1.9.5. Strategy Overview

                18.1.9.5.1. Marketing Strategy

                18.1.9.5.2. Product Strategy

                18.1.9.5.3. Channel Strategy

        18.1.10. Hain Celestial

            18.1.10.1. Overview

            18.1.10.2. Product Portfolio

            18.1.10.3. Profitability by Market Segments

            18.1.10.4. Sales Footprint

            18.1.10.5. Strategy Overview

                18.1.10.5.1. Marketing Strategy

                18.1.10.5.2. Product Strategy

                18.1.10.5.3. Channel Strategy

19. Assumptions & Acronyms Used

20. Research Methodology

List of Tables

Table 1: Global Market Value (US$ Million) Forecast by Region, 2018 to 2033

Table 2: Global Market Volume (Tons) Forecast by Region, 2018 to 2033

Table 3: Global Market Value (US$ Million) Forecast by Nature, 2018 to 2033

Table 4: Global Market Volume (Tons) Forecast by Nature, 2018 to 2033

Table 5: Global Market Value (US$ Million) Forecast by Micronutrients, 2018 to 2033

Table 6: Global Market Volume (Tons) Forecast by Micronutrients, 2018 to 2033

Table 7: Global Market Value (US$ Million) Forecast by Technology, 2018 to 2033

Table 8: Global Market Volume (Tons) Forecast by Technology, 2018 to 2033

Table 9: Global Market Value (US$ Million) Forecast by Distribution Channel, 2018 to 2033

Table 10: Global Market Volume (Tons) Forecast by Distribution Channel, 2018 to 2033

Table 11: Global Market Value (US$ Million) Forecast by End User, 2018 to 2033

Table 12: Global Market Volume (Tons) Forecast by End User, 2018 to 2033

Table 13: North America Market Value (US$ Million) Forecast by Country, 2018 to 2033

Table 14: North America Market Volume (Tons) Forecast by Country, 2018 to 2033

Table 15: North America Market Value (US$ Million) Forecast by Nature, 2018 to 2033

Table 16: North America Market Volume (Tons) Forecast by Nature, 2018 to 2033

Table 17: North America Market Value (US$ Million) Forecast by Micronutrients, 2018 to 2033

Table 18: North America Market Volume (Tons) Forecast by Micronutrients, 2018 to 2033

Table 19: North America Market Value (US$ Million) Forecast by Technology, 2018 to 2033

Table 20: North America Market Volume (Tons) Forecast by Technology, 2018 to 2033

Table 21: North America Market Value (US$ Million) Forecast by Distribution Channel, 2018 to 2033

Table 22: North America Market Volume (Tons) Forecast by Distribution Channel, 2018 to 2033

Table 23: North America Market Value (US$ Million) Forecast by End User, 2018 to 2033

Table 24: North America Market Volume (Tons) Forecast by End User, 2018 to 2033

Table 25: Latin America Market Value (US$ Million) Forecast by Country, 2018 to 2033

Table 26: Latin America Market Volume (Tons) Forecast by Country, 2018 to 2033

Table 27: Latin America Market Value (US$ Million) Forecast by Nature, 2018 to 2033

Table 28: Latin America Market Volume (Tons) Forecast by Nature, 2018 to 2033

Table 29: Latin America Market Value (US$ Million) Forecast by Micronutrients, 2018 to 2033

Table 30: Latin America Market Volume (Tons) Forecast by Micronutrients, 2018 to 2033

Table 31: Latin America Market Value (US$ Million) Forecast by Technology, 2018 to 2033

Table 32: Latin America Market Volume (Tons) Forecast by Technology, 2018 to 2033

Table 33: Latin America Market Value (US$ Million) Forecast by Distribution Channel, 2018 to 2033

Table 34: Latin America Market Volume (Tons) Forecast by Distribution Channel, 2018 to 2033

Table 35: Latin America Market Value (US$ Million) Forecast by End User, 2018 to 2033

Table 36: Latin America Market Volume (Tons) Forecast by End User, 2018 to 2033

Table 37: Europe Market Value (US$ Million) Forecast by Country, 2018 to 2033

Table 38: Europe Market Volume (Tons) Forecast by Country, 2018 to 2033

Table 39: Europe Market Value (US$ Million) Forecast by Nature, 2018 to 2033

Table 40: Europe Market Volume (Tons) Forecast by Nature, 2018 to 2033

Table 41: Europe Market Value (US$ Million) Forecast by Micronutrients, 2018 to 2033

Table 42: Europe Market Volume (Tons) Forecast by Micronutrients, 2018 to 2033

Table 43: Europe Market Value (US$ Million) Forecast by Technology, 2018 to 2033

Table 44: Europe Market Volume (Tons) Forecast by Technology, 2018 to 2033

Table 45: Europe Market Value (US$ Million) Forecast by Distribution Channel, 2018 to 2033

Table 46: Europe Market Volume (Tons) Forecast by Distribution Channel, 2018 to 2033

Table 47: Europe Market Value (US$ Million) Forecast by End User, 2018 to 2033

Table 48: Europe Market Volume (Tons) Forecast by End User, 2018 to 2033

Table 49: Asia Pacific Market Value (US$ Million) Forecast by Country, 2018 to 2033

Table 50: Asia Pacific Market Volume (Tons) Forecast by Country, 2018 to 2033

Table 51: Asia Pacific Market Value (US$ Million) Forecast by Nature, 2018 to 2033

Table 52: Asia Pacific Market Volume (Tons) Forecast by Nature, 2018 to 2033

Table 53: Asia Pacific Market Value (US$ Million) Forecast by Micronutrients, 2018 to 2033

Table 54: Asia Pacific Market Volume (Tons) Forecast by Micronutrients, 2018 to 2033

Table 55: Asia Pacific Market Value (US$ Million) Forecast by Technology, 2018 to 2033

Table 56: Asia Pacific Market Volume (Tons) Forecast by Technology, 2018 to 2033

Table 57: Asia Pacific Market Value (US$ Million) Forecast by Distribution Channel, 2018 to 2033

Table 58: Asia Pacific Market Volume (Tons) Forecast by Distribution Channel, 2018 to 2033

Table 59: Asia Pacific Market Value (US$ Million) Forecast by End User, 2018 to 2033

Table 60: Asia Pacific Market Volume (Tons) Forecast by End User, 2018 to 2033

Table 61: MEA Market Value (US$ Million) Forecast by Country, 2018 to 2033

Table 62: MEA Market Volume (Tons) Forecast by Country, 2018 to 2033

Table 63: MEA Market Value (US$ Million) Forecast by Nature, 2018 to 2033

Table 64: MEA Market Volume (Tons) Forecast by Nature, 2018 to 2033

Table 65: MEA Market Value (US$ Million) Forecast by Micronutrients, 2018 to 2033

Table 66: MEA Market Volume (Tons) Forecast by Micronutrients, 2018 to 2033

Table 67: MEA Market Value (US$ Million) Forecast by Technology, 2018 to 2033

Table 68: MEA Market Volume (Tons) Forecast by Technology, 2018 to 2033

Table 69: MEA Market Value (US$ Million) Forecast by Distribution Channel, 2018 to 2033

Table 70: MEA Market Volume (Tons) Forecast by Distribution Channel, 2018 to 2033

Table 71: MEA Market Value (US$ Million) Forecast by End User, 2018 to 2033

Table 72: MEA Market Volume (Tons) Forecast by End User, 2018 to 2033

List of Charts

Figure 1: Global Market Value (US$ Million) by Nature, 2023 to 2033

Figure 2: Global Market Value (US$ Million) by Micronutrients, 2023 to 2033

Figure 3: Global Market Value (US$ Million) by Technology, 2023 to 2033

Figure 4: Global Market Value (US$ Million) by Distribution Channel, 2023 to 2033

Figure 5: Global Market Value (US$ Million) by End User, 2023 to 2033

Figure 6: Global Market Value (US$ Million) by Region, 2023 to 2033

Figure 7: Global Market Value (US$ Million) Analysis by Region, 2018 to 2033

Figure 8: Global Market Volume (Tons) Analysis by Region, 2018 to 2033

Figure 9: Global Market Value Share (%) and BPS Analysis by Region, 2023 to 2033

Figure 10: Global Market Y-o-Y Growth (%) Projections by Region, 2023 to 2033

Figure 11: Global Market Value (US$ Million) Analysis by Nature, 2018 to 2033

Figure 12: Global Market Volume (Tons) Analysis by Nature, 2018 to 2033

Figure 13: Global Market Value Share (%) and BPS Analysis by Nature, 2023 to 2033

Figure 14: Global Market Y-o-Y Growth (%) Projections by Nature, 2023 to 2033

Figure 15: Global Market Value (US$ Million) Analysis by Micronutrients, 2018 to 2033

Figure 16: Global Market Volume (Tons) Analysis by Micronutrients, 2018 to 2033

Figure 17: Global Market Value Share (%) and BPS Analysis by Micronutrients, 2023 to 2033

Figure 18: Global Market Y-o-Y Growth (%) Projections by Micronutrients, 2023 to 2033

Figure 19: Global Market Value (US$ Million) Analysis by Technology, 2018 to 2033

Figure 20: Global Market Volume (Tons) Analysis by Technology, 2018 to 2033

Figure 21: Global Market Value Share (%) and BPS Analysis by Technology, 2023 to 2033

Figure 22: Global Market Y-o-Y Growth (%) Projections by Technology, 2023 to 2033

Figure 23: Global Market Value (US$ Million) Analysis by Distribution Channel, 2018 to 2033

Figure 24: Global Market Volume (Tons) Analysis by Distribution Channel, 2018 to 2033

Figure 25: Global Market Value Share (%) and BPS Analysis by Distribution Channel, 2023 to 2033

Figure 26: Global Market Y-o-Y Growth (%) Projections by Distribution Channel, 2023 to 2033

Figure 27: Global Market Value (US$ Million) Analysis by End User, 2018 to 2033

Figure 28: Global Market Volume (Tons) Analysis by End User, 2018 to 2033

Figure 29: Global Market Value Share (%) and BPS Analysis by End User, 2023 to 2033

Figure 30: Global Market Y-o-Y Growth (%) Projections by End User, 2023 to 2033

Figure 31: Global Market Attractiveness by Nature, 2023 to 2033

Figure 32: Global Market Attractiveness by Micronutrients, 2023 to 2033

Figure 33: Global Market Attractiveness by Technology, 2023 to 2033

Figure 34: Global Market Attractiveness by Distribution Channel, 2023 to 2033

Figure 35: Global Market Attractiveness by End User, 2023 to 2033

Figure 36: Global Market Attractiveness by Region, 2023 to 2033

Figure 37: North America Market Value (US$ Million) by Nature, 2023 to 2033

Figure 38: North America Market Value (US$ Million) by Micronutrients, 2023 to 2033

Figure 39: North America Market Value (US$ Million) by Technology, 2023 to 2033

Figure 40: North America Market Value (US$ Million) by Distribution Channel, 2023 to 2033

Figure 41: North America Market Value (US$ Million) by End User, 2023 to 2033

Figure 42: North America Market Value (US$ Million) by Country, 2023 to 2033

Figure 43: North America Market Value (US$ Million) Analysis by Country, 2018 to 2033

Figure 44: North America Market Volume (Tons) Analysis by Country, 2018 to 2033

Figure 45: North America Market Value Share (%) and BPS Analysis by Country, 2023 to 2033

Figure 46: North America Market Y-o-Y Growth (%) Projections by Country, 2023 to 2033

Figure 47: North America Market Value (US$ Million) Analysis by Nature, 2018 to 2033

Figure 48: North America Market Volume (Tons) Analysis by Nature, 2018 to 2033

Figure 49: North America Market Value Share (%) and BPS Analysis by Nature, 2023 to 2033

Figure 50: North America Market Y-o-Y Growth (%) Projections by Nature, 2023 to 2033

Figure 51: North America Market Value (US$ Million) Analysis by Micronutrients, 2018 to 2033

Figure 52: North America Market Volume (Tons) Analysis by Micronutrients, 2018 to 2033

Figure 53: North America Market Value Share (%) and BPS Analysis by Micronutrients, 2023 to 2033

Figure 54: North America Market Y-o-Y Growth (%) Projections by Micronutrients, 2023 to 2033

Figure 55: North America Market Value (US$ Million) Analysis by Technology, 2018 to 2033

Figure 56: North America Market Volume (Tons) Analysis by Technology, 2018 to 2033

Figure 57: North America Market Value Share (%) and BPS Analysis by Technology, 2023 to 2033

Figure 58: North America Market Y-o-Y Growth (%) Projections by Technology, 2023 to 2033

Figure 59: North America Market Value (US$ Million) Analysis by Distribution Channel, 2018 to 2033

Figure 60: North America Market Volume (Tons) Analysis by Distribution Channel, 2018 to 2033

Figure 61: North America Market Value Share (%) and BPS Analysis by Distribution Channel, 2023 to 2033

Figure 62: North America Market Y-o-Y Growth (%) Projections by Distribution Channel, 2023 to 2033

Figure 63: North America Market Value (US$ Million) Analysis by End User, 2018 to 2033

Figure 64: North America Market Volume (Tons) Analysis by End User, 2018 to 2033

Figure 65: North America Market Value Share (%) and BPS Analysis by End User, 2023 to 2033

Figure 66: North America Market Y-o-Y Growth (%) Projections by End User, 2023 to 2033

Figure 67: North America Market Attractiveness by Nature, 2023 to 2033

Figure 68: North America Market Attractiveness by Micronutrients, 2023 to 2033

Figure 69: North America Market Attractiveness by Technology, 2023 to 2033

Figure 70: North America Market Attractiveness by Distribution Channel, 2023 to 2033

Figure 71: North America Market Attractiveness by End User, 2023 to 2033

Figure 72: North America Market Attractiveness by Country, 2023 to 2033

Figure 73: Latin America Market Value (US$ Million) by Nature, 2023 to 2033

Figure 74: Latin America Market Value (US$ Million) by Micronutrients, 2023 to 2033

Figure 75: Latin America Market Value (US$ Million) by Technology, 2023 to 2033

Figure 76: Latin America Market Value (US$ Million) by Distribution Channel, 2023 to 2033

Figure 77: Latin America Market Value (US$ Million) by End User, 2023 to 2033

Figure 78: Latin America Market Value (US$ Million) by Country, 2023 to 2033

Figure 79: Latin America Market Value (US$ Million) Analysis by Country, 2018 to 2033

Figure 80: Latin America Market Volume (Tons) Analysis by Country, 2018 to 2033

Figure 81: Latin America Market Value Share (%) and BPS Analysis by Country, 2023 to 2033

Figure 82: Latin America Market Y-o-Y Growth (%) Projections by Country, 2023 to 2033

Figure 83: Latin America Market Value (US$ Million) Analysis by Nature, 2018 to 2033

Figure 84: Latin America Market Volume (Tons) Analysis by Nature, 2018 to 2033

Figure 85: Latin America Market Value Share (%) and BPS Analysis by Nature, 2023 to 2033

Figure 86: Latin America Market Y-o-Y Growth (%) Projections by Nature, 2023 to 2033

Figure 87: Latin America Market Value (US$ Million) Analysis by Micronutrients, 2018 to 2033

Figure 88: Latin America Market Volume (Tons) Analysis by Micronutrients, 2018 to 2033

Figure 89: Latin America Market Value Share (%) and BPS Analysis by Micronutrients, 2023 to 2033

Figure 90: Latin America Market Y-o-Y Growth (%) Projections by Micronutrients, 2023 to 2033

Figure 91: Latin America Market Value (US$ Million) Analysis by Technology, 2018 to 2033

Figure 92: Latin America Market Volume (Tons) Analysis by Technology, 2018 to 2033

Figure 93: Latin America Market Value Share (%) and BPS Analysis by Technology, 2023 to 2033

Figure 94: Latin America Market Y-o-Y Growth (%) Projections by Technology, 2023 to 2033

Figure 95: Latin America Market Value (US$ Million) Analysis by Distribution Channel, 2018 to 2033

Figure 96: Latin America Market Volume (Tons) Analysis by Distribution Channel, 2018 to 2033

Figure 97: Latin America Market Value Share (%) and BPS Analysis by Distribution Channel, 2023 to 2033

Figure 98: Latin America Market Y-o-Y Growth (%) Projections by Distribution Channel, 2023 to 2033

Figure 99: Latin America Market Value (US$ Million) Analysis by End User, 2018 to 2033

Figure 100: Latin America Market Volume (Tons) Analysis by End User, 2018 to 2033

Figure 101: Latin America Market Value Share (%) and BPS Analysis by End User, 2023 to 2033

Figure 102: Latin America Market Y-o-Y Growth (%) Projections by End User, 2023 to 2033

Figure 103: Latin America Market Attractiveness by Nature, 2023 to 2033

Figure 104: Latin America Market Attractiveness by Micronutrients, 2023 to 2033

Figure 105: Latin America Market Attractiveness by Technology, 2023 to 2033

Figure 106: Latin America Market Attractiveness by Distribution Channel, 2023 to 2033

Figure 107: Latin America Market Attractiveness by End User, 2023 to 2033

Figure 108: Latin America Market Attractiveness by Country, 2023 to 2033

Figure 109: Europe Market Value (US$ Million) by Nature, 2023 to 2033

Figure 110: Europe Market Value (US$ Million) by Micronutrients, 2023 to 2033

Figure 111: Europe Market Value (US$ Million) by Technology, 2023 to 2033

Figure 112: Europe Market Value (US$ Million) by Distribution Channel, 2023 to 2033

Figure 113: Europe Market Value (US$ Million) by End User, 2023 to 2033

Figure 114: Europe Market Value (US$ Million) by Country, 2023 to 2033

Figure 115: Europe Market Value (US$ Million) Analysis by Country, 2018 to 2033

Figure 116: Europe Market Volume (Tons) Analysis by Country, 2018 to 2033

Figure 117: Europe Market Value Share (%) and BPS Analysis by Country, 2023 to 2033

Figure 118: Europe Market Y-o-Y Growth (%) Projections by Country, 2023 to 2033

Figure 119: Europe Market Value (US$ Million) Analysis by Nature, 2018 to 2033

Figure 120: Europe Market Volume (Tons) Analysis by Nature, 2018 to 2033

Figure 121: Europe Market Value Share (%) and BPS Analysis by Nature, 2023 to 2033

Figure 122: Europe Market Y-o-Y Growth (%) Projections by Nature, 2023 to 2033

Figure 123: Europe Market Value (US$ Million) Analysis by Micronutrients, 2018 to 2033

Figure 124: Europe Market Volume (Tons) Analysis by Micronutrients, 2018 to 2033

Figure 125: Europe Market Value Share (%) and BPS Analysis by Micronutrients, 2023 to 2033

Figure 126: Europe Market Y-o-Y Growth (%) Projections by Micronutrients, 2023 to 2033

Figure 127: Europe Market Value (US$ Million) Analysis by Technology, 2018 to 2033

Figure 128: Europe Market Volume (Tons) Analysis by Technology, 2018 to 2033

Figure 129: Europe Market Value Share (%) and BPS Analysis by Technology, 2023 to 2033

Figure 130: Europe Market Y-o-Y Growth (%) Projections by Technology, 2023 to 2033

Figure 131: Europe Market Value (US$ Million) Analysis by Distribution Channel, 2018 to 2033

Figure 132: Europe Market Volume (Tons) Analysis by Distribution Channel, 2018 to 2033

Figure 133: Europe Market Value Share (%) and BPS Analysis by Distribution Channel, 2023 to 2033

Figure 134: Europe Market Y-o-Y Growth (%) Projections by Distribution Channel, 2023 to 2033

Figure 135: Europe Market Value (US$ Million) Analysis by End User, 2018 to 2033

Figure 136: Europe Market Volume (Tons) Analysis by End User, 2018 to 2033

Figure 137: Europe Market Value Share (%) and BPS Analysis by End User, 2023 to 2033

Figure 138: Europe Market Y-o-Y Growth (%) Projections by End User, 2023 to 2033

Figure 139: Europe Market Attractiveness by Nature, 2023 to 2033

Figure 140: Europe Market Attractiveness by Micronutrients, 2023 to 2033

Figure 141: Europe Market Attractiveness by Technology, 2023 to 2033

Figure 142: Europe Market Attractiveness by Distribution Channel, 2023 to 2033

Figure 143: Europe Market Attractiveness by End User, 2023 to 2033

Figure 144: Europe Market Attractiveness by Country, 2023 to 2033

Figure 145: Asia Pacific Market Value (US$ Million) by Nature, 2023 to 2033

Figure 146: Asia Pacific Market Value (US$ Million) by Micronutrients, 2023 to 2033

Figure 147: Asia Pacific Market Value (US$ Million) by Technology, 2023 to 2033

Figure 148: Asia Pacific Market Value (US$ Million) by Distribution Channel, 2023 to 2033

Figure 149: Asia Pacific Market Value (US$ Million) by End User, 2023 to 2033

Figure 150: Asia Pacific Market Value (US$ Million) by Country, 2023 to 2033

Figure 151: Asia Pacific Market Value (US$ Million) Analysis by Country, 2018 to 2033

Figure 152: Asia Pacific Market Volume (Tons) Analysis by Country, 2018 to 2033

Figure 153: Asia Pacific Market Value Share (%) and BPS Analysis by Country, 2023 to 2033

Figure 154: Asia Pacific Market Y-o-Y Growth (%) Projections by Country, 2023 to 2033

Figure 155: Asia Pacific Market Value (US$ Million) Analysis by Nature, 2018 to 2033

Figure 156: Asia Pacific Market Volume (Tons) Analysis by Nature, 2018 to 2033

Figure 157: Asia Pacific Market Value Share (%) and BPS Analysis by Nature, 2023 to 2033

Figure 158: Asia Pacific Market Y-o-Y Growth (%) Projections by Nature, 2023 to 2033

Figure 159: Asia Pacific Market Value (US$ Million) Analysis by Micronutrients, 2018 to 2033

Figure 160: Asia Pacific Market Volume (Tons) Analysis by Micronutrients, 2018 to 2033

Figure 161: Asia Pacific Market Value Share (%) and BPS Analysis by Micronutrients, 2023 to 2033

Figure 162: Asia Pacific Market Y-o-Y Growth (%) Projections by Micronutrients, 2023 to 2033

Figure 163: Asia Pacific Market Value (US$ Million) Analysis by Technology, 2018 to 2033

Figure 164: Asia Pacific Market Volume (Tons) Analysis by Technology, 2018 to 2033

Figure 165: Asia Pacific Market Value Share (%) and BPS Analysis by Technology, 2023 to 2033

Figure 166: Asia Pacific Market Y-o-Y Growth (%) Projections by Technology, 2023 to 2033

Figure 167: Asia Pacific Market Value (US$ Million) Analysis by Distribution Channel, 2018 to 2033

Figure 168: Asia Pacific Market Volume (Tons) Analysis by Distribution Channel, 2018 to 2033

Figure 169: Asia Pacific Market Value Share (%) and BPS Analysis by Distribution Channel, 2023 to 2033

Figure 170: Asia Pacific Market Y-o-Y Growth (%) Projections by Distribution Channel, 2023 to 2033

Figure 171: Asia Pacific Market Value (US$ Million) Analysis by End User, 2018 to 2033

Figure 172: Asia Pacific Market Volume (Tons) Analysis by End User, 2018 to 2033

Figure 173: Asia Pacific Market Value Share (%) and BPS Analysis by End User, 2023 to 2033

Figure 174: Asia Pacific Market Y-o-Y Growth (%) Projections by End User, 2023 to 2033

Figure 175: Asia Pacific Market Attractiveness by Nature, 2023 to 2033

Figure 176: Asia Pacific Market Attractiveness by Micronutrients, 2023 to 2033

Figure 177: Asia Pacific Market Attractiveness by Technology, 2023 to 2033

Figure 178: Asia Pacific Market Attractiveness by Distribution Channel, 2023 to 2033

Figure 179: Asia Pacific Market Attractiveness by End User, 2023 to 2033

Figure 180: Asia Pacific Market Attractiveness by Country, 2023 to 2033

Figure 181: MEA Market Value (US$ Million) by Nature, 2023 to 2033

Figure 182: MEA Market Value (US$ Million) by Micronutrients, 2023 to 2033

Figure 183: MEA Market Value (US$ Million) by Technology, 2023 to 2033

Figure 184: MEA Market Value (US$ Million) by Distribution Channel, 2023 to 2033

Figure 185: MEA Market Value (US$ Million) by End User, 2023 to 2033

Figure 186: MEA Market Value (US$ Million) by Country, 2023 to 2033

Figure 187: MEA Market Value (US$ Million) Analysis by Country, 2018 to 2033

Figure 188: MEA Market Volume (Tons) Analysis by Country, 2018 to 2033

Figure 189: MEA Market Value Share (%) and BPS Analysis by Country, 2023 to 2033

Figure 190: MEA Market Y-o-Y Growth (%) Projections by Country, 2023 to 2033

Figure 191: MEA Market Value (US$ Million) Analysis by Nature, 2018 to 2033

Figure 192: MEA Market Volume (Tons) Analysis by Nature, 2018 to 2033

Figure 193: MEA Market Value Share (%) and BPS Analysis by Nature, 2023 to 2033

Figure 194: MEA Market Y-o-Y Growth (%) Projections by Nature, 2023 to 2033

Figure 195: MEA Market Value (US$ Million) Analysis by Micronutrients, 2018 to 2033

Figure 196: MEA Market Volume (Tons) Analysis by Micronutrients, 2018 to 2033

Figure 197: MEA Market Value Share (%) and BPS Analysis by Micronutrients, 2023 to 2033

Figure 198: MEA Market Y-o-Y Growth (%) Projections by Micronutrients, 2023 to 2033

Figure 199: MEA Market Value (US$ Million) Analysis by Technology, 2018 to 2033

Figure 200: MEA Market Volume (Tons) Analysis by Technology, 2018 to 2033

Figure 201: MEA Market Value Share (%) and BPS Analysis by Technology, 2023 to 2033

Figure 202: MEA Market Y-o-Y Growth (%) Projections by Technology, 2023 to 2033

Figure 203: MEA Market Value (US$ Million) Analysis by Distribution Channel, 2018 to 2033

Figure 204: MEA Market Volume (Tons) Analysis by Distribution Channel, 2018 to 2033

Figure 205: MEA Market Value Share (%) and BPS Analysis by Distribution Channel, 2023 to 2033

Figure 206: MEA Market Y-o-Y Growth (%) Projections by Distribution Channel, 2023 to 2033

Figure 207: MEA Market Value (US$ Million) Analysis by End User, 2018 to 2033

Figure 208: MEA Market Volume (Tons) Analysis by End User, 2018 to 2033

Figure 209: MEA Market Value Share (%) and BPS Analysis by End User, 2023 to 2033

Figure 210: MEA Market Y-o-Y Growth (%) Projections by End User, 2023 to 2033

Figure 211: MEA Market Attractiveness by Nature, 2023 to 2033

Figure 212: MEA Market Attractiveness by Micronutrients, 2023 to 2033

Figure 213: MEA Market Attractiveness by Technology, 2023 to 2033

Figure 214: MEA Market Attractiveness by Distribution Channel, 2023 to 2033

Figure 215: MEA Market Attractiveness by End User, 2023 to 2033

Figure 216: MEA Market Attractiveness by Country, 2023 to 2033

Recommendations

Food and Beverage

Rice Cake Market

Published : March 2024

Explore Food and Beverage Insights

View Reports