This site uses cookies, including third-party cookies, that help us to provide and improve our services.

Privacy Policy
- Global Locations -
Headquarters
Future Market Insights, Inc.
Christiana Corporate, 200 Continental Drive, Suite 401, Newark, Delaware - 19713, United States
T: +1-845-579-5705
MEA
Market Access DMCC

1602-6 Jumeirah Bay X2 Tower, Plot No: JLT-PH2-X2A,

Jumeirah Lakes Towers, Dubai,

United Arab Emirates

Americas
Future Market Insights
616 Corporate Way, Suite 2-9018,
Valley Cottage, NY 10989,
United States
T: +1-347-918-3531
Europe
Future Market Insights
3rd Floor, 207 Regent Street,
London W1B 3HH
United Kingdom
T: + 44 (0) 20 8123 9659
D: +44 (0) 20 3287 4268
APAC
Future Market Insights
Office No. 401-A, 4th Floor,
VANTAGE 9, S.No. 36/1/1,
Baner, Pune 411045 India

Rice Cakes Market

Market Insights on Rice Cakes covering sales outlook, demand forecast & up-to-date key trends

Rice Cakes Market by Type, Flavour, Packaging, Distribution Channel & Region | Forecast 2022 to 2032

Rice Cakes Market Outlook (2022 to 2032)

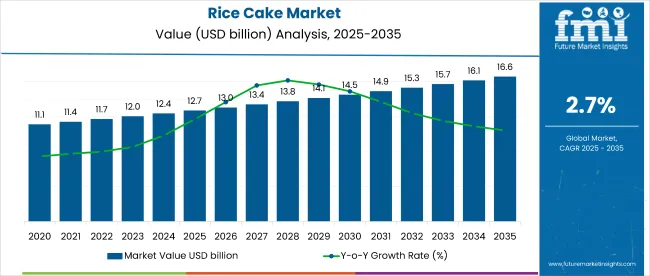
The global rice cakes market is expected to record a CAGR of 4.2% during the forecast period 2022-2032, up from US$ 521.3 Million in 2022 to reach a valuation of US$ 786.6 Million by 2032.

Attributes

Details

Rice Cakes Market Size (2022)

US$ 521.3 Million

Rice Cakes Market Size (2032)

US$ 786.6 Million

Rice Cakes Market CAGR

4.2%

Corn rice cakes are growing in popularity as healthy snacks amongst children owing to their chewy texture and sweet and nutty flavor, which is expected to drive the sales of rice cakes. In addition to this, consumers who are sensitive to salicylates, are likely to contribute to the adoption of rice cakes especially those made of buckwheat, to obtain fagopyrin which is naturally present in the grain.

The versatile nature of rice cakes assists consumers to create different recipes using the product as an ingredient or base, therefore surging the demand for rice cakes. Manufacturers have shifted their focus to choosing certified and good quality ingredients, as per consumer demands, which is expected to promote the rice cakes market trends.

The rice cakes market share is likely to propel, owing to the product being a good source of dietary fiber, protein, vitamins, and minerals which maintains a healthy lifestyle.

Don't pay for what you don't need

Customize your report by selecting specific countries or regions and save 30%!

What are the Key Factors Driving Rice Cakes Market?

The rise in consumption of snacks between meals, and avoiding unhealthy snacks that disrupt a balanced diet, is anticipated to drive the sales of rice cakes. Additionally, consumers with the celiac disease across the globe encourages the deployment of gluten-free snacks to prevent allergic reactions, which is likely to escalate the demand for rice cakes

Demand for light, low-calorie snacks amongst health-conscious consumers as an alternative to junk foods, catering to their healthy lifestyle, is anticipated to surge the adoption of rice cakes.

Demand for rice cake is rising as consumers leading a busy lifestyle require ready-to-eat healthy snacks between meals. Furthermore, the fiber content in rice, is likely to increase the demand for rice cakes, as it aids in the improvement of digestion and immunity for consumers with a lower metabolism.

Diabetes and high blood pressure amongst consumers increase demand for snacks with low sodium/salt content, therefore broadening the global rice cakes market share. Likewise, the consumer shift towards a healthy lifestyle and their requirement to consume all-natural and low-calorie food products is expected to increase the sales of rice cakes.

The growing inclination towards a vegan diet and seeking sustainable, regenerative, plant-based, and immunity-boosting food and beverages is expected to raise the demand for rice cakes. In addition to that, the abundance of nutrients such as phytochemicals, carbohydrates, magnesium, iron, zinc, etc. essential for boosting immunity is anticipated to increase the adoption of rice cakes.

An increase in awareness amongst consumers on the health benefits of rice as well as the growing disposable income amongst the middle-class population is likely to propel the rice cakes market growth.

Gym enthusiasts demanding palatable snacks to maintain their body mass index (BMI), as opposed to unhealthy packaged snacks with high amounts of sodium and trans fats, surge the demand for rice cakes.

What are the Factors Restraining the Rice Cakes Market?

The availability of healthier alternative snacks in the market to fit the growing trend of eating healthy and opting for healthy snacks is expected to curb the sales of rice cakes. Likewise, despite being a low-calorie snack, the carbohydrate content in rice cakes containing a high glycaemic index restrains weight loss plans, therefore impeding the demand for rice cakes.

The adoption of rice cakes amongst babies and toddlers can be harmful due to the trace amounts of arsenic in the product, which is likely to hinder the rice cakes market growth. Moreover, the consumption of rice cakes provides excessive energy which surges weight gain without its use in physical activities, which is predicted to hamper the rice cakes market share.

The high glycaemic index further causes issues in adults as well, such as high blood sugar levels, diabetes, and sometimes chronic illnesses such as cancer and cardiovascular diseases, which are expected to obstruct the sales of rice cakes.

Nandini Roy Choudhury
Principal Consultant
LinkedIn
Talk to Analyst

Find your sweet spots for generating winning opportunities in this market.

Talk to Analyst

What are the Growth Opportunities in the Rice Cakes Market?

Manufacturers of rice cakes highlight the key selling points of the product for the purpose of commercials or advertisements, which is likely to drive the sales of rice cakes. By the same token, attractive product packaging, that is compact and biodegradable for consumers who are always on the run, is anticipated to push consumers toward the adoption of rice cakes.

Manufacturers offering a diverse product portfolio to cater to consumers having varied tastes across is expected to further propel the rice cakes market share. Furthermore, the rising demand and consumption of rice products amongst millennials, inspiring them to spend on healthy and organic snacks further expands the rice cakes market size.

Brands showcasing their range of rice products of different flavors, textures, and forms in both retail and e-commerce platforms, are anticipated to promote the rice cakes market growth.

Celebrity endorsements on the variety of rice-based snacks available in the market, declaring the benefits of the product, and using different sales promotion strategies, boost the global rice cakes market size.

Regional Insights into the Rice Cakes Market

What is the Growth Outlook for Asia-Pacific Rice Cakes Market?

The Asia-Pacific is the largest rice cakes market share with a revenue of 41%. This region holds the highest number of rice consumers in the world, propelling the global rice cakes market share.

Increasing urbanization and fast pace lifestyles in this region, giving rise to the snack industry expands the global rice cakes market size. Additionally, the high production of rice in China and India contributes to the rice cakes market growth.

Technological advancement and changes in consumer preference towards healthy snacks surge the demand for rice cakes, in this region.

Rice cakes are traditional snacks in countries in the Asia-Pacific, including Japan, China, India, Vietnam, Korea, Malaysia, etc.

How is the Performance of the North America Rice Cakes Market?

North America is witnessing significant growth in the rice cakes market share with a revenue of 27.3%.

The culinary sector in this region experimenting with innovations and varieties of rice cakes using recipes escalates the demand for rice cakes. Likewise, the growing prevalence of Asian food and culture in the west, propels the rice cake market share, of this region.

What is the Growth Outlook for the Europe Rice Cakes Market?

Europe is a growing rice cake market share with a revenue of 23.5% This is owing to the growing prevalence of Asian food and culture in this region, which promotes the rice cake market growth.

Increasing consumer awareness about the benefits of organic and non-GMO snacks surges the demand for rice cakes. Furthermore, the trend of healthy snacking in this region, along with the presence of several key players in the UK, boosts the rice cake market size.

Get the data you need at a Fraction of the cost

Personalize your report by choosing insights you need
and save 40%!

How is the Start-up Ecosystem in the Rice Cakes Market?

The evolution of rice cakes began in Southeast Asia, and are made from rice grains such as bran, germ, and endosperm. The versatility of rice and its products, make it a staple food item in various countries in the Asia-Pacific region.

Owing to this feature, rice cakes are now available in different flavours. Sweet flavours such as chocolate, apple cinnamon, and caramel, as well as savoury flavours such as egg, chicken, etc. Various start-up companies are incorporating trendy eating habits of consumers such as organic and healthy food items, as well as keeping the traditional recipe secure.

Ambrosia Organic, Joy Snacks, Katjang, etc. are a few of the many start-up consumers in the rice cakes market share that has implemented several strategies such as rice cakes that meet most of the nutritional demands, rice-based snacks catered to fitness enthusiasts, spreading the culture of risotto and rice through their line of products, etc. to promote the rice cakes market growth.

Competitive Landscape of the Rice Cakes Market

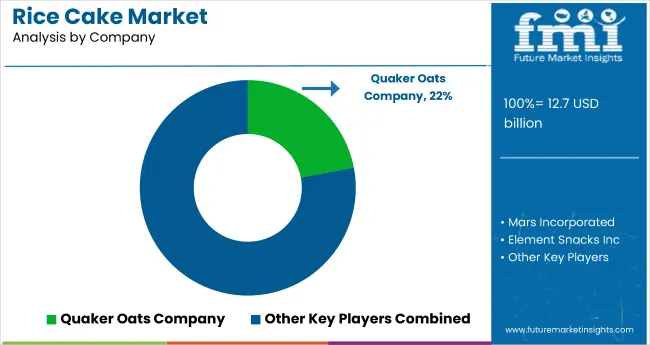
Some of the key market participants in the rice cakes market are Quaker Oats Company, Mars Incorporated, Element Snacks Inc., Lundberg, Tastemorr Snacks, RACIO, s.r.o., Umeya, Riso Gallo, Wangwang, General Mills Inc., Kellogg Co., Ricegrowers Ltd., PepsiCo Inc., Blue Diamond Growers, Topco Associates LLC, KAMEDA SEIKA CO. LTD., Das Foodtech Pvt. Ltd., Nishimoto Co. Ltd., Ottogi Co. Ltd., SanoRice Holding BV, Vital Health Foods, Wise Crack, Ketofy, Ambrosia Organic, Joy Snacks, Katjang, etc.

Healthy snacking becomes popular, and a priority amongst the population. Key players are using this demand to manufacture snacks that are not only healthy but palatable as well. The sales of rice cakes have hence risen, as it caters to major consumer demands through one product.

Some of the recent developments in the rice cakes are

  • In 2020, Kellogg Company introduced a new rice snack named Rice Krispies Treats HOMESTYLE with marshmallows, in original and chocolate flavor.
  • In May 2022, SanoRice Group announced a EU€30 30 Million investment to meet fast growing worldwide demand for popped rice, corn, and multi-grain cakes.
  • In 2016, RACIO won the DLG award for the long-term quality of rice products for the 4th year in a row.
  • In August 2016, Mars Chocolate Drinks & Treats launched new ‘Galaxy Rice Cakes’ in an attempt to tap into a sector currently worth £67 Million.

Report Scope

Report Attribute

Details

Growth Rate

CAGR of 4.2% from 2022 to 2032

The base year for estimation

2021

Historical data

2015 to 2020

Forecast period

2022 to 2032

Quantitative units

Revenue in USD million and CAGR from 2022 to 2032

Report Coverage

Revenue forecast, volume forecast, company ranking, competitive landscape, growth factors, and trends, Pricing Analysis

Segments Covered

Types, Flavour, Packaging, Application, and Region

Regional scope

North America; Western Europe, Eastern Europe, Middle East, Africa, ASEAN, South Asia, Rest of Asia, Australia, and New Zealand

Country scope

United States of America; Canada; Mexico; Germany; United Kingdom; France; Italy; Spain; Russia; Belgium; Poland; Czech Republic; China; India; Japan; Australia; Brazil; Argentina; Colombia; Saudi Arabia; UAE; Iran; South Africa

Key companies profiled

Quaker Oats Company, Mars Incorporated, Element Snacks Inc., Lundberg, Tastemorr Snacks, RACIO, s.r.o., Umeya, Riso Gallo, Wangwang, General Mills Inc., Kellogg Co., Ricegrowers Ltd., PepsiCo Inc., Blue Diamond Growers, Topco Associates LLC, KAMEDA SEIKA CO. LTD., Das Foodtech Pvt. Ltd., Nishimoto Co. Ltd., Ottogi Co. Ltd., SanoRice Holding BV, Vital Health Foods, Wise Crack, Ketofy, Ambrosia Organic, Joy Snacks, Katjang, etc.

Customization scope

Free report customization (equivalent to up to 8 analysts' working days) with purchase. Addition or alteration to country, regional & segment scope.

Pricing and purchase options

Avail customized purchase options to meet your exact research needs.

Key Segments Profiled in the Rice Cakes Market Survey

By Type:

  • Mochi
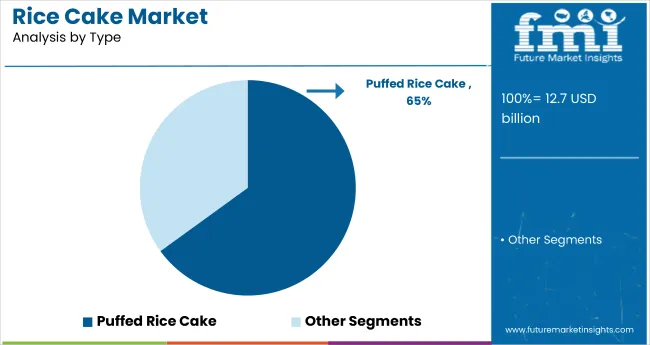
  • Puffed Rice Cakes

By Flavour:

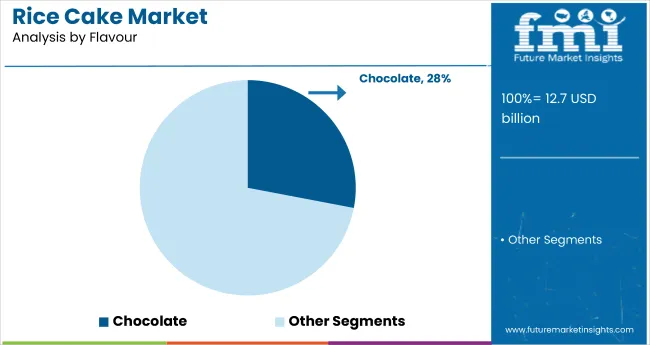
  • Chocolate
  • Apple Cinnamon
  • Caramel
  • Chicken

By Packaging:

  • Pillow Pouches
  • Stick Packs
  • Snack-Sized

By Distribution Channel:

  • Specialty Stores
  • Convenience Stores
  • Retail
  • E-Commerce

By Region:

  • North America
  • Latin America
  • Western Europe
  • Eastern Europe
  • The Asia-Pacific
  • Japan
  • The Middle East and Africa

Frequently Asked Questions

The rice cakes market is likely to garner a CAGR of 4.2%, during the forecast period.

The Asia-Pacific is the leading rice cakes market.

By 2032, the rice cakes market is likely to grow to a revenue of US$ 786.6 Million.

Table of Content

1. Executive Summary | Rice Cakes Market

    1.1. Global Market Outlook

    1.2. Demand-side Trends

    1.3. Supply-side Trends

    1.4. Technology Roadmap Analysis

    1.5. Analysis and Recommendations

2. Market Overview

    2.1. Market Coverage / Taxonomy

    2.2. Market Definition / Scope / Limitations

3. Market Background

    3.1. Market Dynamics

        3.1.1. Drivers

        3.1.2. Restraints

        3.1.3. Opportunity

        3.1.4. Trends

    3.2. Scenario Forecast

        3.2.1. Demand in Optimistic Scenario

        3.2.2. Demand in Likely Scenario

        3.2.3. Demand in Conservative Scenario

    3.3. Opportunity Map Analysis

    3.4. Product Life Cycle Analysis

    3.5. Supply Chain Analysis

        3.5.1. Supply Side Participants and their Roles

            3.5.1.1. Producers

            3.5.1.2. Mid-Level Participants (Traders/ Agents/ Brokers)

            3.5.1.3. Wholesalers and Distributors

        3.5.2. Value Added and Value Created at Node in the Supply Chain

        3.5.3. List of Raw Material Suppliers

        3.5.4. List of Existing and Potential Buyers

    3.6. Investment Feasibility Matrix

    3.7. Value Chain Analysis

        3.7.1. Profit Margin Analysis

        3.7.2. Wholesalers and Distributors

        3.7.3. Retailers

    3.8. PESTLE and Porter’s Analysis

    3.9. Regulatory Landscape

        3.9.1. By Key Regions

        3.9.2. By Key Countries

    3.10. Regional Parent Market Outlook

    3.11. Production and Consumption Statistics

    3.12. Import and Export Statistics

4. Global Market Analysis 2017 to 2021 and Forecast, 2022 to 2032

    4.1. Historical Market Size Value (US$ Million) & Volume (Tons) Analysis, 2017 to 2021

    4.2. Current and Future Market Size Value (US$ Million) & Volume (Tons) Projections, 2022 to 2032

        4.2.1. Y-o-Y Growth Trend Analysis

        4.2.2. Absolute $ Opportunity Analysis

5. Global Market Analysis 2017 to 2021 and Forecast 2022 to 2032, By Product Type

    5.1. Introduction / Key Findings

    5.2. Historical Market Size Value (US$ Million) & Volume (Tons) Analysis By Product Type, 2017 to 2021

    5.3. Current and Future Market Size Value (US$ Million) & Volume (Tons) Analysis and Forecast By Product Type, 2022 to 2032

        5.3.1. Mochi

        5.3.2. Puffed Rice Cakes

        5.3.3. Others

    5.4. Y-o-Y Growth Trend Analysis By Product Type, 2017 to 2021

    5.5. Absolute $ Opportunity Analysis By Product Type, 2022 to 2032

6. Global Market Analysis 2017 to 2021 and Forecast 2022 to 2032, By Flavor Type

    6.1. Introduction / Key Findings

    6.2. Historical Market Size Value (US$ Million) & Volume (Tons) Analysis By Flavor Type, 2017 to 2021

    6.3. Current and Future Market Size Value (US$ Million) & Volume (Tons) Analysis and Forecast By Flavor Type, 2022 to 2032

        6.3.1. Chocolate

        6.3.2. Apple Cinnamon

        6.3.3. Chicken

        6.3.4. Caramel

        6.3.5. Others

    6.4. Y-o-Y Growth Trend Analysis By Flavor Type, 2017 to 2021

    6.5. Absolute $ Opportunity Analysis By Flavor Type, 2022 to 2032

7. Global Market Analysis 2017 to 2021 and Forecast 2022 to 2032, By Raw Material

    7.1. Introduction / Key Findings

    7.2. Historical Market Size Value (US$ Million) & Volume (Tons) Analysis By Raw Material, 2017 to 2021

    7.3. Current and Future Market Size Value (US$ Million) & Volume (Tons) Analysis and Forecast By Raw Material, 2022 to 2032

        7.3.1. White Rice

        7.3.2. Brown Rice

    7.4. Y-o-Y Growth Trend Analysis By Raw Material, 2017 to 2021

    7.5. Absolute $ Opportunity Analysis By Raw Material, 2022 to 2032

8. Global Market Analysis 2017 to 2021 and Forecast 2022 to 2032, By Distribution Channel

    8.1. Introduction / Key Findings

    8.2. Historical Market Size Value (US$ Million) & Volume (Tons) Analysis By Distribution Channel, 2017 to 2021

    8.3. Current and Future Market Size Value (US$ Million) & Volume (Tons) Analysis and Forecast By Distribution Channel, 2022 to 2032

        8.3.1. Modern Trade

        8.3.2. Specialty Stores

        8.3.3. Convenience Store

        8.3.4. Online Stores

        8.3.5. Other Retail Stores

    8.4. Y-o-Y Growth Trend Analysis By Distribution Channel, 2017 to 2021

    8.5. Absolute $ Opportunity Analysis By Distribution Channel, 2022 to 2032

9. Global Market Analysis 2017 to 2021 and Forecast 2022 to 2032, By Packaging Type

    9.1. Introduction / Key Findings

    9.2. Historical Market Size Value (US$ Million) & Volume (Tons) Analysis By Packaging Type, 2017 to 2021

    9.3. Current and Future Market Size Value (US$ Million) & Volume (Tons) Analysis and Forecast By Packaging Type, 2022 to 2032

        9.3.1. Pillow Pouches

        9.3.2. Stick Packs

        9.3.3. Snack-sized Portion Bags

        9.3.4. Others

    9.4. Y-o-Y Growth Trend Analysis By Packaging Type, 2017 to 2021

    9.5. Absolute $ Opportunity Analysis By Packaging Type, 2022 to 2032

10. Global Market Analysis 2017 to 2021 and Forecast 2022 to 2032, By Region

    10.1. Introduction

    10.2. Historical Market Size Value (US$ Million) & Volume (Tons) Analysis By Region, 2017 to 2021

    10.3. Current Market Size Value (US$ Million) & Volume (Tons) Analysis and Forecast By Region, 2022 to 2032

        10.3.1. North America

        10.3.2. Latin America

        10.3.3. Europe

        10.3.4. Asia Pacific

        10.3.5. Middle East and Africa

    10.4. Market Attractiveness Analysis By Region

11. North America Market Analysis 2017 to 2021 and Forecast 2022 to 2032, By Country

    11.1. Historical Market Size Value (US$ Million) & Volume (Tons) Trend Analysis By Market Taxonomy, 2017 to 2021

    11.2. Market Size Value (US$ Million) & Volume (Tons) Forecast By Market Taxonomy, 2022 to 2032

        11.2.1. By Country

            11.2.1.1. United States of America.

            11.2.1.2. Canada

        11.2.2. By Product Type

        11.2.3. By Flavor Type

        11.2.4. By Raw Material

        11.2.5. By Distribution Channel

        11.2.6. By Packaging Type

    11.3. Market Attractiveness Analysis

        11.3.1. By Country

        11.3.2. By Product Type

        11.3.3. By Flavor Type

        11.3.4. By Raw Material

        11.3.5. By Distribution Channel

        11.3.6. By Packaging Type

    11.4. Key Takeaways

12. Latin America Market Analysis 2017 to 2021 and Forecast 2022 to 2032, By Country

    12.1. Historical Market Size Value (US$ Million) & Volume (Tons) Trend Analysis By Market Taxonomy, 2017 to 2021

    12.2. Market Size Value (US$ Million) & Volume (Tons) Forecast By Market Taxonomy, 2022 to 2032

        12.2.1. By Country

            12.2.1.1. Brazil

            12.2.1.2. Mexico

            12.2.1.3. Rest of Latin America

        12.2.2. By Product Type

        12.2.3. By Flavor Type

        12.2.4. By Raw Material

        12.2.5. By Distribution Channel

        12.2.6. By Packaging Type

    12.3. Market Attractiveness Analysis

        12.3.1. By Country

        12.3.2. By Product Type

        12.3.3. By Flavor Type

        12.3.4. By Raw Material

        12.3.5. By Distribution Channel

        12.3.6. By Packaging Type

    12.4. Key Takeaways

13. Europe Market Analysis 2017 to 2021 and Forecast 2022 to 2032, By Country

    13.1. Historical Market Size Value (US$ Million) & Volume (Tons) Trend Analysis By Market Taxonomy, 2017 to 2021

    13.2. Market Size Value (US$ Million) & Volume (Tons) Forecast By Market Taxonomy, 2022 to 2032

        13.2.1. By Country

            13.2.1.1. Germany

            13.2.1.2. United Kingdom.

            13.2.1.3. France

            13.2.1.4. Spain

            13.2.1.5. Italy

            13.2.1.6. Rest of Europe

        13.2.2. By Product Type

        13.2.3. By Flavor Type

        13.2.4. By Raw Material

        13.2.5. By Distribution Channel

        13.2.6. By Packaging Type

    13.3. Market Attractiveness Analysis

        13.3.1. By Country

        13.3.2. By Product Type

        13.3.3. By Flavor Type

        13.3.4. By Raw Material

        13.3.5. By Distribution Channel

        13.3.6. By Packaging Type

    13.4. Key Takeaways

14. Asia Pacific Market Analysis 2017 to 2021 and Forecast 2022 to 2032, By Country

    14.1. Historical Market Size Value (US$ Million) & Volume (Tons) Trend Analysis By Market Taxonomy, 2017 to 2021

    14.2. Market Size Value (US$ Million) & Volume (Tons) Forecast By Market Taxonomy, 2022 to 2032

        14.2.1. By Country

            14.2.1.1. China

            14.2.1.2. Japan

            14.2.1.3. South Korea

            14.2.1.4. Malaysia

            14.2.1.5. Singapore

            14.2.1.6. Australia

            14.2.1.7. New Zealand

            14.2.1.8. Rest of Asia-Pacific

        14.2.2. By Product Type

        14.2.3. By Flavor Type

        14.2.4. By Raw Material

        14.2.5. By Distribution Channel

        14.2.6. By Packaging Type

    14.3. Market Attractiveness Analysis

        14.3.1. By Country

        14.3.2. By Product Type

        14.3.3. By Flavor Type

        14.3.4. By Raw Material

        14.3.5. By Distribution Channel

        14.3.6. By Packaging Type

    14.4. Key Takeaways

15. Middle East and Africa Market Analysis 2017 to 2021 and Forecast 2022 to 2032, By Country

    15.1. Historical Market Size Value (US$ Million) & Volume (Tons) Trend Analysis By Market Taxonomy, 2017 to 2021

    15.2. Market Size Value (US$ Million) & Volume (Tons) Forecast By Market Taxonomy, 2022 to 2032

        15.2.1. By Country

            15.2.1.1. GCC Countries

            15.2.1.2. South Africa

            15.2.1.3. Israel

            15.2.1.4. Rest of Middle East and Africa

        15.2.2. By Product Type

        15.2.3. By Flavor Type

        15.2.4. By Raw Material

        15.2.5. By Distribution Channel

        15.2.6. By Packaging Type

    15.3. Market Attractiveness Analysis

        15.3.1. By Country

        15.3.2. By Product Type

        15.3.3. By Flavor Type

        15.3.4. By Raw Material

        15.3.5. By Distribution Channel

        15.3.6. By Packaging Type

    15.4. Key Takeaways

16. Key Countries Market Analysis

    16.1. United States of America.

        16.1.1. Pricing Analysis

        16.1.2. Market Share Analysis, 2021

            16.1.2.1. By Product Type

            16.1.2.2. By Flavor Type

            16.1.2.3. By Raw Material

            16.1.2.4. By Distribution Channel

            16.1.2.5. By Packaging Type

    16.2. Canada

        16.2.1. Pricing Analysis

        16.2.2. Market Share Analysis, 2021

            16.2.2.1. By Product Type

            16.2.2.2. By Flavor Type

            16.2.2.3. By Raw Material

            16.2.2.4. By Distribution Channel

            16.2.2.5. By Packaging Type

    16.3. Brazil

        16.3.1. Pricing Analysis

        16.3.2. Market Share Analysis, 2021

            16.3.2.1. By Product Type

            16.3.2.2. By Flavor Type

            16.3.2.3. By Raw Material

            16.3.2.4. By Distribution Channel

            16.3.2.5. By Packaging Type

    16.4. Mexico

        16.4.1. Pricing Analysis

        16.4.2. Market Share Analysis, 2021

            16.4.2.1. By Product Type

            16.4.2.2. By Flavor Type

            16.4.2.3. By Raw Material

            16.4.2.4. By Distribution Channel

            16.4.2.5. By Packaging Type

    16.5. Germany

        16.5.1. Pricing Analysis

        16.5.2. Market Share Analysis, 2021

            16.5.2.1. By Product Type

            16.5.2.2. By Flavor Type

            16.5.2.3. By Raw Material

            16.5.2.4. By Distribution Channel

            16.5.2.5. By Packaging Type

    16.6. United Kingdom.

        16.6.1. Pricing Analysis

        16.6.2. Market Share Analysis, 2021

            16.6.2.1. By Product Type

            16.6.2.2. By Flavor Type

            16.6.2.3. By Raw Material

            16.6.2.4. By Distribution Channel

            16.6.2.5. By Packaging Type

    16.7. France

        16.7.1. Pricing Analysis

        16.7.2. Market Share Analysis, 2021

            16.7.2.1. By Product Type

            16.7.2.2. By Flavor Type

            16.7.2.3. By Raw Material

            16.7.2.4. By Distribution Channel

            16.7.2.5. By Packaging Type

    16.8. Spain

        16.8.1. Pricing Analysis

        16.8.2. Market Share Analysis, 2021

            16.8.2.1. By Product Type

            16.8.2.2. By Flavor Type

            16.8.2.3. By Raw Material

            16.8.2.4. By Distribution Channel

            16.8.2.5. By Packaging Type

    16.9. Italy

        16.9.1. Pricing Analysis

        16.9.2. Market Share Analysis, 2021

            16.9.2.1. By Product Type

            16.9.2.2. By Flavor Type

            16.9.2.3. By Raw Material

            16.9.2.4. By Distribution Channel

            16.9.2.5. By Packaging Type

    16.10. China

        16.10.1. Pricing Analysis

        16.10.2. Market Share Analysis, 2021

            16.10.2.1. By Product Type

            16.10.2.2. By Flavor Type

            16.10.2.3. By Raw Material

            16.10.2.4. By Distribution Channel

            16.10.2.5. By Packaging Type

    16.11. Japan

        16.11.1. Pricing Analysis

        16.11.2. Market Share Analysis, 2021

            16.11.2.1. By Product Type

            16.11.2.2. By Flavor Type

            16.11.2.3. By Raw Material

            16.11.2.4. By Distribution Channel

            16.11.2.5. By Packaging Type

    16.12. South Korea

        16.12.1. Pricing Analysis

        16.12.2. Market Share Analysis, 2021

            16.12.2.1. By Product Type

            16.12.2.2. By Flavor Type

            16.12.2.3. By Raw Material

            16.12.2.4. By Distribution Channel

            16.12.2.5. By Packaging Type

    16.13. Malaysia

        16.13.1. Pricing Analysis

        16.13.2. Market Share Analysis, 2021

            16.13.2.1. By Product Type

            16.13.2.2. By Flavor Type

            16.13.2.3. By Raw Material

            16.13.2.4. By Distribution Channel

            16.13.2.5. By Packaging Type

    16.14. Singapore

        16.14.1. Pricing Analysis

        16.14.2. Market Share Analysis, 2021

            16.14.2.1. By Product Type

            16.14.2.2. By Flavor Type

            16.14.2.3. By Raw Material

            16.14.2.4. By Distribution Channel

            16.14.2.5. By Packaging Type

    16.15. Australia

        16.15.1. Pricing Analysis

        16.15.2. Market Share Analysis, 2021

            16.15.2.1. By Product Type

            16.15.2.2. By Flavor Type

            16.15.2.3. By Raw Material

            16.15.2.4. By Distribution Channel

            16.15.2.5. By Packaging Type

    16.16. New Zealand

        16.16.1. Pricing Analysis

        16.16.2. Market Share Analysis, 2021

            16.16.2.1. By Product Type

            16.16.2.2. By Flavor Type

            16.16.2.3. By Raw Material

            16.16.2.4. By Distribution Channel

            16.16.2.5. By Packaging Type

    16.17. GCC Countries

        16.17.1. Pricing Analysis

        16.17.2. Market Share Analysis, 2021

            16.17.2.1. By Product Type

            16.17.2.2. By Flavor Type

            16.17.2.3. By Raw Material

            16.17.2.4. By Distribution Channel

            16.17.2.5. By Packaging Type

    16.18. South Africa

        16.18.1. Pricing Analysis

        16.18.2. Market Share Analysis, 2021

            16.18.2.1. By Product Type

            16.18.2.2. By Flavor Type

            16.18.2.3. By Raw Material

            16.18.2.4. By Distribution Channel

            16.18.2.5. By Packaging Type

    16.19. Israel

        16.19.1. Pricing Analysis

        16.19.2. Market Share Analysis, 2021

            16.19.2.1. By Product Type

            16.19.2.2. By Flavor Type

            16.19.2.3. By Raw Material

            16.19.2.4. By Distribution Channel

            16.19.2.5. By Packaging Type

17. Market Structure Analysis

    17.1. Competition Dashboard

    17.2. Competition Benchmarking

    17.3. Market Share Analysis of Top Players

        17.3.1. By Regional

        17.3.2. By Product Type

        17.3.3. By Flavor Type

        17.3.4. By Raw Material

        17.3.5. By Distribution Channel

        17.3.6. By Packaging Type

18. Competition Analysis

    18.1. Competition Deep Dive

        18.1.1. Quaker Oats Company

            18.1.1.1. Overview

            18.1.1.2. Product Portfolio

            18.1.1.3. Profitability by Market Segments

            18.1.1.4. Sales Footprint

            18.1.1.5. Strategy Overview

                18.1.1.5.1. Marketing Strategy

                18.1.1.5.2. Product Strategy

                18.1.1.5.3. Channel Strategy

        18.1.2. Mars Incorporated

            18.1.2.1. Overview

            18.1.2.2. Product Portfolio

            18.1.2.3. Profitability by Market Segments

            18.1.2.4. Sales Footprint

            18.1.2.5. Strategy Overview

                18.1.2.5.1. Marketing Strategy

                18.1.2.5.2. Product Strategy

                18.1.2.5.3. Channel Strategy

        18.1.3. Element Snacks

            18.1.3.1. Overview

            18.1.3.2. Product Portfolio

            18.1.3.3. Profitability by Market Segments

            18.1.3.4. Sales Footprint

            18.1.3.5. Strategy Overview

                18.1.3.5.1. Marketing Strategy

                18.1.3.5.2. Product Strategy

                18.1.3.5.3. Channel Strategy

        18.1.4. Lundberg

            18.1.4.1. Overview

            18.1.4.2. Product Portfolio

            18.1.4.3. Profitability by Market Segments

            18.1.4.4. Sales Footprint

            18.1.4.5. Strategy Overview

                18.1.4.5.1. Marketing Strategy

                18.1.4.5.2. Product Strategy

                18.1.4.5.3. Channel Strategy

        18.1.5. Tastemorr Snacks

            18.1.5.1. Overview

            18.1.5.2. Product Portfolio

            18.1.5.3. Profitability by Market Segments

            18.1.5.4. Sales Footprint

            18.1.5.5. Strategy Overview

                18.1.5.5.1. Marketing Strategy

                18.1.5.5.2. Product Strategy

                18.1.5.5.3. Channel Strategy

        18.1.6. RACIO

            18.1.6.1. Overview

            18.1.6.2. Product Portfolio

            18.1.6.3. Profitability by Market Segments

            18.1.6.4. Sales Footprint

            18.1.6.5. Strategy Overview

                18.1.6.5.1. Marketing Strategy

                18.1.6.5.2. Product Strategy

                18.1.6.5.3. Channel Strategy

        18.1.7. Sanorice

            18.1.7.1. Overview

            18.1.7.2. Product Portfolio

            18.1.7.3. Profitability by Market Segments

            18.1.7.4. Sales Footprint

            18.1.7.5. Strategy Overview

                18.1.7.5.1. Marketing Strategy

                18.1.7.5.2. Product Strategy

                18.1.7.5.3. Channel Strategy

        18.1.8. NS Trading Co., Ltd

            18.1.8.1. Overview

            18.1.8.2. Product Portfolio

            18.1.8.3. Profitability by Market Segments

            18.1.8.4. Sales Footprint

            18.1.8.5. Strategy Overview

                18.1.8.5.1. Marketing Strategy

                18.1.8.5.2. Product Strategy

                18.1.8.5.3. Channel Strategy

        18.1.9. Songhak Food Co., Ltd.

            18.1.9.1. Overview

            18.1.9.2. Product Portfolio

            18.1.9.3. Profitability by Market Segments

            18.1.9.4. Sales Footprint

            18.1.9.5. Strategy Overview

                18.1.9.5.1. Marketing Strategy

                18.1.9.5.2. Product Strategy

                18.1.9.5.3. Channel Strategy

        18.1.10. Sweet Garden Food Co., Ltd.

            18.1.10.1. Overview

            18.1.10.2. Product Portfolio

            18.1.10.3. Profitability by Market Segments

            18.1.10.4. Sales Footprint

            18.1.10.5. Strategy Overview

                18.1.10.5.1. Marketing Strategy

                18.1.10.5.2. Product Strategy

                18.1.10.5.3. Channel Strategy

19. Assumptions & Acronyms Used

20. Research Methodology

Don't pay for what you don't need

Customize your report by selecting specific countries or regions and save 30%!

List of Tables

Table 1: Global Market Value (US$ Million) Forecast by Region, 2017 to 2032

Table 2: Global Market Volume (Tons) Forecast by Region, 2017 to 2032

Table 3: Global Market Value (US$ Million) Forecast by Product Type, 2017 to 2032

Table 4: Global Market Volume (Tons) Forecast by Product Type, 2017 to 2032

Table 5: Global Market Value (US$ Million) Forecast by Flavor Type, 2017 to 2032

Table 6: Global Market Volume (Tons) Forecast by Flavor Type, 2017 to 2032

Table 7: Global Market Value (US$ Million) Forecast by Raw Material, 2017 to 2032

Table 8: Global Market Volume (Tons) Forecast by Raw Material, 2017 to 2032

Table 9: Global Market Value (US$ Million) Forecast by Distribution Channel, 2017 to 2032

Table 10: Global Market Volume (Tons) Forecast by Distribution Channel, 2017 to 2032

Table 11: Global Market Value (US$ Million) Forecast by Packaging Type, 2017 to 2032

Table 12: Global Market Volume (Tons) Forecast by Packaging Type, 2017 to 2032

Table 13: North America Market Value (US$ Million) Forecast by Country, 2017 to 2032

Table 14: North America Market Volume (Tons) Forecast by Country, 2017 to 2032

Table 15: North America Market Value (US$ Million) Forecast by Product Type, 2017 to 2032

Table 16: North America Market Volume (Tons) Forecast by Product Type, 2017 to 2032

Table 17: North America Market Value (US$ Million) Forecast by Flavor Type, 2017 to 2032

Table 18: North America Market Volume (Tons) Forecast by Flavor Type, 2017 to 2032

Table 19: North America Market Value (US$ Million) Forecast by Raw Material, 2017 to 2032

Table 20: North America Market Volume (Tons) Forecast by Raw Material, 2017 to 2032

Table 21: North America Market Value (US$ Million) Forecast by Distribution Channel, 2017 to 2032

Table 22: North America Market Volume (Tons) Forecast by Distribution Channel, 2017 to 2032

Table 23: North America Market Value (US$ Million) Forecast by Packaging Type, 2017 to 2032

Table 24: North America Market Volume (Tons) Forecast by Packaging Type, 2017 to 2032

Table 25: Latin America Market Value (US$ Million) Forecast by Country, 2017 to 2032

Table 26: Latin America Market Volume (Tons) Forecast by Country, 2017 to 2032

Table 27: Latin America Market Value (US$ Million) Forecast by Product Type, 2017 to 2032

Table 28: Latin America Market Volume (Tons) Forecast by Product Type, 2017 to 2032

Table 29: Latin America Market Value (US$ Million) Forecast by Flavor Type, 2017 to 2032

Table 30: Latin America Market Volume (Tons) Forecast by Flavor Type, 2017 to 2032

Table 31: Latin America Market Value (US$ Million) Forecast by Raw Material, 2017 to 2032

Table 32: Latin America Market Volume (Tons) Forecast by Raw Material, 2017 to 2032

Table 33: Latin America Market Value (US$ Million) Forecast by Distribution Channel, 2017 to 2032

Table 34: Latin America Market Volume (Tons) Forecast by Distribution Channel, 2017 to 2032

Table 35: Latin America Market Value (US$ Million) Forecast by Packaging Type, 2017 to 2032

Table 36: Latin America Market Volume (Tons) Forecast by Packaging Type, 2017 to 2032

Table 37: Europe Market Value (US$ Million) Forecast by Country, 2017 to 2032

Table 38: Europe Market Volume (Tons) Forecast by Country, 2017 to 2032

Table 39: Europe Market Value (US$ Million) Forecast by Product Type, 2017 to 2032

Table 40: Europe Market Volume (Tons) Forecast by Product Type, 2017 to 2032

Table 41: Europe Market Value (US$ Million) Forecast by Flavor Type, 2017 to 2032

Table 42: Europe Market Volume (Tons) Forecast by Flavor Type, 2017 to 2032

Table 43: Europe Market Value (US$ Million) Forecast by Raw Material, 2017 to 2032

Table 44: Europe Market Volume (Tons) Forecast by Raw Material, 2017 to 2032

Table 45: Europe Market Value (US$ Million) Forecast by Distribution Channel, 2017 to 2032

Table 46: Europe Market Volume (Tons) Forecast by Distribution Channel, 2017 to 2032

Table 47: Europe Market Value (US$ Million) Forecast by Packaging Type, 2017 to 2032

Table 48: Europe Market Volume (Tons) Forecast by Packaging Type, 2017 to 2032

Table 49: Asia Pacific Market Value (US$ Million) Forecast by Country, 2017 to 2032

Table 50: Asia Pacific Market Volume (Tons) Forecast by Country, 2017 to 2032

Table 51: Asia Pacific Market Value (US$ Million) Forecast by Product Type, 2017 to 2032

Table 52: Asia Pacific Market Volume (Tons) Forecast by Product Type, 2017 to 2032

Table 53: Asia Pacific Market Value (US$ Million) Forecast by Flavor Type, 2017 to 2032

Table 54: Asia Pacific Market Volume (Tons) Forecast by Flavor Type, 2017 to 2032

Table 55: Asia Pacific Market Value (US$ Million) Forecast by Raw Material, 2017 to 2032

Table 56: Asia Pacific Market Volume (Tons) Forecast by Raw Material, 2017 to 2032

Table 57: Asia Pacific Market Value (US$ Million) Forecast by Distribution Channel, 2017 to 2032

Table 58: Asia Pacific Market Volume (Tons) Forecast by Distribution Channel, 2017 to 2032

Table 59: Asia Pacific Market Value (US$ Million) Forecast by Packaging Type, 2017 to 2032

Table 60: Asia Pacific Market Volume (Tons) Forecast by Packaging Type, 2017 to 2032

Table 61: Middle East and Africa Market Value (US$ Million) Forecast by Country, 2017 to 2032

Table 62: Middle East and Africa Market Volume (Tons) Forecast by Country, 2017 to 2032

Table 63: Middle East and Africa Market Value (US$ Million) Forecast by Product Type, 2017 to 2032

Table 64: Middle East and Africa Market Volume (Tons) Forecast by Product Type, 2017 to 2032

Table 65: Middle East and Africa Market Value (US$ Million) Forecast by Flavor Type, 2017 to 2032

Table 66: Middle East and Africa Market Volume (Tons) Forecast by Flavor Type, 2017 to 2032

Table 67: Middle East and Africa Market Value (US$ Million) Forecast by Raw Material, 2017 to 2032

Table 68: Middle East and Africa Market Volume (Tons) Forecast by Raw Material, 2017 to 2032

Table 69: Middle East and Africa Market Value (US$ Million) Forecast by Distribution Channel, 2017 to 2032

Table 70: Middle East and Africa Market Volume (Tons) Forecast by Distribution Channel, 2017 to 2032

Table 71: Middle East and Africa Market Value (US$ Million) Forecast by Packaging Type, 2017 to 2032

Table 72: Middle East and Africa Market Volume (Tons) Forecast by Packaging Type, 2017 to 2032
Nandini Roy Choudhury
Principal Consultant
LinkedIn
Talk to Analyst

Find your sweet spots for generating winning opportunities in this market.

Talk to Analyst

List of Charts

Figure 1: Global Market Value (US$ Million) by Product Type, 2022 to 2032

Figure 2: Global Market Value (US$ Million) by Flavor Type, 2022 to 2032

Figure 3: Global Market Value (US$ Million) by Raw Material, 2022 to 2032

Figure 4: Global Market Value (US$ Million) by Distribution Channel, 2022 to 2032

Figure 5: Global Market Value (US$ Million) by Packaging Type, 2022 to 2032

Figure 6: Global Market Value (US$ Million) by Region, 2022 to 2032

Figure 7: Global Market Value (US$ Million) Analysis by Region, 2017 to 2032

Figure 8: Global Market Volume (Tons) Analysis by Region, 2017 to 2032

Figure 9: Global Market Value Share (%) and BPS Analysis by Region, 2022 to 2032

Figure 10: Global Market Y-o-Y Growth (%) Projections by Region, 2022 to 2032

Figure 11: Global Market Value (US$ Million) Analysis by Product Type, 2017 to 2032

Figure 12: Global Market Volume (Tons) Analysis by Product Type, 2017 to 2032

Figure 13: Global Market Value Share (%) and BPS Analysis by Product Type, 2022 to 2032

Figure 14: Global Market Y-o-Y Growth (%) Projections by Product Type, 2022 to 2032

Figure 15: Global Market Value (US$ Million) Analysis by Flavor Type, 2017 to 2032

Figure 16: Global Market Volume (Tons) Analysis by Flavor Type, 2017 to 2032

Figure 17: Global Market Value Share (%) and BPS Analysis by Flavor Type, 2022 to 2032

Figure 18: Global Market Y-o-Y Growth (%) Projections by Flavor Type, 2022 to 2032

Figure 19: Global Market Value (US$ Million) Analysis by Raw Material, 2017 to 2032

Figure 20: Global Market Volume (Tons) Analysis by Raw Material, 2017 to 2032

Figure 21: Global Market Value Share (%) and BPS Analysis by Raw Material, 2022 to 2032

Figure 22: Global Market Y-o-Y Growth (%) Projections by Raw Material, 2022 to 2032

Figure 23: Global Market Value (US$ Million) Analysis by Distribution Channel, 2017 to 2032

Figure 24: Global Market Volume (Tons) Analysis by Distribution Channel, 2017 to 2032

Figure 25: Global Market Value Share (%) and BPS Analysis by Distribution Channel, 2022 to 2032

Figure 26: Global Market Y-o-Y Growth (%) Projections by Distribution Channel, 2022 to 2032

Figure 27: Global Market Value (US$ Million) Analysis by Packaging Type, 2017 to 2032

Figure 28: Global Market Volume (Tons) Analysis by Packaging Type, 2017 to 2032

Figure 29: Global Market Value Share (%) and BPS Analysis by Packaging Type, 2022 to 2032

Figure 30: Global Market Y-o-Y Growth (%) Projections by Packaging Type, 2022 to 2032

Figure 31: Global Market Attractiveness by Product Type, 2022 to 2032

Figure 32: Global Market Attractiveness by Flavor Type, 2022 to 2032

Figure 33: Global Market Attractiveness by Raw Material, 2022 to 2032

Figure 34: Global Market Attractiveness by Distribution Channel, 2022 to 2032

Figure 35: Global Market Attractiveness by Packaging Type, 2022 to 2032

Figure 36: Global Market Attractiveness by Region, 2022 to 2032

Figure 37: North America Market Value (US$ Million) by Product Type, 2022 to 2032

Figure 38: North America Market Value (US$ Million) by Flavor Type, 2022 to 2032

Figure 39: North America Market Value (US$ Million) by Raw Material, 2022 to 2032

Figure 40: North America Market Value (US$ Million) by Distribution Channel, 2022 to 2032

Figure 41: North America Market Value (US$ Million) by Packaging Type, 2022 to 2032

Figure 42: North America Market Value (US$ Million) by Country, 2022 to 2032

Figure 43: North America Market Value (US$ Million) Analysis by Country, 2017 to 2032

Figure 44: North America Market Volume (Tons) Analysis by Country, 2017 to 2032

Figure 45: North America Market Value Share (%) and BPS Analysis by Country, 2022 to 2032

Figure 46: North America Market Y-o-Y Growth (%) Projections by Country, 2022 to 2032

Figure 47: North America Market Value (US$ Million) Analysis by Product Type, 2017 to 2032

Figure 48: North America Market Volume (Tons) Analysis by Product Type, 2017 to 2032

Figure 49: North America Market Value Share (%) and BPS Analysis by Product Type, 2022 to 2032

Figure 50: North America Market Y-o-Y Growth (%) Projections by Product Type, 2022 to 2032

Figure 51: North America Market Value (US$ Million) Analysis by Flavor Type, 2017 to 2032

Figure 52: North America Market Volume (Tons) Analysis by Flavor Type, 2017 to 2032

Figure 53: North America Market Value Share (%) and BPS Analysis by Flavor Type, 2022 to 2032

Figure 54: North America Market Y-o-Y Growth (%) Projections by Flavor Type, 2022 to 2032

Figure 55: North America Market Value (US$ Million) Analysis by Raw Material, 2017 to 2032

Figure 56: North America Market Volume (Tons) Analysis by Raw Material, 2017 to 2032

Figure 57: North America Market Value Share (%) and BPS Analysis by Raw Material, 2022 to 2032

Figure 58: North America Market Y-o-Y Growth (%) Projections by Raw Material, 2022 to 2032

Figure 59: North America Market Value (US$ Million) Analysis by Distribution Channel, 2017 to 2032

Figure 60: North America Market Volume (Tons) Analysis by Distribution Channel, 2017 to 2032

Figure 61: North America Market Value Share (%) and BPS Analysis by Distribution Channel, 2022 to 2032

Figure 62: North America Market Y-o-Y Growth (%) Projections by Distribution Channel, 2022 to 2032

Figure 63: North America Market Value (US$ Million) Analysis by Packaging Type, 2017 to 2032

Figure 64: North America Market Volume (Tons) Analysis by Packaging Type, 2017 to 2032

Figure 65: North America Market Value Share (%) and BPS Analysis by Packaging Type, 2022 to 2032

Figure 66: North America Market Y-o-Y Growth (%) Projections by Packaging Type, 2022 to 2032

Figure 67: North America Market Attractiveness by Product Type, 2022 to 2032

Figure 68: North America Market Attractiveness by Flavor Type, 2022 to 2032

Figure 69: North America Market Attractiveness by Raw Material, 2022 to 2032

Figure 70: North America Market Attractiveness by Distribution Channel, 2022 to 2032

Figure 71: North America Market Attractiveness by Packaging Type, 2022 to 2032

Figure 72: North America Market Attractiveness by Country, 2022 to 2032

Figure 73: Latin America Market Value (US$ Million) by Product Type, 2022 to 2032

Figure 74: Latin America Market Value (US$ Million) by Flavor Type, 2022 to 2032

Figure 75: Latin America Market Value (US$ Million) by Raw Material, 2022 to 2032

Figure 76: Latin America Market Value (US$ Million) by Distribution Channel, 2022 to 2032

Figure 77: Latin America Market Value (US$ Million) by Packaging Type, 2022 to 2032

Figure 78: Latin America Market Value (US$ Million) by Country, 2022 to 2032

Figure 79: Latin America Market Value (US$ Million) Analysis by Country, 2017 to 2032

Figure 80: Latin America Market Volume (Tons) Analysis by Country, 2017 to 2032

Figure 81: Latin America Market Value Share (%) and BPS Analysis by Country, 2022 to 2032

Figure 82: Latin America Market Y-o-Y Growth (%) Projections by Country, 2022 to 2032

Figure 83: Latin America Market Value (US$ Million) Analysis by Product Type, 2017 to 2032

Figure 84: Latin America Market Volume (Tons) Analysis by Product Type, 2017 to 2032

Figure 85: Latin America Market Value Share (%) and BPS Analysis by Product Type, 2022 to 2032

Figure 86: Latin America Market Y-o-Y Growth (%) Projections by Product Type, 2022 to 2032

Figure 87: Latin America Market Value (US$ Million) Analysis by Flavor Type, 2017 to 2032

Figure 88: Latin America Market Volume (Tons) Analysis by Flavor Type, 2017 to 2032

Figure 89: Latin America Market Value Share (%) and BPS Analysis by Flavor Type, 2022 to 2032

Figure 90: Latin America Market Y-o-Y Growth (%) Projections by Flavor Type, 2022 to 2032

Figure 91: Latin America Market Value (US$ Million) Analysis by Raw Material, 2017 to 2032

Figure 92: Latin America Market Volume (Tons) Analysis by Raw Material, 2017 to 2032

Figure 93: Latin America Market Value Share (%) and BPS Analysis by Raw Material, 2022 to 2032

Figure 94: Latin America Market Y-o-Y Growth (%) Projections by Raw Material, 2022 to 2032

Figure 95: Latin America Market Value (US$ Million) Analysis by Distribution Channel, 2017 to 2032

Figure 96: Latin America Market Volume (Tons) Analysis by Distribution Channel, 2017 to 2032

Figure 97: Latin America Market Value Share (%) and BPS Analysis by Distribution Channel, 2022 to 2032

Figure 98: Latin America Market Y-o-Y Growth (%) Projections by Distribution Channel, 2022 to 2032

Figure 99: Latin America Market Value (US$ Million) Analysis by Packaging Type, 2017 to 2032

Figure 100: Latin America Market Volume (Tons) Analysis by Packaging Type, 2017 to 2032

Figure 101: Latin America Market Value Share (%) and BPS Analysis by Packaging Type, 2022 to 2032

Figure 102: Latin America Market Y-o-Y Growth (%) Projections by Packaging Type, 2022 to 2032

Figure 103: Latin America Market Attractiveness by Product Type, 2022 to 2032

Figure 104: Latin America Market Attractiveness by Flavor Type, 2022 to 2032

Figure 105: Latin America Market Attractiveness by Raw Material, 2022 to 2032

Figure 106: Latin America Market Attractiveness by Distribution Channel, 2022 to 2032

Figure 107: Latin America Market Attractiveness by Packaging Type, 2022 to 2032

Figure 108: Latin America Market Attractiveness by Country, 2022 to 2032

Figure 109: Europe Market Value (US$ Million) by Product Type, 2022 to 2032

Figure 110: Europe Market Value (US$ Million) by Flavor Type, 2022 to 2032

Figure 111: Europe Market Value (US$ Million) by Raw Material, 2022 to 2032

Figure 112: Europe Market Value (US$ Million) by Distribution Channel, 2022 to 2032

Figure 113: Europe Market Value (US$ Million) by Packaging Type, 2022 to 2032

Figure 114: Europe Market Value (US$ Million) by Country, 2022 to 2032

Figure 115: Europe Market Value (US$ Million) Analysis by Country, 2017 to 2032

Figure 116: Europe Market Volume (Tons) Analysis by Country, 2017 to 2032

Figure 117: Europe Market Value Share (%) and BPS Analysis by Country, 2022 to 2032

Figure 118: Europe Market Y-o-Y Growth (%) Projections by Country, 2022 to 2032

Figure 119: Europe Market Value (US$ Million) Analysis by Product Type, 2017 to 2032

Figure 120: Europe Market Volume (Tons) Analysis by Product Type, 2017 to 2032

Figure 121: Europe Market Value Share (%) and BPS Analysis by Product Type, 2022 to 2032

Figure 122: Europe Market Y-o-Y Growth (%) Projections by Product Type, 2022 to 2032

Figure 123: Europe Market Value (US$ Million) Analysis by Flavor Type, 2017 to 2032

Figure 124: Europe Market Volume (Tons) Analysis by Flavor Type, 2017 to 2032

Figure 125: Europe Market Value Share (%) and BPS Analysis by Flavor Type, 2022 to 2032

Figure 126: Europe Market Y-o-Y Growth (%) Projections by Flavor Type, 2022 to 2032

Figure 127: Europe Market Value (US$ Million) Analysis by Raw Material, 2017 to 2032

Figure 128: Europe Market Volume (Tons) Analysis by Raw Material, 2017 to 2032

Figure 129: Europe Market Value Share (%) and BPS Analysis by Raw Material, 2022 to 2032

Figure 130: Europe Market Y-o-Y Growth (%) Projections by Raw Material, 2022 to 2032

Figure 131: Europe Market Value (US$ Million) Analysis by Distribution Channel, 2017 to 2032

Figure 132: Europe Market Volume (Tons) Analysis by Distribution Channel, 2017 to 2032

Figure 133: Europe Market Value Share (%) and BPS Analysis by Distribution Channel, 2022 to 2032

Figure 134: Europe Market Y-o-Y Growth (%) Projections by Distribution Channel, 2022 to 2032

Figure 135: Europe Market Value (US$ Million) Analysis by Packaging Type, 2017 to 2032

Figure 136: Europe Market Volume (Tons) Analysis by Packaging Type, 2017 to 2032

Figure 137: Europe Market Value Share (%) and BPS Analysis by Packaging Type, 2022 to 2032

Figure 138: Europe Market Y-o-Y Growth (%) Projections by Packaging Type, 2022 to 2032

Figure 139: Europe Market Attractiveness by Product Type, 2022 to 2032

Figure 140: Europe Market Attractiveness by Flavor Type, 2022 to 2032

Figure 141: Europe Market Attractiveness by Raw Material, 2022 to 2032

Figure 142: Europe Market Attractiveness by Distribution Channel, 2022 to 2032

Figure 143: Europe Market Attractiveness by Packaging Type, 2022 to 2032

Figure 144: Europe Market Attractiveness by Country, 2022 to 2032

Figure 145: Asia Pacific Market Value (US$ Million) by Product Type, 2022 to 2032

Figure 146: Asia Pacific Market Value (US$ Million) by Flavor Type, 2022 to 2032

Figure 147: Asia Pacific Market Value (US$ Million) by Raw Material, 2022 to 2032

Figure 148: Asia Pacific Market Value (US$ Million) by Distribution Channel, 2022 to 2032

Figure 149: Asia Pacific Market Value (US$ Million) by Packaging Type, 2022 to 2032

Figure 150: Asia Pacific Market Value (US$ Million) by Country, 2022 to 2032

Figure 151: Asia Pacific Market Value (US$ Million) Analysis by Country, 2017 to 2032

Figure 152: Asia Pacific Market Volume (Tons) Analysis by Country, 2017 to 2032

Figure 153: Asia Pacific Market Value Share (%) and BPS Analysis by Country, 2022 to 2032

Figure 154: Asia Pacific Market Y-o-Y Growth (%) Projections by Country, 2022 to 2032

Figure 155: Asia Pacific Market Value (US$ Million) Analysis by Product Type, 2017 to 2032

Figure 156: Asia Pacific Market Volume (Tons) Analysis by Product Type, 2017 to 2032

Figure 157: Asia Pacific Market Value Share (%) and BPS Analysis by Product Type, 2022 to 2032

Figure 158: Asia Pacific Market Y-o-Y Growth (%) Projections by Product Type, 2022 to 2032

Figure 159: Asia Pacific Market Value (US$ Million) Analysis by Flavor Type, 2017 to 2032

Figure 160: Asia Pacific Market Volume (Tons) Analysis by Flavor Type, 2017 to 2032

Figure 161: Asia Pacific Market Value Share (%) and BPS Analysis by Flavor Type, 2022 to 2032

Figure 162: Asia Pacific Market Y-o-Y Growth (%) Projections by Flavor Type, 2022 to 2032

Figure 163: Asia Pacific Market Value (US$ Million) Analysis by Raw Material, 2017 to 2032

Figure 164: Asia Pacific Market Volume (Tons) Analysis by Raw Material, 2017 to 2032

Figure 165: Asia Pacific Market Value Share (%) and BPS Analysis by Raw Material, 2022 to 2032

Figure 166: Asia Pacific Market Y-o-Y Growth (%) Projections by Raw Material, 2022 to 2032

Figure 167: Asia Pacific Market Value (US$ Million) Analysis by Distribution Channel, 2017 to 2032

Figure 168: Asia Pacific Market Volume (Tons) Analysis by Distribution Channel, 2017 to 2032

Figure 169: Asia Pacific Market Value Share (%) and BPS Analysis by Distribution Channel, 2022 to 2032

Figure 170: Asia Pacific Market Y-o-Y Growth (%) Projections by Distribution Channel, 2022 to 2032

Figure 171: Asia Pacific Market Value (US$ Million) Analysis by Packaging Type, 2017 to 2032

Figure 172: Asia Pacific Market Volume (Tons) Analysis by Packaging Type, 2017 to 2032

Figure 173: Asia Pacific Market Value Share (%) and BPS Analysis by Packaging Type, 2022 to 2032

Figure 174: Asia Pacific Market Y-o-Y Growth (%) Projections by Packaging Type, 2022 to 2032

Figure 175: Asia Pacific Market Attractiveness by Product Type, 2022 to 2032

Figure 176: Asia Pacific Market Attractiveness by Flavor Type, 2022 to 2032

Figure 177: Asia Pacific Market Attractiveness by Raw Material, 2022 to 2032

Figure 178: Asia Pacific Market Attractiveness by Distribution Channel, 2022 to 2032

Figure 179: Asia Pacific Market Attractiveness by Packaging Type, 2022 to 2032

Figure 180: Asia Pacific Market Attractiveness by Country, 2022 to 2032

Figure 181: Middle East and Africa Market Market Value (US$ Million) by Product Type, 2022 to 2032

Figure 182: Middle East and Africa Market Market Value (US$ Million) by Flavor Type, 2022 to 2032

Figure 183: Middle East and Africa Market Market Value (US$ Million) by Raw Material, 2022 to 2032

Figure 184: Middle East and Africa Market Market Value (US$ Million) by Distribution Channel, 2022 to 2032

Figure 185: Middle East and Africa Market Market Value (US$ Million) by Packaging Type, 2022 to 2032

Figure 186: Middle East and Africa Market Market Value (US$ Million) by Country, 2022 to 2032

Figure 187: Middle East and Africa Market Market Value (US$ Million) Analysis by Country, 2017 to 2032

Figure 188: Middle East and Africa Market Market Volume (Tons) Analysis by Country, 2017 to 2032

Figure 189: Middle East and Africa Market Market Value Share (%) and BPS Analysis by Country, 2022 to 2032

Figure 190: Middle East and Africa Market Market Y-o-Y Growth (%) Projections by Country, 2022 to 2032

Figure 191: Middle East and Africa Market Market Value (US$ Million) Analysis by Product Type, 2017 to 2032

Figure 192: Middle East and Africa Market Market Volume (Tons) Analysis by Product Type, 2017 to 2032

Figure 193: Middle East and Africa Market Market Value Share (%) and BPS Analysis by Product Type, 2022 to 2032

Figure 194: Middle East and Africa Market Market Y-o-Y Growth (%) Projections by Product Type, 2022 to 2032

Figure 195: Middle East and Africa Market Market Value (US$ Million) Analysis by Flavor Type, 2017 to 2032

Figure 196: Middle East and Africa Market Market Volume (Tons) Analysis by Flavor Type, 2017 to 2032

Figure 197: Middle East and Africa Market Market Value Share (%) and BPS Analysis by Flavor Type, 2022 to 2032

Figure 198: Middle East and Africa Market Market Y-o-Y Growth (%) Projections by Flavor Type, 2022 to 2032

Figure 199: Middle East and Africa Market Market Value (US$ Million) Analysis by Raw Material, 2017 to 2032

Figure 200: Middle East and Africa Market Market Volume (Tons) Analysis by Raw Material, 2017 to 2032

Figure 201: Middle East and Africa Market Market Value Share (%) and BPS Analysis by Raw Material, 2022 to 2032

Figure 202: Middle East and Africa Market Market Y-o-Y Growth (%) Projections by Raw Material, 2022 to 2032

Figure 203: Middle East and Africa Market Market Value (US$ Million) Analysis by Distribution Channel, 2017 to 2032

Figure 204: Middle East and Africa Market Market Volume (Tons) Analysis by Distribution Channel, 2017 to 2032

Figure 205: Middle East and Africa Market Market Value Share (%) and BPS Analysis by Distribution Channel, 2022 to 2032

Figure 206: Middle East and Africa Market Market Y-o-Y Growth (%) Projections by Distribution Channel, 2022 to 2032

Figure 207: Middle East and Africa Market Market Value (US$ Million) Analysis by Packaging Type, 2017 to 2032

Figure 208: Middle East and Africa Market Market Volume (Tons) Analysis by Packaging Type, 2017 to 2032

Figure 209: Middle East and Africa Market Market Value Share (%) and BPS Analysis by Packaging Type, 2022 to 2032

Figure 210: Middle East and Africa Market Market Y-o-Y Growth (%) Projections by Packaging Type, 2022 to 2032

Figure 211: Middle East and Africa Market Market Attractiveness by Product Type, 2022 to 2032

Figure 212: Middle East and Africa Market Market Attractiveness by Flavor Type, 2022 to 2032

Figure 213: Middle East and Africa Market Market Attractiveness by Raw Material, 2022 to 2032

Figure 214: Middle East and Africa Market Market Attractiveness by Distribution Channel, 2022 to 2032

Figure 215: Middle East and Africa Market Market Attractiveness by Packaging Type, 2022 to 2032

Figure 216: Middle East and Africa Market Market Attractiveness by Country, 2022 to 2032

Recommendations

Food and Beverage

Wild Rice Market

Published : December 2022

Food and Beverage

Brown Rice Market

Published : August 2022

Food and Beverage

White Rice Flour Market

Published : June 2019

Food and Beverage

Organic Rice Market

Published : March 2018

Explore Food and Beverage Insights

View Reports
Google translate