Varicella Zoster Infection Treatment Market
Market Insights on Varicella Zoster Infection Treatment covering sales outlook, demand forecast & up-to-date key trends
Varicella Zoster Infection Treatment Market by Drug Type (Acyclovir, Valacyclovir and Famciclovir), by Route of Administration (Oral, Topical & Injectable), by Distribution Channel (Hospital Pharmacies, Retail Pharmacies, Online Pharmacies and Drug Stores) and by Region, Forecast for 2022 - 2028
Varicella Zoster Infection Treatment Market Snapshot
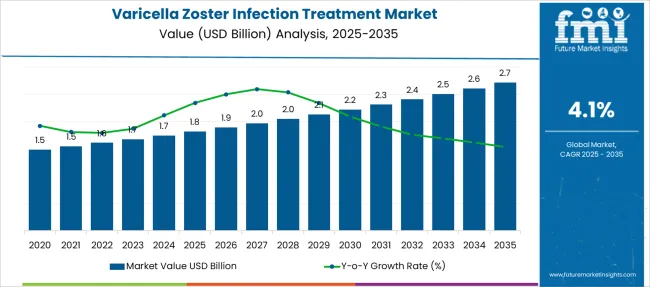
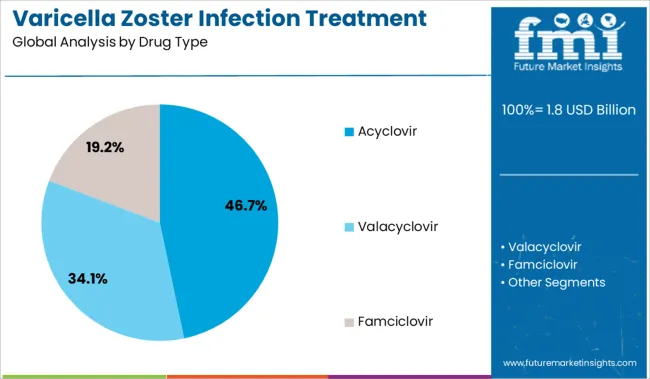
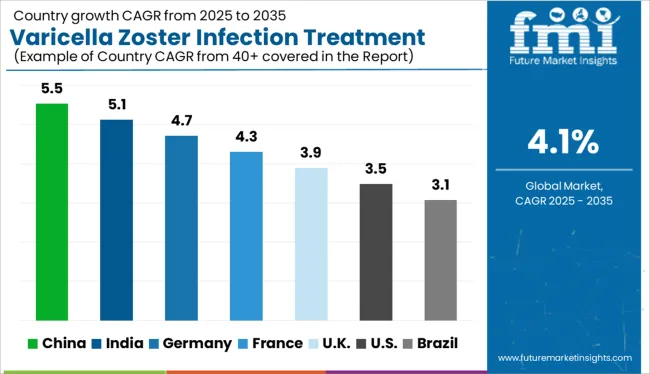
[276 Pages Report] The global Varicella Zoster Infection Treatment Market in 2020 is estimated for more than US$ 1.5 Bn and expected to reach a value of US$ 2.0 Bn by 2028 with a significant CAGR of 4.1%. As per Future Market Insights’ projections, in 2022, the acyclovir holds a substantial share of over 55.7% in the overall varicella zoster infection treatment market.
Human alphaherpesvirus 3, also known as Varicella Zoster virus (VZV) is one of the many herpesviruses that is known to infect humans. It is also the one causing infectious diseases like chicken pox (which is mostly common among children and teens) and herpes zoster (shingles) (mostly affecting adults but rarely in children). The growing incidence of herpes zoster (shingles) infection among the children’s and the elderly and the rising demand towards the treatment of the infection is aiding the growth of the market.
Market Outlook:
Data Points |
Market Insights |
Market Value 2022 |
US$ 1.61 Bn |
Market Value 2028 |
US$ 2.05 Bn |
CAGR 2022-2028 |
4.1% |
Share of top 5 Countries |
52.3% |
Key Players |
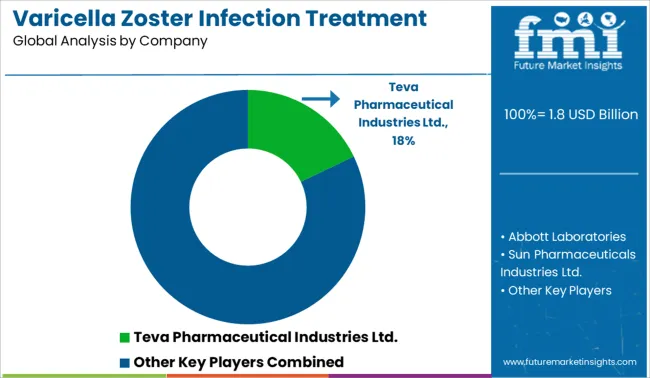
Novartis AG, Pfizer Inc., Abbott Laboratories, Sun Pharmaceuticals Industries Ltd., Valeant Pharmaceuticals International Inc., Teva Pharmaceutical Industries Ltd., Dr. Reddy’s Laboratories, ltd., Mylan N.V. and GlaxoSmithKline plc and Others (100% Market Share) |
Let us know your requirement to get
100% FREE customization
How The Market Progressed Till June 2022?
Particulars |
Details |
H1, 2021 |
4.17% |
H1, 2022 Projected |
4.11% |
H1, 2022 Outlook |
4.01% |
BPS Change - H1, 2022 (O) – H1, 2022 (P) |
(-) 10 ↓ |
BPS Change – H1, 2022 (O) – H1, 2021 |
(-) 16 ↓ |
A comparative analysis about the market growth rates and development prospects in the global varicella zoster infection treatment market have been mapped by Future Market Insights. According to the FMI analysis, compared to H1-2021, the market is expected to decline by 16 Basis Point Share (BPS) in H1 2022 (O).
Major reasons for this dip in BPS are attributed to the adverse effects of antiviral therapy which include neurological, gastrointestinal, and renal toxicity. The market further observes a decline in 10 BPS in H1-2022 outlook as compared to H1-2022 projected period.
The market is subject to be influenced by regulatory guidelines and medical device approvals in accordance with impact of macro, economic, and industry factors. Prevention of varicella zoster infection through vaccination strategies permits the avoidance of primary infections in neonates and vulnerable cases. These are some of the significant breakthroughs in the varicella zoster infection treatment market.
Other market segments are correspondingly set to perform objectively and attain promising growth prospects in the next half of projection period. Additionally, there are some factors which positively drive the industry growth, including the improvement of cell medicated immunity after second administration of varicella vaccine, and long-lasting immunity response of live attenuated vaccines.
2016-2021 Varicella Zoster Infection Treatment Demand Outlook Compared to 2022-2028 Forecast
The Global varicella zoster infection treatment market is expected to grow at a modest rate during the forecast period. The epidemiology of the varicella infection is higher in children aged 4-10 year. However, Herpes zoster occur due to reactivation of varicella zoster virus in older age, where, the incidence is higher in older age population >60 years compared to adults and children.
For instance, in 2021, United States (US) reported that the risk of Herpes Zoster increases with age. A cumulative incidence of Herpes Zoster were reported to be from 2.9–19.5 cases per 1,000 population and an incidence rate of Herpes Zoster ranging from 5.23–10.9 cases per 1,000 person-years. It is been expected that the incidence of herpes zoster in these countries will increase with increasing older age population.
The Global Varicella Zoster Infection Treatment market constitutes nearly 3% of the ~52.7 Bn Antiviral Drugs Market, globally in 2021. Herpes zoster is not common in children younger than 1 year and is rarely found in children’ younger than 1 year. However, if a pregnant female witness’s varicella zoster infection during pregnancy, there are high chances of the fetus developing asymptomatic congenital infections. Such children generally present herpes zoster within the first year of their life. Furthermore, the growing risk of prenatal varicella zoster leads to the uptake of antiviral drugs treatment later in pregnancy. Thus, the growing risk of postnatal varicella zoster infection in children younger than 1 year of age and the subsequent use of acyclovir as the first line of treatment for these infected children will drive the growth of varicella zoster infection treatment market in future.
Hence, the demand outlook for varicella zoster infection treatment market is expected to grow rapidly during the forecast period from 2022- 2028 owing to the growing demand for effective drug treatments for varicella zoster infections.
The market is expected to expand at a considerable growth rate for the period 2022-2028 at a CAGR of approximately 4.1%, and observe an incremental $ opportunity of USD 438.6 Mn from 2022 to 2028. Demand for Acyclovir drug as a first line treatment will remain the maximum throughout the forecast period.
What are the Key Opportunities for Market Players?
The increasing incidences of viral borne disease among children and old population, high transmission rate of the infection, high occurrence of infections in low or middle-income countries and growing revenue of the market players are the major factors contributing to the growth of the varicella zoster infection treatment market.
The companies in the varicella zoster infection treatment market are focusing on organic and inorganic growth by launching their products and to gain maximum market share. Moreover, acquisitions, expansion of product portfolio and research & development capabilities are expected to create opportunities for the growth of the market.
- For instance, in July 2021, US Food and Drug Administration (FDA) has approved Shingrix (Zoster Vaccine Recombinant, Adjuvanted) for the prevention of shingles (herpes zoster) in adults aged 18 years and older who are or who will be at increased risk of shingles due to immunodeficiency or immunosuppression.
Find your sweet spots for generating winning opportunities in this market.
Talk to AnalystWhat are the key challenges to Varicella Zoster Infection Treatment Market?
The adverse effect of anti-viral therapy treatment among the elderly population presents a biggest challenge for the market to grow ahead, the elderly care itself is an intensive care segment and onset of viral diseases like Herpes Zoster increases the risk of associated infections and other reactions.
Moreover, availability of other treatment options for treating the herpes zoster and varicella such as homeopathy, supplements and other natural herbal medicines may also come out as a bigger challenge for the varicella zoster infection treatment market. A clinical study done in China also revealed that the modified Gentiana formula when combined with the topical cream as a treatment for post-herpetic neuralgia, was more effective than the antiviral drugs treatment. Additionally, introduction of generic drugs by the local players in large number together with rising cases of product recalls of many such drugs are leading to create quality concern of these generic drugs amongst the consumers. All such factors together may pose greater challenges for the varicella zoster infection treatment market growth during the forecast period.
What is the Impact of the COVID-19 Crisis on the Market?
The COVID-19 outbreak initially affected the market negatively due to the lockdowns that were imposed in the first half of 2020, which resulted in disruption of the supply chain. Also, fall in number of surgeries and reduced patient visits to the hospitals due to change in healthcare priorities and also as a prevention measure to avoid contracting the disease also resulted in drop in the number of patients visiting hospitals for disease other than COVID-19.
However, with the opening of all the economies and the people now adapting to the new normal the market is been expected to achieve significant growth during the forecast period. Companies are revising their long-term strategies to develop adequate crisis-management strategies that place a premium on next-generation products and solutions, varicella zoster

An unified Market Research Subscription Platform, built for today’s disparate research needs.
Country-wise Insights
Will the U.S. Remain a Key Market for Varicella Zoster Infection Market?
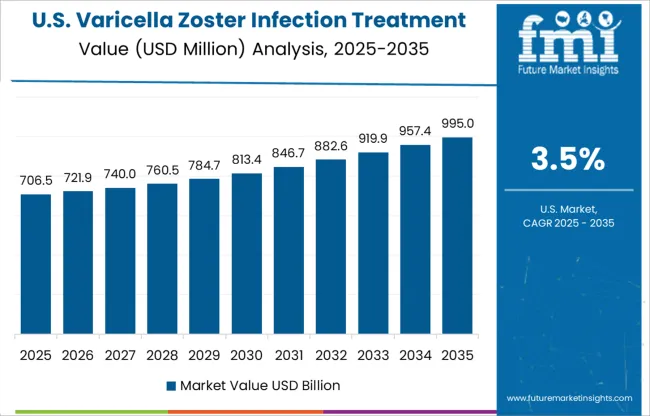
The U.S. is the leading country of the North American region with a total market value share of 90.3% in 2021 and is projected to continue commanding the high growth during the coming years from 2022- 2028. The deep incidence of herpes infection among children mainly drives the growth of this market & their humanization and increasing pets disorder owing to rise in disease incidence.
For instance, as per Centre for Diseases Prevention and Control, an estimated one million cases of herpes zoster occur annually in the United States. The incidence for herpes zoster is approximately 4 cases per 1,000 U.S. population annually.
Additionally, presence of major players involved in the commercialization and development of herpes zoster interventions is also one of the major factor for the growth of this market in this region.
Why is Germany Considered a More Lucrative Market within Europe?
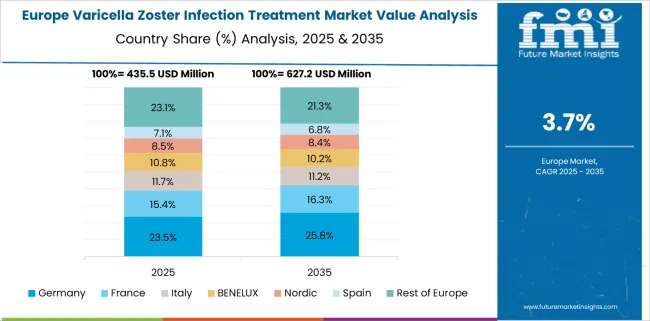
Germany dominates the Western Europe market of varicella zoster, with a share of nearly 24.7% of the market share by value in 2021. Similar growth is expected throughout the forecast period owing to the higher prevalence of herpes and increasing research and development activities which is also contributing to the varicella zoster infection treatment market growth in the region.
For instance, the incidence of HZ in Germany ranges from about 1/1,000 in children aged less than 10 years, to more than 10/1,000 in persons aged 80 years and older; the incidence becomes distinctly higher in persons from 50 years onwards.
Why is Japan an Emerging Market for Varicella zoster infection treatment?
In 2021, Japan holds around 6.9% share in the global market by value and is been estimated to expand at a CAGR of 2.7% during the forecast period. The rising incidence of Herpes Zoster in the general population aged ≥ 50 or ≥ 60 years in the country leads to enhance the demand of varicella zoster infection treatment.
Additionally, rising government funding and support for vaccination and awareness campaigns are expected to propel the varicella zoster infection treatment market forward throughout the projection period.
What is the Outlook in China for the Varicella Zoster Infection Treatment Market?
In 2021, China has considerable share by value in the global market ranging around 8.7% and is been projected to expand at a CAGR of 4.5% from 2022-2028. This is predominantly due to the increasing risk of herpes zoster among the elderly population. Approximately, 32% of the Chinese population is aged 50 years and older and this proportion is increasing. Because of the ageing population, the public burden associated with shingles is been expected to increase over the time.
Category-wise Insights
Which Varicella Zoster Infection Treatment Product is driving the market growth?
By product, acyclovir drug accounts for the highest share of around 55.9% in 2021 and expected to expand at a CAGR of 3.7% during the forecast period from 2022 - 2028.
Acyclovir presents the broader scope for the treatment of herpes zoster. It is also used to treat repeat outbreaks to prevent further outbreaks of genital herpes (a herpes virus infection that causes sores to form around the genitals and rectum from time to time) in people with a normal immune system. Famciclovir is also used to treat returning herpes simplex infections of the skin and mucus membranes (mouth, anus) in people with human immunodeficiency virus (HIV) infection
Owing to its broader benefits, the varicella zoster infection treatment market is experiencing its faster adoption, resulting in driving the demand for the drug in the varicella zoster infection treatment during the forecast period from 2022-2028.
Why does the Oral route of drug administration hold a High Market Share?
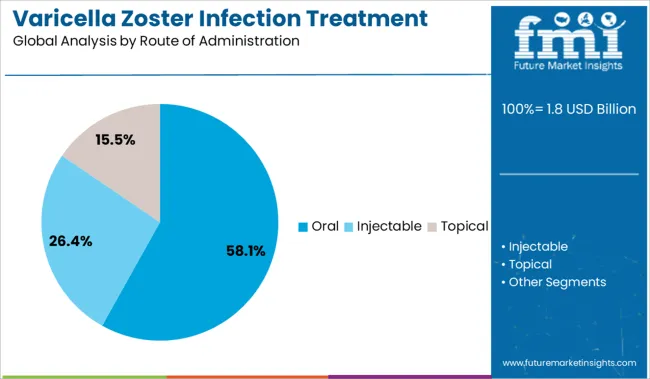
The Oral route for drug administration dominates the varicella zoster infection treatment market, with a 64.3% of the revenue share in 2021. This trend is expected to continue to grow during the study period. The high share of this segment is been attributed to its inherited safety, higher absorption and increased usage in the procedures and related treatment.
Which Distribution Channel is leading the Global Varicella Zoster Infection Treatment Market?
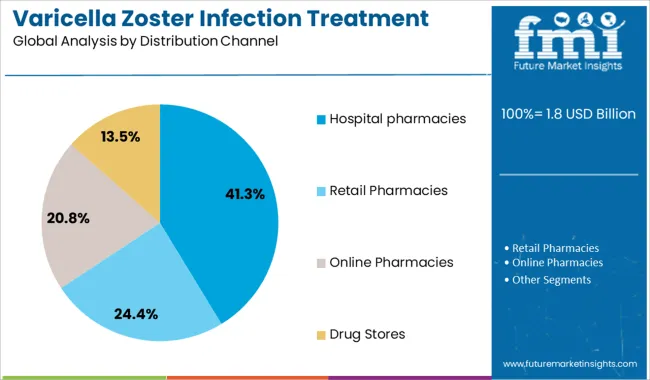
Based on the distribution channel, hospital pharmacies is the leading segment, with 43% market share in 2021 and expanding at a CAGR of 3.9% in the forecast period. Growing number of herpes zoster treatments in the hospitals and availability of medicines in the hospital pharmacies, as these medicines can only be bought if prescribed by a doctor or medical practitioner, will provide lucrative opportunities for varicella zoster infection treatment market growth.
Competitive Landscape
The key companies are focusing on regulatory approvals, new drug launches and marketing of their brands to get more attention and gain maximum market share. Additionally, acquisitions, mergers and strategic collaborations play a vital role in the growth of the varicella zoster infection treatment market.
- For Instance: In April 2017, Mylan Inc. announced that its subsidiary Mylan Pharmaceuticals has received final approval from the U.S. FDA for Acyclovir Ointment USP, 5% is the first generic version of Valeant International's Zovirax Ointment
- In December 2016, Slayback and Sandoz signed an agreement for the sale and marketing rights of Slayback Generic Zovirax Ointment (Acyclovir Ointment). Due to the agreement, Novartis got the sale and marketing rights, which augmented their position in the market.
In Dec 2015, Valeant Pharmaceuticals International, Inc. announced new fulfillment agreements with Walgreens. Due to these agreements, the company forayed into retail business pharmacies
Scope of the Report
Attribute |
Details |
Forecast Period |
2022-2028 |
Historical Data Available for |
2012-2021 |
Market Analysis |
USD Million for Value, Units for Volume |
Key Countries Covered |
US, Canada, Brazil, Mexico, Argentina, Germany, U.K., France, Italy, Spain, Benelux, Russia, China, Japan, India, ASEAN, Australia, New Zealand, and GCC Countries |
Key Segments Covered |
Drug Type, Route of Administration, Distribution Channel, and Region |
Key Companies Profiled |
|
Report Coverage |
Market Forecast, Competition Intelligence, DROT Analysis, Market Dynamics and Challenges, Strategic Growth Initiatives |
Customization & Pricing |
Available upon Request |
Varicella Zoster Infection Treatment - Market Segmentation - by Category
By Drug Type:
- Acyclovir
- Valacyclovir
- Famciclovir
By Route of Administration:
- Oral
- Injectable
- Topical
By Distribution Channel:
- Hospital pharmacies
- Retail Pharmacies
- Online Pharmacies
- Drug Stores
Region:
- North America
- Latin America
- Western Europe
- Eastern Europe
- APECJ
- China
- Japan
- Middle East Africa
Frequently Asked Questions
The varicella zoster infection treatment based market is worth at US$ 1.54 Bn in the year 2021 and is been expected to reach US$ 2.04 Bn by 2028
Acyclovir drug is been projected to reflect high demand in the forecast period with a CAGR of 3.7%.
Increasing cases of herpes zoster in developed and developing countries, growing focus on clinical development of antiviral drugs, concerting efforts in mitigating the economic burden of varicella zoster virus Infection and growing adoption of effective anti-viral drug treatment are some of the trends that will fuel the demand for Varicella zoster.
The cumulative market share of the top countries constitutes nearly 52.3% of the overall global market share.
U.S., China, Japan, Germany, and UK are the top 5 countries which are driving the demand for Varicella zoster.
Western Europe’s market is forecasted to grow at a CAGR of 3.6% between 2022- 2028. Germany being dominant country in term of revenue in European market of varicella zoster.
The APECJ market is set to exhibit a market share of over 11.0% of the global market value during the forecast period.
Novartis AG, Pfizer Inc., Abbott Laboratories, Sun Pharmaceuticals Industries Ltd are the key producers in this market.
Table of Content
1. Executive Summary
1.1. Market Overview
1.2. Market Analysis
1.3. Wheel of Fortune
2. Market Introduction
2.1. Market Definition
2.2. Market Taxonomy
3. Varicella Zoster Infection Treatment Market Opportunity Analysis
3.1. Macro-Economic Factors
3.2. Opportunity Analysis
4. Market Background
4.1. Market Dynamics
4.1.1. Drivers
4.1.2. Restraints
5. Global Economic Outlook
5.1. Disease Outlook
6. Key Inclusions
6.1. Key Manufacture List
6.2. Prescription Pattern
7. North America Varicella Zoster Infection Treatment Market Analysis 2012-2021 and Forecast 2022-2028
7.1. Introduction
7.2. Regional Market Trends
7.3. Regional Scenario
7.4. Historical Market Size (US$ Mn) Analysis By Country, 2012-2021
7.4.1. U.S.
7.4.2. Canada
7.5. Market Size (US$ Mn) Forecast By Country, 2022-2028
7.6. Historical Market Size (US$ Mn) Analysis By Drug Type, 2012-2021
7.6.1. Acyclovir
7.6.2. Valacyclovir
7.6.3. Famciclovir
7.7. Market Size (US$ Mn) Forecast By Drug Type, 2022-2028
7.8. Historical Market Size (US$ Mn) Analysis By Route of Administration, 2012-2021
7.8.1. Oral
7.8.2. Topical
7.8.3. Injectable
7.9. Market Size (US$ Mn) Forecast By Route of Administration, 2022-2028
7.10. Historical Market Size (US$ Mn) and Volume Trend Analysis By Distribution Channel, 2012-2021
7.10.1. Hospital Pharmacies
7.10.2. Retail Pharmacies
7.10.3. Online Pharmacies
7.10.4. Drug Stores
7.11. Market Size (US$ Mn) and Volume Forecast By Distribution Channel, 2022-2028
7.12. Market Attractiveness Analysis
7.12.1. By Country
7.12.2. By Drug Type
7.12.3. By Route of Administration
7.12.4. By Distribution Channel
7.13. Key Market Participants – Intensity Mapping
8. Latin America Varicella Zoster Infection Treatment Market Analysis 2012-2021 and Forecast 2022-2028
8.1. Introduction
8.2. Regional Market Trends
8.3. Regional Scenario
8.4. Historical Market Size (US$ Mn) Analysis By Country, 2012-2021
8.4.1. Brazil
8.4.2. Mexico
8.4.3. Rest of Latin America
8.5. Market Size (US$ Mn) Forecast By Country, 2022-2028
8.6. Historical Market Size (US$ Mn) Analysis By Drug Type, 2012-2021
8.6.1. Acyclovir
8.6.2. Valacyclovir
8.6.3. Famciclovir
8.7. Market Size (US$ Mn) Forecast By Drug Type, 2022-2028
8.8. Historical Market Size (US$ Mn) Analysis By Route of Administration, 2012-2021
8.8.1. Oral
8.8.2. Topical
8.8.3. Injectable
8.9. Market Size (US$ Mn) Forecast By Route of Administration, 2022-2028
8.10. Historical Market Size (US$ Mn) Analysis By Distribution Channel, 2012-2021
8.10.1. Hospital Pharmacies
8.10.2. Retail Pharmacies
8.10.3. Online Pharmacies
8.10.4. Drug Stores
8.11. Market Size (US$ Mn Forecast By Distribution Channel, 2022-2028
8.12. Market Attractiveness Analysis
8.12.1. By Country
8.12.2. By Drug Type
8.12.3. By Route of Administration
8.12.4. By Distribution Channel
8.13. Key Market Participants – Intensity Mapping
9. Western Europe Varicella Zoster Infection Treatment Market Analysis 2012-2021 and Forecast 2022-2028
9.1. Introduction
9.2. Regional Market Trends
9.3. Regional Scenario
9.4. Historical Market Size (US$ Mn) Analysis By Country, 2012-2021
9.4.1. Germany
9.4.2. U.K.
9.4.3. France
9.4.4. Italy
9.4.5. Spain
9.4.6. Rest of Western Europe
9.5. Market Size (US$ Mn) Forecast By Country, 2022-2028
9.6. Historical Market Size (US$ Mn) Analysis By Drug Type, 2012-2021
9.6.1. Acyclovir
9.6.2. Valacyclovir
9.6.3. Famciclovir
9.7. Market Size (US$ Mn) Forecast By Drug Type, 2022-2028
9.8. Historical Market Size (US$ Mn) Analysis By Route of Administration, 2012-2021
9.8.1. Oral
9.8.2. Topical
9.8.3. Injectable
9.9. Market Size (US$ Mn) Forecast By Route of Administration, 2022-2028
9.10. Historical Market Size (US$ Mn) Analysis By Distribution Channel, 2012-2021
9.10.1. Hospital Pharmacies
9.10.2. Retail Pharmacies
9.10.3. Online Pharmacies
9.10.4. Drug Stores
9.11. Market Size (US$ Mn) Forecast By Distribution Channel, 2022-2028
9.12. Market Attractiveness Analysis
9.12.1. By Country
9.12.2. By Drug Type
9.12.3. By Route of Administration
9.12.4. By Distribution Channel
9.13. Key Market Participants – Intensity Mapping
10. Eastern Europe Varicella Zoster Infection Treatment Market Analysis 2012-2021 and Forecast 2022-2028
10.1. Introduction
10.2. Regional Market Trends
10.3. Regional Scenario
10.4. Historical Market Size (US$ Mn) Analysis By Country, 2012-2021
10.4.1. Russia
10.4.2. Poland
10.4.3. Rest of Eastern
10.5. Market Size (US$ Mn) Forecast By Country, 2022-2028
10.6. Historical Market Size (US$ Mn) Analysis By Drug Type, 2012-2021
10.6.1. Acyclovir
10.6.2. Valacyclovir
10.6.3. Famciclovir
10.7. Market Size (US$ Mn) Forecast By Drug Type, 2022-2028
10.8. Historical Market Size (US$ Mn) Analysis By Route of Administration, 2012-2021
10.8.1. Oral
10.8.2. Topical
10.8.3. Injectable
10.9. Market Size (US$ Mn) Forecast By Route of Administration, 2022-2028
10.10. Historical Market Size (US$ Mn) Analysis By Distribution Channel, 2012-2021
10.10.1. Hospital Pharmacies
10.10.2. Retail Pharmacies
10.10.3. Online Pharmacies
10.10.4. Drug Stores
10.11. Market Size (US$ Mn) Forecast By Distribution Channel, 2022-2028
10.12. Market Attractiveness Analysis
10.12.1. By Country
10.12.2. By Drug Type
10.12.3. By Route of Administration
10.12.4. By Distribution Channel
10.13. Key Market Participants – Intensity Mapping
11. Asia Pacific Excluding China & Japan Varicella Zoster Infection Treatment Market Analysis 2012-2021 and Forecast 2022-2028
11.1. Introduction
11.2. Regional Scenario
11.3. Regional Market Trends
11.4. Historical Market Size (US$ Mn) Trend Analysis By Country, 2012-2021
11.4.1. India
11.4.2. Australia and New Zealand
11.4.3. ASEAN
11.4.4. Rest of APECJ
11.5. Market Size (US$ Mn) Forecast By Country, 2022-2028
11.6. Historical Market Size (US$ Mn) Analysis By Drug Type, 2012-2021
11.6.1. Acyclovir
11.6.2. Valacyclovir
11.6.3. Famciclovir
11.7. Market Size (US$ Mn) Forecast By Drug Type, 2022-2028
11.8. Historical Market Size (US$ Mn) Analysis By Route of Administration, 2012-2021
11.8.1. Oral
11.8.2. Topical
11.8.3. Injectable
11.9. Market Size (US$ Mn) Forecast By Route of Administration, 2022-2028
11.10. Historical Market Size (US$ Mn) Analysis By Distribution Channel, 2012-2021
11.10.1. Hospital Pharmacies
11.10.2. Retail Pharmacies
11.10.3. Online Pharmacies
11.10.4. Drug Stores
11.11. Market Size (US$ Mn) Forecast By Distribution Channel, 2022-2028
11.12. Market Attractiveness Analysis
11.12.1. By Country
11.12.2. By Drug Type
11.12.3. By Route of Administration
11.12.4. By Distribution Channel
11.13. Key Market Participants – Intensity Mapping
12. China Varicella Zoster Infection Treatment Market Analysis 2012-2021 and Forecast 2022-2028
12.1. Introduction
12.2. Key Regulations
12.3. Regional Market Trends
12.4. Historical Market Size (US$ Mn) Analysis By Drug Type, 2012-2021
12.4.1. Acyclovir
12.4.2. Valacyclovir
12.4.3. Famciclovir
12.5. Market Size (US$ Mn) Forecast By Drug Type, 2022-2028
12.6. Historical Market Size (US$ Mn) Analysis By Route of Administration, 2012-2021
12.6.1. Oral
12.6.2. Topical
12.6.3. Injectable
12.7. Market Size (US$ Mn) Forecast By Route of Administration, 2022-2028
12.8. Historical Market Size (US$ Mn) Analysis By Distribution Channel, 2012-2021
12.8.1. Hospital Pharmacies
12.8.2. Retail Pharmacies
12.8.3. Online Pharmacies
12.8.4. Drug Stores
12.9. Market Size (US$ Mn) Forecast By Distribution Channel, 2022-2028
12.10. Market Attractiveness Analysis
12.10.1. By Country
12.10.2. By Drug Type
12.10.3. By Route of Administration
12.10.4. By Distribution Channel
12.11. Key Market Participants – Intensity Mapping
13. Japan Varicella Zoster Infection Treatment Market Analysis 2012-2021 and Forecast 2022-2028
13.1. Introduction
13.2. Key Regulations
13.3. Regional Market Trends
13.4. Historical Market Size (US$ Mn) Analysis By Drug Type, 2012-2021
13.4.1. Acyclovir
13.4.2. Valacyclovir
13.4.3. Famciclovir
13.5. Market Size (US$ Mn) Forecast By Drug Type, 2022-2028
13.6. Historical Market Size (US$ Mn) Analysis By Route of Administration, 2012-2021
13.6.1. Oral
13.6.2. Topical
13.6.3. Injectable
13.7. Market Size (US$ Mn) Forecast By Route of Administration, 2022-2028
13.8. Historical Market Size (US$ Mn) Analysis By Distribution Channel, 2012-2021
13.8.1. Hospital Pharmacies
13.8.2. Retail Pharmacies
13.8.3. Online Pharmacies
13.8.4. Drug Stores
13.9. Market Size (US$ Mn) Forecast By Distribution Channel, 2022-2028
13.10. Market Attractiveness Analysis
13.10.1. By Country
13.10.2. By Drug Type
13.10.3. By Route of Administration
13.10.4. By Distribution Channel
13.11. Key Market Participants – Intensity Mapping
14. Middle East & Africa Varicella Zoster Infection Treatment Market Analysis 2012-2021 and Forecast 2022-2028
14.1. Introduction
14.2. Regional Scenario
14.3. Regional Market Trends
14.4. Historical Market Size (US$ Mn) Analysis By Country, 2012-2021
14.4.1. GCC Countries
14.4.2. North Africa
14.4.3. South Africa
14.4.4. Rest of MEA
14.5. Market Size (US$ Mn) Forecast By Country, 2022-2028
14.6. Historical Market Size (US$ Mn) Analysis By Drug Type, 2012-2021
14.6.1. Acyclovir
14.6.2. Valacyclovir
14.6.3. Famciclovir
14.7. Market Size (US$ Mn) Forecast By Drug Type, 2022-2028
14.8. Historical Market Size (US$ Mn) Analysis By Route of Administration, 2012-2021
14.8.1. Oral
14.8.2. Topical
14.8.3. Injectable
14.9. Market Size (US$ Mn) Forecast By Route of Administration, 2022-2028
14.10. Historical Market Size (US$ Mn) Analysis By Distribution Channel, 2012-2021
14.10.1. Hospital Pharmacies
14.10.2. Retail Pharmacies
14.10.3. Online Pharmacies
14.10.4. Drug Stores
14.11. Market Size (US$ Mn) By Distribution Channel, 2022-2028
14.12. Market Attractiveness Analysis
14.12.1. By Country
14.12.2. By Drug Type
14.12.3. By Route of Administration
14.12.4. By Distribution Channel
14.13. Key Market Participants – Intensity Mapping
15. Forecast Factors: Relevance and Impact
16. Forecast Assumptions
17. Competition Analysis
17.1. Competition Dashboard
17.2. Company Profiles (Details – Overview, Financials, Strategy, Recent Developments)
17.2.1. Teva Pharmaceutical Industries Ltd.
17.2.2. Abbott Laboratories
17.2.3. Sun Pharmaceuticals Industries Ltd.
17.2.4. Mylan N.V.
17.2.5. Pfizer Inc.
17.2.6. GlaxoSmithKline plc.
17.2.7. Dr. Reddy’s Laboratories, ltd.
17.2.8. Novartis AG
17.2.9. Valeant Pharmaceuticals International Inc.
18. Global Varicella Zoster Infection Treatment Market Analysis 2012-2021 and Forecast 2022-2028, By Region
18.1. Introduction/Key Findings
18.2. Historical Market Size (US$ Mn) Analysis By Region, 2012-2021
18.3. Market Size (US$ Mn) Forecast By Region, 2022-2028
18.3.1. North America
18.3.2. Latin America
18.3.3. Western Europe
18.3.4. Eastern Europe
18.3.5. Asia Pacific Excluding China & Japan
18.3.6. China
18.3.7. Japan
18.3.8. Middle East & Africa
18.4. Market Attractiveness Analysis By Region
19. Global Varicella Zoster Infection Treatment Analysis 2012-2021 and Forecast 2022-2028, By Drug Type
19.1. Introduction/Key Findings
19.2. Historical Market Size (US$ Mn) Analysis By Drug Type, 2012-2021
19.2.1. Acyclovir
19.2.2. Valacyclovir
19.2.3. Famciclovir
19.3. Market Size (US$ Mn) Forecast By Drug Type, 2022-2028
19.4. Market Attractiveness Analysis By Drug Type
20. Global Varicella Zoster Infection Treatment Market Analysis 2012-2021 and Forecast 2022-2028, By Route of Administration
20.1. Introduction/Key Findings
20.2. Historical Market Size (US$ Mn) Analysis By Route of Administration, 2012-2021
20.2.1. Oral
20.2.2. Topical
20.2.3. Injectable
20.3. Market Size (US$ Mn) Forecast By Route of Administration, 2022-2028
20.4. Market Attractiveness Analysis By Route of Administration
21. Global Varicella Zoster Infection Treatment Market Analysis 2012-2021 and Forecast 2022-2028, By Distribution Channel
21.1. Introduction/Key Findings
21.2. Historical Market Size (US$ Mn) Analysis By Distribution Channel, 2012-2021
21.2.1. Hospital Pharmacies
21.2.2. Retail Pharmacies
21.2.3. Online Pharmacies
21.2.4. Drug Stores
21.3. Market Size (US$ Mn) By Distribution Channel, 2022-2028
21.4. Market Attractiveness Analysis By Distribution Channel
22. Global Varicella Zoster Infection Treatment Market Analysis 2012-2021 and Forecast 2022-2028
22.1. Market Value Share Analysis By All Segment
22.2. Y-o-Y Growth Analysis By All Segment
22.3. Absolute $ Opportunity
23. Assumptions and Acronyms Used
24. Research Methodology
Let us know your requirement to get
100% FREE customization
List of Tables
Table 01: North America Varicella Zoster Infection Treatment Market size (US$ Mn) Analysis-2012-2021 and Forecast 2022-2028, By Country
Table 02: North America Varicella Zoster Infection Treatment Market size (US$ Mn) Analysis-2012-2021 and Forecast 2022-2028, By Drug Type
Table 03: North America Varicella Zoster Infection Treatment Market size (US$ Mn) Analysis-2012-2021 and Forecast 2022-2028, By Route of Administration
Table 04: North America Varicella Zoster Infection Treatment Market size (US$ Mn) Analysis-2012-2021 and Forecast 2022-2028, By Distribution Channel
Table 05: North America Varicella Zoster Infection Treatment Market Participants Presence (Intensity Mapping)
Table 06: Latin America Varicella Zoster Infection Treatment Market size (US$ Mn) Analysis-2012-2021 and Forecast 2022-2028, By Country
Table 07: Latin America Varicella Zoster Infection Treatment Market size (US$ Mn) Analysis-2012-2021 and Forecast 2022-2028, By Drug Type
Table 08: Latin America Varicella Zoster Infection Treatment Market size (US$ Mn) Analysis-2012-2021 and Forecast 2022-2028, By Route of Administration
Table 09: Latin America Varicella Zoster Infection Treatment Market size (US$ Mn) Analysis-2012-2021 and Forecast 2022-2028, By Distribution Channel
Table 10: Latin America Varicella Zoster Infection Treatment Market Participants Presence (Intensity Mapping)
Table 11: Western Europe Varicella Zoster Infection Treatment Market size (US$ Mn) Analysis-2012-2021 and Forecast 2022-2028, By Country
Table 12: Western Europe Varicella Zoster Infection Treatment Market size (US$ Mn) Analysis-2012-2021 and Forecast 2022-2028, By Drug Type
Table 13: Western Europe Varicella Zoster Infection Treatment Market size (US$ Mn) Analysis-2012-2021 and Forecast 2022-2028, By Route of Administration
Table 14: Western Europe Varicella Zoster Infection Treatment Market size (US$ Mn) Analysis-2012-2021 and Forecast 2022-2028, By Distribution Channel
Table 15: Western Europe Varicella Zoster Infection Treatment Market Participants Presence (Intensity Mapping)
Table 16: Eastern Europe Varicella Zoster Infection Treatment Market size (US$ Mn) Analysis-2012-2021 and Forecast 2022-2028, By Country
Table 17: Eastern Europe Varicella Zoster Infection Treatment Market size (US$ Mn) Analysis-2012-2021 and Forecast 2022-2028, By Drug Type
Table 18: Eastern Europe Varicella Zoster Infection Treatment Market Size (US$ Mn) Analysis-2012-2021 and Forecast 2022-2028, By Route of Administration
Table 19: Eastern Europe Varicella Zoster Infection Treatment Market size (US$ Mn) Analysis-2012-2021 and Forecast 2022-2028, By Distribution Channel
Table 20: Eastern Europe Varicella Zoster Infection Treatment Market Participants Presence (Intensity Mapping)
Table 21: APECJ Varicella Zoster Infection Treatment Market size (US$ Mn) Analysis-2012-2021 and Forecast 2022-2028, By Country
Table 22: APECJ Varicella Zoster Infection Treatment Market size (US$ Mn) Analysis-2012-2021 and Forecast 2022-2028, By Drug Type
Table 23: APECJ Varicella Zoster Infection Treatment Market size (US$ Mn) Analysis-2012-2021 and Forecast 2022-2028, By Route of Administration
Table 24: APECJ Varicella Zoster Infection Treatment Market size (US$ Mn) Analysis-2012-2021 and Forecast 2022-2028, By Distribution Channel
Table 25: APECJ Varicella Zoster Infection Treatment Market Participants Presence (Intensity Mapping)
Table 26: China Varicella Zoster Infection Treatment Market size (US$ Mn) Analysis-2012-2021 and Forecast 2022-2028, By Drug Type
Table 27: China Varicella Zoster Infection Treatment Market Size (US$ Mn) Analysis-2012-2021 and Forecast 2022-2028, By Route of Administration
Table 28: China Varicella Zoster Infection Treatment Market size (US$ Mn) Analysis-2012-2021 and Forecast 2022-2028, By Distribution Channel
Table 29: China Varicella Zoster Infection Treatment Market Participants Presence (Intensity Mapping)
Table 30: Japan Varicella Zoster Infection Treatment Market size (US$ Mn) Analysis-2012-2021 and Forecast 2022-2028, By Drug Type
Table 31: Japan Varicella Zoster Infection Treatment Market Size (US$ Mn) Analysis-2012-2021 and Forecast 2022-2028, By Route of Administration
Table 32: Japan Varicella Zoster Infection Treatment Market size (US$ Mn) Analysis-2012-2021 and Forecast 2022-2028, By Distribution Channel
Table 33: Japan Varicella Zoster Infection Treatment Market Participants Presence (Intensity Mapping)
Table 34: MEA Varicella Zoster Infection Treatment Market size (US$ Mn) Analysis-2012-2021 and Forecast 2022-2028, By Country
Table 35: MEA Varicella Zoster Infection Treatment Market size (US$ Mn) Analysis-2012-2021 and Forecast 2022-2028, By Drug Type
Table 36: MEA Varicella Zoster Infection Treatment Market size (US$ Mn) Analysis-2012-2021 and Forecast 2022-2028, By Route of Administration
Table 37: MEA Varicella Zoster Infection Treatment Market size (US$ Mn) Analysis-2012-2021 and Forecast 2022-2028, By Distribution Channel
Table 38: MEA Varicella Zoster Infection Treatment Market Participants Presence (Intensity Mapping)
Table 39: Global Varicella Zoster Infection Treatment Market Size (US$ Mn) Forecast By Region, 2022-2028
Table 40: Global Varicella Zoster Infection Treatment Market size Value (US$ Mn) Analysis 2012-2021 and Forecast 2022-2028, By Drug Type
Table 41: Global Varicella Zoster Infection Treatment Market size (US$ Mn) Analysis 2012-2021 and Forecast 2022-2028, By Route of Administration
Table 42: Global Varicella Zoster Infection Treatment Market size (US$ Mn) Analysis 2012-2021 and Forecast 2022-2028, By Distribution Channel
Find your sweet spots for generating winning opportunities in this market.
Talk to AnalystList of Charts
Figure 01: Global Varicella Zoster Infection Treatment Market Value Share By Drug Type 2021 (A)
Figure 02: Global Varicella Zoster Infection Treatment Market Value Share By Route of Administration 2021 (A)
Figure 03: Global Varicella Zoster Infection Treatment Market Value Share By Distribution Channel 2021 (A)
Figure 04: Varicella Zoster Infection Treatment Market Split By Drug Type (2021)
Figure 05: Varicella Zoster Infection Treatment Market Split By Route of Administration (2021)
Figure 06: Varicella Zoster Infection Treatment Market Split By Distribution Channel (2021)
Figure 07: Varicella Zoster Infection Treatment Market Split By Country (2021)
Figure 08: North America Varicella Zoster Infection Treatment Market Size Analysis, 2012-2021
Figure 09: North America Varicella Zoster Infection Treatment Market Forecast & Y-o-Y growth, 2022-2028
Figure 10: U.S. Varicella Zoster Infection Treatment Market Size (US$ Mn) Analysis, 2012-2021
Figure 11: U.S. Varicella Zoster Infection Treatment Market Forecast & Y-o-Y Growth (%), 2022-2028
Figure 12: Canada Varicella Zoster Infection Treatment Market Size (US$ Mn) Analysis, 2012-2021
Figure 13: Canada Varicella Zoster Infection Treatment Market Forecast & Y-o-Y Growth (%), 2022-2028
Figure 14: Acyclovir Varicella Zoster Infection Treatment Market Size (US$ Mn) Analysis, 2012-2021
Figure 15: Acyclovir Varicella Zoster Infection Treatment Market Forecast & Y-o-Y Growth (%), 2022-2028
Figure 16: Valacyclovir Varicella Zoster Infection Treatment Market Size (US$ Mn) Analysis, 2012-2021
Figure 17: Valacyclovir Varicella Zoster Infection Treatment Market Forecast & Y-o-Y Growth (%), 2022-2028
Figure 18: Famciclovir Varicella Zoster Infection Treatment Market Size (US$ Mn) Analysis, 2012-2021
Figure 19: Famciclovir Varicella Zoster Infection Treatment Market Forecast & Y-o-Y Growth (%), 2022-2028
Figure 20: Oral Varicella Zoster Infection Treatment Market Size (US$ Mn) Analysis, 2012-2021
Figure 21: Oral Varicella Zoster Infection Treatment Market Forecast & Y-o-Y Growth (%), 2022-2028
Figure 22: Injectable Varicella Zoster Infection Treatment Market Size (US$ Mn) Analysis, 2012-2021
Figure 23: Injectable Varicella Zoster Infection Treatment Market Forecast & Y-o-Y Growth (%), 2022-2028
Figure 24: Topical Varicella Zoster Infection Treatment Market Size (US$ Mn) Analysis, 2012-2021
Figure 25: Topical Varicella Zoster Infection Treatment Market Forecast & Y-o-Y Growth (%), 2022-2028
Figure 26: Hospital Pharmacies Varicella Zoster Infection Treatment Market Size (US$ Mn) Analysis, 2012-2021
Figure 27: Hospital Pharmacies Varicella Zoster Infection Treatment Market Forecast & Y-o-Y Growth (%), 2022-2028
Figure 28: Retail Pharmacies Varicella Zoster Infection Treatment Market Size (US$ Mn) Analysis, 2012-2021
Figure 29: Retail Pharmacies Varicella Zoster Infection Treatment Market Forecast & Y-o-Y Growth (%), 2022-2028
Figure 30: Online Pharmacies Varicella Zoster Infection Treatment Market Size (US$ Mn) Analysis, 2012-2021
Figure 31: Online Pharmacies Varicella Zoster Infection Treatment Market Forecast & Y-o-Y Growth (%), 2022-2028
Figure 32: Drug Stores Varicella Zoster Infection Treatment Market Size (US$ Mn) Analysis, 2012-2021
Figure 33: Drug Stores Varicella Zoster Infection Treatment Market Forecast & Y-o-Y Growth (%), 2022-2028
Figure 34: North America Varicella Zoster Infection Treatment Market Attractiveness Analysis By Drug Type, 2022-2028
Figure 35: North America Varicella Zoster Infection Treatment Market Attractiveness Analysis By Route of Administration, 2022-2028
Figure 36: North America Varicella Zoster Infection Treatment Market Attractiveness Analysis By Distribution Channel, 2022-2028
Figure 37: North America Varicella Zoster Infection Treatment Market Attractiveness Analysis By Country, 2022-2028
Figure 38: Varicella Zoster Infection Treatment Market Split By Drug Type (2021)
Figure 39: Varicella Zoster Infection Treatment Market Split By Route of Administration (2021)
Figure 40: Varicella Zoster Infection Treatment Market Split By Distribution Channel (2021)
Figure 41: Varicella Zoster Infection Treatment Market Split By Country (2021)
Figure 42: Latin America Varicella Zoster Infection Treatment Market Size Analysis, 2012-2021
Figure 43: Latin America Varicella Zoster Infection Treatment Market Forecast & Y-o-Y growth, 2022-2028
Figure 44: Brazil Varicella Zoster Infection Treatment Market Size (US$ Mn) Analysis, 2012-2021
Figure 45: Brazil Varicella Zoster Infection Treatment Market Forecast & Y-o-Y Growth (%), 2022-2028
Figure 46: Mexico Varicella Zoster Infection Treatment Market Size (US$ Mn) Analysis, 2012-2021
Figure 47: Mexico Varicella Zoster Infection Treatment Market Forecast & Y-o-Y Growth (%), 2022-2028
Figure 48: Rest of Latin America Varicella Zoster Infection Treatment Market Size (US$ Mn) Analysis, 2012-2021
Figure 49: Rest of Latin America Varicella Zoster Infection Treatment Market Forecast & Y-o-Y Growth (%), 2022-2028
Figure 50: Acyclovir Varicella Zoster Infection Treatment Market Size (US$ Mn) Analysis, 2012-2021
Figure 51: Acyclovir Varicella Zoster Infection Treatment Market Forecast & Y-o-Y Growth (%), 2022-2028
Figure 52: Valacyclovir Varicella Zoster Infection Treatment Market Size (US$ Mn) Analysis, 2012-2021
Figure 53: Valacyclovir Varicella Zoster Infection Treatment Market Forecast & Y-o-Y Growth (%), 2022-2028
Figure 54: Famciclovir Varicella Zoster Infection Treatment Market Size (US$ Mn) Analysis, 2012-2021
Figure 55: Famciclovir Varicella Zoster Infection Treatment Market Forecast & Y-o-Y Growth (%), 2022-2028
Figure 56: Oral Varicella Zoster Infection Treatment Market Size (US$ Mn) Analysis, 2012-2021
Figure 57: Oral Varicella Zoster Infection Treatment Market Forecast & Y-o-Y Growth (%), 2022-2028
Figure 58: Injectable Varicella Zoster Infection Treatment Market Size (US$ Mn) Analysis, 2012-2021
Figure 59: Injectable Varicella Zoster Infection Treatment Market Forecast & Y-o-Y Growth (%), 2022-2028
Figure 60: Topical Varicella Zoster Infection Treatment Market Size (US$ Mn) Analysis, 2012-2021
Figure 61: Topical Varicella Zoster Infection Treatment Market Forecast & Y-o-Y Growth (%), 2022-2028
Figure 62: Hospital Pharmacies Varicella Zoster Infection Treatment Market Size (US$ Mn) Analysis, 2012-2021
Figure 63: Hospital Pharmacies Varicella Zoster Infection Treatment Market Forecast & Y-o-Y Growth (%), 2022-2028
Figure 64: Retail Pharmacies Varicella Zoster Infection Treatment Market Size (US$ Mn) Analysis, 2012-2021
Figure 65: Retail Pharmacies Varicella Zoster Infection Treatment Market Forecast & Y-o-Y Growth (%), 2022-2028
Figure 66: Online Pharmacies Varicella Zoster Infection Treatment Market Size (US$ Mn) Analysis, 2012-2021
Figure 67: Online Pharmacies Varicella Zoster Infection Treatment Market Forecast & Y-o-Y Growth (%), 2022-2028
Figure 68: Drug Stores Varicella Zoster Infection Treatment Market Size (US$ Mn) Analysis, 2012-2021
Figure 69: Drug Stores Varicella Zoster Infection Treatment Market Forecast & Y-o-Y Growth (%), 2022-2028
Figure 70: Latin America Varicella Zoster Infection Treatment Market Attractiveness Analysis By Drug Type, 2022-2028
Figure 71: Latin America Varicella Zoster Infection Treatment Market Attractiveness Analysis By Route of Administration, 2022-2028
Figure 72: Latin America Varicella Zoster Infection Treatment Market Attractiveness Analysis By Distribution Channel, 2022-2028
Figure 73: Latin America Varicella Zoster Infection Treatment Market Attractiveness Analysis By Country, 2022-2028
Figure 74: Varicella Zoster Infection Treatment Market Split By Drug Type (2021)
Figure 75: Varicella Zoster Infection Treatment Market Split By Route of Administration (2021)
Figure 76: Varicella Zoster Infection Treatment Market Split By Distribution Channel (2021)
Figure 77: Varicella Zoster Infection Treatment Market Split By Country (2021)
Figure 78: Western Europe Varicella Zoster Infection Treatment Market Size Analysis, 2012-2021
Figure 79: Western Europe Varicella Zoster Infection Treatment Market Forecast & Y-o-Y growth, 2022-2028
Figure 80: Germany Varicella Zoster Infection Treatment Market Size (US$ Mn) Analysis, 2012-2021
Figure 81: Germany Varicella Zoster Infection Treatment Market Forecast & Y-o-Y Growth (%), 2022-2028
Figure 82: U.K. Varicella Zoster Infection Treatment Market Size (US$ Mn) Analysis, 2012-2021
Figure 83: U.K. Varicella Zoster Infection Treatment Market Forecast & Y-o-Y Growth (%), 2022-2028
Figure 84: France Varicella Zoster Infection Treatment Market Size (US$ Mn) Analysis, 2012-2021
Figure 85: France Varicella Zoster Infection Treatment Market Forecast & Y-o-Y Growth (%), 2022-2028
Figure 86: Italy Varicella Zoster Infection Treatment Market Size (US$ Mn) Analysis, 2012-2021
Figure 87: Italy Varicella Zoster Infection Treatment Market Forecast & Y-o-Y Growth (%), 2022-2028
Figure 88: Spain Varicella Zoster Infection Treatment Market Size (US$ Mn) Analysis, 2012-2021
Figure 89: Spain Varicella Zoster Infection Treatment Market Forecast & Y-o-Y Growth (%), 2022-2028
Figure 90: Rest of Western Europe Varicella Zoster Infection Treatment Market Size (US$ Mn) Analysis, 2012-2021
Figure 91: Rest of Western Europe Varicella Zoster Infection Treatment Market Forecast & Y-o-Y Growth (%), 2022-2028
Figure 92: Acyclovir Varicella Zoster Infection Treatment Market Size (US$ Mn) Analysis, 2012-2021
Figure 93: Acyclovir Varicella Zoster Infection Treatment Market Forecast & Y-o-Y Growth (%), 2022-2028
Figure 94: Valacyclovir Varicella Zoster Infection Treatment Market Size (US$ Mn) Analysis, 2012-2021
Figure 95: Valacyclovir Varicella Zoster Infection Treatment Market Forecast & Y-o-Y Growth (%), 2022-2028
Figure 96: Famciclovir Varicella Zoster Infection Treatment Market Size (US$ Mn) Analysis, 2012-2021
Figure 97: Famciclovir Varicella Zoster Infection Treatment Market Forecast & Y-o-Y Growth (%), 2022-2028
Figure 98: Oral Varicella Zoster Infection Treatment Market Size (US$ Mn) Analysis, 2012-2021
Figure 99: Oral Varicella Zoster Infection Treatment Market Forecast & Y-o-Y Growth (%), 2022-2028
Figure 100: Injectable Varicella Zoster Infection Treatment Market Size (US$ Mn) Analysis, 2012-2021
Figure 101: Injectable Varicella Zoster Infection Treatment Market Forecast & Y-o-Y Growth (%), 2022-2028
Figure 102: Topical Varicella Zoster Infection Treatment Market Size (US$ Mn) Analysis, 2012-2021
Figure 103: Topical Varicella Zoster Infection Treatment Market Forecast & Y-o-Y Growth (%), 2022-2028
Figure 104: Hospital Pharmacies Varicella Zoster Infection Treatment Market Size (US$ Mn) Analysis, 2012-2021
Figure 105: Hospital Pharmacies Varicella Zoster Infection Treatment Market Forecast & Y-o-Y Growth (%), 2022-2028
Figure 106: Retail Pharmacies Varicella Zoster Infection Treatment Market Size (US$ Mn) Analysis, 2012-2021
Figure 107: Retail Pharmacies Varicella Zoster Infection Treatment Market Forecast & Y-o-Y Growth (%), 2022-2028
Figure 108: Online Pharmacies Varicella Zoster Infection Treatment Market Size (US$ Mn) Analysis, 2012-2021
Figure 109: Online Pharmacies Varicella Zoster Infection Treatment Market Forecast & Y-o-Y Growth (%), 2022-2028
Figure 110: Drug Stores Varicella Zoster Infection Treatment Market Size (US$ Mn) Analysis, 2012-2021
Figure 111: Drug Stores Varicella Zoster Infection Treatment Market Forecast & Y-o-Y Growth (%), 2022-2028
Figure 112: Western Europe Varicella Zoster Infection Treatment Market Attractiveness Analysis By Drug Type, 2022-2028
Figure 113: Western Europe Varicella Zoster Infection Treatment Market Attractiveness Analysis By Route of Administration, 2022-2028
Figure 114: Western Europe Varicella Zoster Infection Treatment Market Attractiveness Analysis By Distribution Channel, 2022-2028
Figure 115: Western Europe Varicella Zoster Infection Treatment Market Attractiveness Analysis By Country, 2022-2028
Figure 116: Varicella Zoster Infection Treatment Market Split By Drug Type (2021)
Figure 117: Varicella Zoster Infection Treatment Market Split By Route of Administration (2021)
Figure 118: Varicella Zoster Infection Treatment Market Split By Distribution Channel (2021)
Figure 119: Varicella Zoster Infection Treatment Market Split By Country (2021)
Figure 120: Eastern Europe Varicella Zoster Infection Treatment Market Size Analysis, 2012-2021
Figure 121: Eastern Europe Varicella Zoster Infection Treatment Market Forecast & Y-o-Y growth, 2022-2028
Figure 122: Russia Varicella Zoster Infection Treatment Market Size (US$ Mn) Analysis, 2012-2021
Figure 123: Russia Varicella Zoster Infection Treatment Market Forecast & Y-o-Y Growth (%), 2022-2028
Figure 124: Poland Varicella Zoster Infection Treatment Market Size (US$ Mn) Analysis, 2012-2021
Figure 125: Poland Varicella Zoster Infection Treatment Market Forecast & Y-o-Y Growth (%), 2022-2028
Figure 126: Rest of Eastern Europe Varicella Zoster Infection Treatment Market Size (US$ Mn) Analysis, 2012-2021
Figure 127: Rest of Eastern Europe Varicella Zoster Infection Treatment Market Forecast & Y-o-Y Growth (%), 2022-2028
Figure 128: Acyclovir Varicella Zoster Infection Treatment Market Size (US$ Mn) Analysis, 2012-2021
Figure 129: Acyclovir Varicella Zoster Infection Treatment Market Forecast & Y-o-Y Growth (%), 2022-2028
Figure 130: Valacyclovir Varicella Zoster Infection Treatment Market Size (US$ Mn) Analysis, 2012-2021
Figure 131: Valacyclovir Varicella Zoster Infection Treatment Market Forecast & Y-o-Y Growth (%), 2022-2028
Figure 132: Famciclovir Varicella Zoster Infection Treatment Market Size (US$ Mn) Analysis, 2012-2021
Figure 133: Famciclovir Varicella Zoster Infection Treatment Market Forecast & Y-o-Y Growth (%), 2022-2028
Figure 134: Oral Varicella Zoster Infection Treatment Market Size (US$ Mn) Analysis, 2012-2021
Figure 135: Oral Varicella Zoster Infection Treatment Market Forecast & Y-o-Y Growth (%), 2022-2028
Figure 136: Injectable Varicella Zoster Infection Treatment Market Size (US$ Mn) Analysis, 2012-2021
Figure 137: Injectable Varicella Zoster Infection Treatment Market Forecast & Y-o-Y Growth (%), 2022-2028
Figure 138: Topical Varicella Zoster Infection Treatment Market Size (US$ Mn) Analysis, 2012-2021
Figure 139: Topical Varicella Zoster Infection Treatment Market Forecast & Y-o-Y Growth (%), 2022-2028
Figure 140: Hospital Pharmacies Varicella Zoster Infection Treatment Market Size (US$ Mn) Analysis, 2012-2021
Figure 141: Hospital Pharmacies Varicella Zoster Infection Treatment Market Forecast & Y-o-Y Growth (%), 2022-2028
Figure 142: Retail Pharmacies Varicella Zoster Infection Treatment Market Size (US$ Mn) Analysis, 2012-2021
Figure 143: Retail Pharmacies Varicella Zoster Infection Treatment Market Forecast & Y-o-Y Growth (%), 2022-2028
Figure 144: Online Pharmacies Varicella Zoster Infection Treatment Market Size (US$ Mn) Analysis, 2012-2021
Figure 145: Online Pharmacies Varicella Zoster Infection Treatment Market Forecast & Y-o-Y Growth (%), 2022-2028
Figure 146: Drug Stores Varicella Zoster Infection Treatment Market Size (US$ Mn) Analysis, 2012-2021
Figure 147: Drug Stores Varicella Zoster Infection Treatment Market Forecast & Y-o-Y Growth (%), 2022-2028
Figure 148: Eastern Europe Varicella Zoster Infection Treatment Market Attractiveness Analysis By Drug Type, 2022-2028
Figure 149: Eastern Europe Varicella Zoster Infection Treatment Market Attractiveness Analysis By Route of
Administration, 2022-2028
Figure 150: Eastern Europe Varicella Zoster Infection Treatment Market Attractiveness Analysis By Distribution Channel, 2022-2028
Figure 151: Eastern Europe Varicella Zoster Infection Treatment Market Attractiveness Analysis By Country, 2022-2028
Figure 152: Varicella Zoster Infection Treatment Market Split By Drug Type (2021)
Figure 153: Varicella Zoster Infection Treatment Market Split By Route of Administration (2021)
Figure 154: Varicella Zoster Infection Treatment Market Split By Distribution Channel (2021)
Figure 155: Varicella Zoster Infection Treatment Market Split By Country (2021)
Figure 156: APECJ Varicella Zoster Infection Treatment Market Size Analysis, 2012-2021
Figure 157: APECJ Varicella Zoster Infection Treatment Market Forecast & Y-o-Y growth, 2022-2028
Figure 158: India Varicella Zoster Infection Treatment Market Size (US$ Mn) Analysis, 2012-2021
Figure 159: India Varicella Zoster Infection Treatment Market Forecast & Y-o-Y Growth (%), 2022-2028
Figure 160: Australia & New Zealand Varicella Zoster Infection Treatment Market Size (US$ Mn) Analysis, 2012-2021
Figure 161: Australia & New Zealand Varicella Zoster Infection Treatment Market Forecast & Y-o-Y Growth (%), 2022-2028
Figure 162: ASEAN Varicella Zoster Infection Treatment Market Size (US$ Mn) Analysis, 2012-2021
Figure 163: ASEAN Varicella Zoster Infection Treatment Market Forecast & Y-o-Y Growth (%), 2022-2028
Figure 164: Rest of APEJ Varicella Zoster Infection Treatment Market Size (US$ Mn) Analysis, 2012-2021
Figure 165: Rest of APEJ Varicella Zoster Infection Treatment Market Forecast & Y-o-Y Growth (%), 2022-2028
Figure 166: Acyclovir Varicella Zoster Infection Treatment Market Size (US$ Mn) Analysis, 2012-2021
Figure 167: Acyclovir Varicella Zoster Infection Treatment Market Forecast & Y-o-Y Growth (%), 2022-2028
Figure 168: Valacyclovir Varicella Zoster Infection Treatment Market Size (US$ Mn) Analysis, 2012-2021
Figure 169: Valacyclovir Varicella Zoster Infection Treatment Market Forecast & Y-o-Y Growth (%), 2022-2028
Figure 170: Famciclovir Varicella Zoster Infection Treatment Market Size (US$ Mn) Analysis, 2012-2021
Figure 171: Famciclovir Varicella Zoster Infection Treatment Market Forecast & Y-o-Y Growth (%), 2022-2028
Figure 172: Oral Varicella Zoster Infection Treatment Market Size (US$ Mn) Analysis, 2012-2021
Figure 173: Oral Varicella Zoster Infection Treatment Market Forecast & Y-o-Y Growth (%), 2022-2028
Figure 174: Topical Varicella Zoster Infection Treatment Market Size (US$ Mn) Analysis, 2012-2021
Figure 175: Topical Varicella Zoster Infection Treatment Market Forecast & Y-o-Y Growth (%), 2022-2028
Figure 176: Injectable Varicella Zoster Infection Treatment Market Size (US$ Mn) Analysis, 2012-2021
Figure 177: Injectable Varicella Zoster Infection Treatment Market Forecast & Y-o-Y Growth (%), 2022-2028
Figure 178: Hospital Pharmacies Varicella Zoster Infection Treatment Market Size (US$ Mn) Analysis, 2012-2021
Figure 179: Hospital Pharmacies Varicella Zoster Infection Treatment Market Forecast & Y-o-Y Growth (%), 2022-2028
Figure 180: Retail Pharmacies Varicella Zoster Infection Treatment Market Size (US$ Mn) Analysis, 2012-2021
Figure 181: Retail Pharmacies Varicella Zoster Infection Treatment Market Forecast & Y-o-Y Growth (%), 2022-2028
Figure 182: Online Pharmacies Varicella Zoster Infection Treatment Market Size (US$ Mn) Analysis, 2012-2021
Figure 183: Online Pharmacies Varicella Zoster Infection Treatment Market Forecast & Y-o-Y Growth (%), 2022-2028
Figure 184: Drug Stores Varicella Zoster Infection Treatment Market Size (US$ Mn) Analysis, 2012-2021
Figure 185: Drug Stores Varicella Zoster Infection Treatment Market Forecast & Y-o-Y Growth (%), 2022-2028
Figure 186: APECJ Varicella Zoster Infection Treatment Market Attractiveness Analysis By Drug Type, 2022-2028
Figure 187: APECJ Varicella Zoster Infection Treatment Market Attractiveness Analysis By Route of Administration, 2022-2028
Figure 188: APECJ Varicella Zoster Infection Treatment Market Attractiveness Analysis By Distribution Channel, 2022-2028
Figure 189: APECJ Varicella Zoster Infection Treatment Market Attractiveness Analysis By Country, 2022-2028
Figure 190: Varicella Zoster Infection Treatment Market Split By Drug Type (2021)
Figure 191: Varicella Zoster Infection Treatment Market Split By Route of Administration (2021)
Figure 192: Varicella Zoster Infection Treatment Market Split By Distribution Channel (2021)
Figure 193: China Varicella Zoster Infection Treatment Market Size Analysis, 2012-2021
Figure 194: China Varicella Zoster Infection Treatment Market Forecast & Y-o-Y growth, 2022-2028
Figure 195: Acyclovir Varicella Zoster Infection Treatment Market Size (US$ Mn) Analysis, 2012-2021
Figure 196: Acyclovir Varicella Zoster Infection Treatment Market Forecast & Y-o-Y Growth (%), 2022-2028
Figure 197: Valacyclovir Varicella Zoster Infection Treatment Market Size (US$ Mn) Analysis, 2012-2021
Figure 198: Valacyclovir Varicella Zoster Infection Treatment Market Forecast & Y-o-Y Growth (%), 2022-2028
Figure 199: Famciclovir Varicella Zoster Infection Treatment Market Size (US$ Mn) Analysis, 2012-2021
Figure 200: Famciclovir Varicella Zoster Infection Treatment Market Forecast & Y-o-Y Growth (%), 2022-2028
Figure 201: Oral Varicella Zoster Infection Treatment Market Size (US$ Mn) Analysis, 2012-2021
Figure 202: Oral Varicella Zoster Infection Treatment Market Forecast & Y-o-Y Growth (%), 2022-2028
Figure 204: Injectable Varicella Zoster Infection Treatment Market Size (US$ Mn) Analysis, 2012-2021
Figure 205: Injectable Varicella Zoster Infection Treatment Market Forecast & Y-o-Y Growth (%), 2022-2028
Figure 206: Topical Varicella Zoster Infection Treatment Market Size (US$ Mn) Analysis, 2012-2021
Figure 207: Topical Varicella Zoster Infection Treatment Market Forecast & Y-o-Y Growth (%), 2022-2028
Figure 208: Hospital Pharmacies Varicella Zoster Infection Treatment Market Size (US$ Mn) Analysis, 2012-2021
Figure 209: Hospital Pharmacies Varicella Zoster Infection Treatment Market Forecast & Y-o-Y Growth (%), 2022-2028
Figure 210: Retail Pharmacies Varicella Zoster Infection Treatment Market Size (US$ Mn) Analysis, 2012-2021
Figure 211: Retail Pharmacies Varicella Zoster Infection Treatment Market Forecast & Y-o-Y Growth (%), 2022-2028
Figure 212: Online Pharmacies Varicella Zoster Infection Treatment Market Size (US$ Mn) Analysis, 2012-2021
Figure 213: Online Pharmacies Varicella Zoster Infection Treatment Market Forecast & Y-o-Y Growth (%), 2022-2028
Figure 214: Drug Stores Varicella Zoster Infection Treatment Market Size (US$ Mn) Analysis, 2012-2021
Figure 215: Drug Stores Varicella Zoster Infection Treatment Market Forecast & Y-o-Y Growth (%), 2022-2028
Figure 216: China Varicella Zoster Infection Treatment Market Attractiveness Analysis By Drug Type, 2022-2028
Figure 217: China Varicella Zoster Infection Treatment Market Attractiveness Analysis By Route of Administration, 2022-2028
Figure 218: China Varicella Zoster Infection Treatment Market Attractiveness Analysis By Distribution Channel,2022-2028
Figure 219: Varicella Zoster Infection Treatment Market Split By Drug Type (2021)
Figure 220: Varicella Zoster Infection Treatment Market Split By Route of Administration (2021)
Figure 221: Varicella Zoster Infection Treatment Market Split By Distribution Channel (2021)
Figure 222: Japan Varicella Zoster Infection Treatment Market Size Analysis, 2012-2021
Figure 223: Japan Varicella Zoster Infection Treatment Market Forecast & Y-o-Y growth, 2022-2028
Figure 224: Acyclovir Varicella Zoster Infection Treatment Market Size (US$ Mn) Analysis, 2012-2021
Figure 225: Acyclovir Varicella Zoster Infection Treatment Market Forecast & Y-o-Y Growth (%), 2022-2028
Figure 226: Valacyclovir Varicella Zoster Infection Treatment Market Size (US$ Mn) Analysis, 2012-2021
Figure 227: Valacyclovir Varicella Zoster Infection Treatment Market Forecast & Y-o-Y Growth (%), 2022-2028
Figure 228: Famciclovir Varicella Zoster Infection Treatment Market Size (US$ Mn) Analysis, 2012-2021
Figure 229: Famciclovir Varicella Zoster Infection Treatment Market Forecast & Y-o-Y Growth (%), 2022-2028
Figure 230: Oral Varicella Zoster Infection Treatment Market Size (US$ Mn) Analysis, 2012-2021
Figure 231: Oral Varicella Zoster Infection Treatment Market Forecast & Y-o-Y Growth (%), 2022-2028
Figure 232: Injectable Varicella Zoster Infection Treatment Market Size (US$ Mn) Analysis, 2012-2021
Figure 233: Injectable Varicella Zoster Infection Treatment Market Forecast & Y-o-Y Growth (%), 2022-2028
Figure 234: Topical Varicella Zoster Infection Treatment Market Size (US$ Mn) Analysis, 2012-2021
Figure 235: Topical Varicella Zoster Infection Treatment Market Forecast & Y-o-Y Growth (%), 2022-2028
Figure 236: Hospital Pharmacies Varicella Zoster Infection Treatment Market Size (US$ Mn) Analysis, 2012-2021
Figure 237: Hospital Pharmacies Varicella Zoster Infection Treatment Market Forecast & Y-o-Y Growth (%), 2022-2028
Figure 238: Retail Pharmacies Varicella Zoster Infection Treatment Market Size (US$ Mn) Analysis, 2012-2021
Figure 239: Retail Pharmacies Varicella Zoster Infection Treatment Market Forecast & Y-o-Y Growth (%), 2022-2028
Figure 240: Online Pharmacies Varicella Zoster Infection Treatment Market Size (US$ Mn) Analysis, 2012-2021
Figure 241: Online Pharmacies Varicella Zoster Infection Treatment Market Forecast & Y-o-Y Growth (%), 2022-2028
Figure 242: Drug Stores Varicella Zoster Infection Treatment Market Size (US$ Mn) Analysis, 2012-2021
Figure 243: Drug Stores Varicella Zoster Infection Treatment Market Forecast & Y-o-Y Growth (%), 2022-2028
Figure 244: Japan Varicella Zoster Infection Treatment Market Attractiveness Analysis By Drug Type, 2022-2028
Figure 245: Japan Varicella Zoster Infection Treatment Market Attractiveness Analysis By Route of Administration,2022-2028
Figure 246: Japan Varicella Zoster Infection Treatment Market Attractiveness Analysis By Distribution Channel, 2022-2028
Figure 247: Varicella Zoster Infection Treatment Market Split By Drug Type (2021)
Figure 248: Varicella Zoster Infection Treatment Market Split By Route of Administration (2021)
Figure 249: Varicella Zoster Infection Treatment Market Split By Distribution Channel (2021)
Figure 250: Varicella Zoster Infection Treatment Market Split By Country (2021)
Figure 251: MEA Varicella Zoster Infection Treatment Market Size Analysis, 2012-2021
Figure 252: MEA Varicella Zoster Infection Treatment Market Forecast & Y-o-Y growth, 2022-2028
Figure 253: GCC Countries Varicella Zoster Infection Treatment Market Size (US$ Mn) Analysis, 2012-2021
Figure 254: GCC Countries Varicella Zoster Infection Treatment Market Forecast & Y-o-Y Growth (%), 2022-2028
Figure 255: South Africa Varicella Zoster Infection Treatment Market Size (US$ Mn) Analysis, 2012-2021
Figure 256: South Africa Varicella Zoster Infection Treatment Market Forecast & Y-o-Y Growth (%), 2022-2028
Figure 257: North Africa Varicella Zoster Infection Treatment Market Size (US$ Mn) Analysis, 2012-2021
Figure 258: North Africa Varicella Zoster Infection Treatment Market Forecast & Y-o-Y Growth (%), 2022-2028
Figure 259: Rest of MEA Varicella Zoster Infection Treatment Market Size (US$ Mn) Analysis, 2012-2021
Figure 260: Rest of MEA Varicella Zoster Infection Treatment Market Forecast & Y-o-Y Growth (%), 2022-2028
Figure 261: Acyclovir Varicella Zoster Infection Treatment Market Size (US$ Mn) Analysis, 2012-2021
Figure 262: Acyclovir Varicella Zoster Infection Treatment Market Forecast & Y-o-Y Growth (%), 2022-2028
Figure 263: Valacyclovir Varicella Zoster Infection Treatment Market Size (US$ Mn) Analysis, 2012-2021
Figure 264: Valacyclovir Varicella Zoster Infection Treatment Market Forecast & Y-o-Y Growth (%), 2022-2028
Figure 265: Famciclovir Varicella Zoster Infection Treatment Market Size (US$ Mn) Analysis, 2012-2021
Figure 266: Famciclovir Varicella Zoster Infection Treatment Market Forecast & Y-o-Y Growth (%), 2022-2028
Figure 267: Oral Varicella Zoster Infection Treatment Market Size (US$ Mn) Analysis, 2012-2021
Figure 268: Oral Varicella Zoster Infection Treatment Market Forecast & Y-o-Y Growth (%), 2022-2028
Figure 269: Injectable Varicella Zoster Infection Treatment Market Size (US$ Mn) Analysis, 2012-2021
Figure 270: Injectable Varicella Zoster Infection Treatment Market Forecast & Y-o-Y Growth (%), 2022-2028
Figure 271: Topical Varicella Zoster Infection Treatment Market Size (US$ Mn) Analysis, 2012-2021
Figure 272: Topical Varicella Zoster Infection Treatment Market Forecast & Y-o-Y Growth (%), 2022-2028
Figure 273: Hospital Pharmacies Varicella Zoster Infection Treatment Market Size (US$ Mn) Analysis, 2012-2021
Figure 274: Hospital Pharmacies Varicella Zoster Infection Treatment Market Forecast & Y-o-Y Growth (%), 2022-2028
Figure 275: Retail Pharmacies Varicella Zoster Infection Treatment Market Size (US$ Mn) Analysis, 2012-2021
Figure 276: Retail Pharmacies Varicella Zoster Infection Treatment Market Forecast & Y-o-Y Growth (%), 2022-2028
Figure 277: Online Pharmacies Varicella Zoster Infection Treatment Market Size (US$ Mn) Analysis, 2012-2021
Figure 278: Online Pharmacies Varicella Zoster Infection Treatment Market Forecast & Y-o-Y Growth (%), 2022-2028
Figure 279: Drug Stores Varicella Zoster Infection Treatment Market Size (US$ Mn) Analysis, 2012-2021
Figure 280: Drug Stores Varicella Zoster Infection Treatment Market Forecast & Y-o-Y Growth (%), 2022-2028
Figure 281: MEA Varicella Zoster Infection Treatment Market Attractiveness Analysis By Drug Type, 2022-2028
Figure 282: MEA Varicella Zoster Infection Treatment Market Attractiveness Analysis By Route of Administration, 2022-2028
Figure 283: MEA Varicella Zoster Infection Treatment Market Attractiveness Analysis By Distribution Channel, 2022-2028
Figure 284: MEA Varicella Zoster Infection Treatment Market Attractiveness Analysis By Country, 2022-2028
Figure 285: Global Varicella Zoster Infection Treatment Market Attractiveness Analysis By Region, 2022-2028
Figure 286: Global Varicella Zoster Infection Treatment Market Attractiveness Analysis By Drug Type, 2022-2028
Figure 287: Global Varicella Zoster Infection Treatment Market Attractiveness Analysis By Route of Administration, 2022-2028
Figure 288: Global Varicella Zoster Infection Treatment Market Attractiveness Analysis By Distribution Channel, 2022-2028
Figure 289: Global Varicella Zoster Infection Treatment Market Value Analysis and Forecast, 2012–2028 (US$ Mn)
Figure 290: Global Varicella Zoster Infection Treatment Market Absolute $ Opportunity (US$ Mn), 2012–2028
Need specific information?
Request CustomizationExplore Healthcare Insights
View Reports