The Algae Treatment Chemical Market is estimated to be valued at USD 3.6 billion in 2025 and is projected to reach USD 6.0 billion by 2035, registering a compound annual growth rate (CAGR) of 5.2% over the forecast period.
The Algae Treatment Chemical market is witnessing substantial growth, driven by increasing demand for effective solutions to control harmful algal blooms in freshwater and marine environments. Rising concerns regarding water quality, aquatic ecosystem health, and public safety are accelerating the adoption of algae treatment chemicals across industrial, municipal, and agricultural sectors. Continuous advancements in chemical formulations, including targeted algaecides with improved selectivity and reduced environmental impact, are enhancing treatment efficiency and sustainability.
The integration of monitoring technologies and automated dosing systems is further improving operational effectiveness, reducing chemical wastage, and ensuring compliance with regulatory standards. Governments and environmental agencies are increasingly implementing stricter regulations for water quality management, which is further driving market adoption.
Growing awareness of the economic impacts of algal blooms on fisheries, tourism, and water utilities is also supporting market expansion As industries continue to focus on sustainable water management practices and environmental stewardship, the Algae Treatment Chemical market is expected to experience long-term growth, with innovation and regulatory support serving as key drivers for future opportunities.
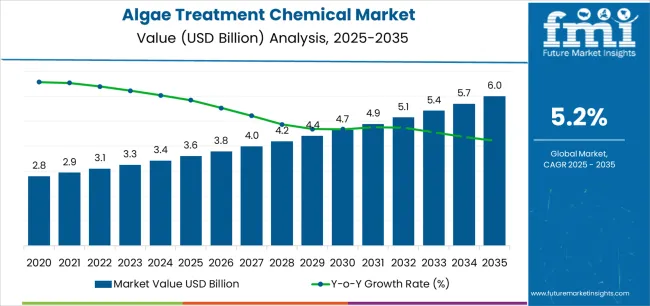
| Metric | Value |
|---|---|
| Algae Treatment Chemical Market Estimated Value in (2025 E) | USD 3.6 billion |
| Algae Treatment Chemical Market Forecast Value in (2035 F) | USD 6.0 billion |
| Forecast CAGR (2025 to 2035) | 5.2% |
The market is segmented by Product Type, Algae Type, Form, and End-Use Industry and region. By Product Type, the market is divided into Algaecides, Coagulants And Flocculants, Ph Adjusters, Oxidizers, Biocides, Nutrient Reduction Chemicals, and Others. In terms of Algae Type, the market is classified into Macroalgae and Microalgae. Based on Form, the market is segmented into Liquid and Solid. By End-Use Industry, the market is divided into Municipal Water Treatment, Industrial Water Treatment, Agriculture, Healthcare And Pharmaceuticals, Food And Beverage, and Others. Regionally, the market is classified into North America, Latin America, Western Europe, Eastern Europe, Balkan & Baltic Countries, Russia & Belarus, Central Asia, East Asia, South Asia & Pacific, and the Middle East & Africa.
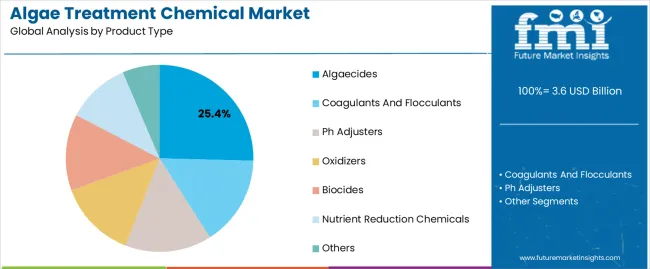
The algaecides product type segment is projected to hold 25.4% of the market revenue in 2025, establishing it as the leading product category. Growth in this segment is being driven by the high efficacy of algaecides in targeting and controlling a broad spectrum of algal species while minimizing damage to non-target organisms. Advanced formulations enable rapid action and improved persistence in water bodies, providing consistent performance for both municipal and industrial applications.
Algaecides are increasingly being integrated with automated monitoring and dosing systems, enhancing operational efficiency and reducing labor-intensive processes. Regulatory approvals for safe and environmentally compliant chemical compositions have further strengthened adoption.
The ability to optimize application rates, reduce chemical waste, and ensure effective treatment even under challenging environmental conditions has reinforced the segment’s market leadership As concerns regarding water quality and ecological balance continue to grow, algaecides are expected to maintain their leading position, driven by technological innovation and increasing demand for effective algae control solutions.
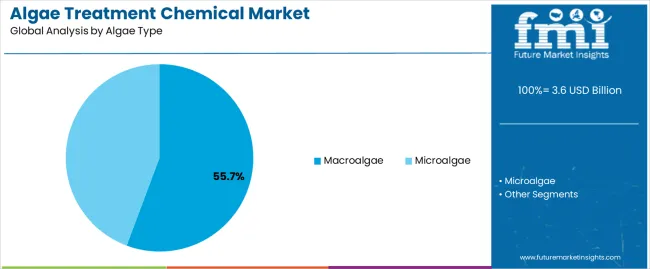
The macroalgae segment is expected to account for 55.7% of the market revenue in 2025, making it the leading algae type targeted by treatment chemicals. Its growth is being driven by the widespread occurrence of macroalgal blooms in coastal waters, freshwater reservoirs, and aquaculture systems, which can disrupt aquatic ecosystems and hinder water usability. Algae treatment chemicals specifically formulated for macroalgae provide high removal efficiency, reducing the environmental and economic impacts of uncontrolled blooms.
Integration of chemical treatments with water quality monitoring and environmental management practices has further improved adoption. Rising awareness among municipalities, industrial water users, and aquaculture operators regarding the importance of controlling macroalgal proliferation is enhancing market demand.
The effectiveness of treatments in reducing biomass, preventing oxygen depletion, and maintaining water clarity reinforces their preference As environmental regulations tighten and ecosystem preservation becomes a priority, the macroalgae segment is expected to retain its dominant market position, supported by ongoing innovation in chemical formulations and application strategies.
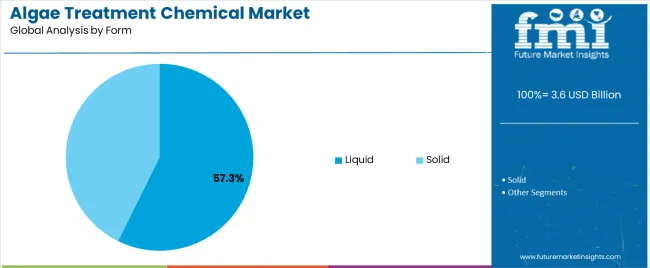
The liquid form segment is projected to hold 57.3% of the market revenue in 2025, establishing it as the leading form category. Growth in this segment is being driven by the ease of application, uniform dispersion, and rapid solubility of liquid formulations in water bodies, which ensures effective algae control.
Liquid products allow precise dosing, better penetration, and quicker action, making them suitable for large-scale water treatment operations in municipal, industrial, and aquaculture settings. The versatility of liquid formulations to integrate with automated delivery systems and monitoring technologies enhances operational efficiency and reduces labor costs.
Safety, compliance with environmental regulations, and lower risk of sediment accumulation further support adoption As demand for efficient and scalable algae treatment solutions rises, liquid formulations are expected to maintain their leading position, driven by technological innovation, operational convenience, and proven performance in diverse aquatic environments.
Market to Surge Over 1.5x through 2035
The algae treatment chemical industry is predicted to rise over 1.5x through 2035, accompanied by a 1.0% increase in the projected CAGR compared to the historical one. This is due to increased concerns about water pollution, harmful algal blooms, and stringent regulatory frameworks regulating water quality.
The market is anticipated to be pushed by industries such as municipal water treatment, agriculture, aquaculture, and industrial processes looking for effective ways to combat algal proliferation. With a growing focus on sustainability and environmental stewardship, the industry is set to surge by 2035, meeting a wide range of industry needs.
North America Leads the Market across the Globe
North America is set to retain its dominance in the algae treatment market during the forecast period. It is set to hold 26.5% of the global market share in 2035. This is attributed to the following factors:
Demand for chemicals in the agriculture industry in North America is growing as farmers and agribusinesses adopt more sustainable practices. Algae cleaners are increasingly used to control algae blooms in irrigation systems, improving water use and crop health.
Farmers in North America use these chemicals to reduce the negative impact of algae on soil fertility & crop yields and prevent nutrient runoff water availability. The region's growing environmental commitment is emphasized by the significant role of sludge treatment technologies in promoting sustainable agricultural practices.
In North America, demand for chemicals is growing exponentially as the industry prioritizes environmental sustainability and regulatory compliance. Algae bloom and water pollution concerns prompt efficient algae treatment technologies for energy generation and food processing, emphasizing chemical algae treatments for sustainable business practices.
Bio-based and sustainable chemicals are gaining traction compared to conventional chemical treatments, fueling the market. Products made from renewable resources and with little environmental impact are increasingly in demand from consumers, leading companies, and regulatory agencies.
Governments worldwide are implementing robust environmental rules and regulations to manage and stop algae blooms, surging demand for algae treatment chemicals. Need for environmentally safe, efficacious chemicals for algae treatment that also meet ecological regulations is being propelled by this regulatory setting.
Novel chemical formulations, biological therapies, and algae monitoring systems are gaining traction in the industry. There is a growing need for chemicals used in algae treatment due to worries about pollution in water, especially in lakes, ponds, and other bodies of water. Algal blooms have the potential to negatively impact aquatic ecosystems, human health, and water quality, which makes efficient remediation methods imperative.
Such chemicals are widely utilized in wastewater, agriculture, aquaculture, and water treatment, with growing market potential. International funding for water infrastructure projects, particularly from emerging nations, is further projected to boost demand.
Algae treatment chemical sales grew at a CAGR of 4.9% between 2020 and 2025. The market reached a value of USD 3,070.0 million in 2025.
| Historical CAGR (2020 to 2025) | 4.9% |
|---|---|
| Forecast CAGR (2025 to 2035) | 5.5% |
The industry witnessed high growth between 2020 and 2025. This was due to economic growth in emerging markets, leading to increased municipal water treatment and agriculture industries.
Environmental regulations have propelled the industry, aiming to reduce nutrient runoff, control algal blooms, and protect aquatic ecosystems. From 2020 to 2025, more advanced and environmentally friendly formulations have been developed, offering improved efficacy, lower toxicity, and reduced environmental impact compared to traditional chemical treatments.
By 2035, the market is poised to exhibit healthy growth, totaling a valuation of USD 5,724.0 million by 2035. The market in industrial water treatment has a promising future, owing to rising need for manufacturing precision and efficiency. Technological and scientific developments are set to augment more efficient and environmentally friendly methods of sludge treatment, which is estimated to propel the market.
Rising Awareness of Water Pollution to Surge Demand
Increasing awareness of water pollution is a key factor fueling demand for algae cleaners. Demand for chemicals is set to increase as people become more aware of the environmental health risks posed by water pollution. This trend emphasizes the key importance of sustainable water management chemicals that focus on the chemical treatment of algae.
Stringent Regulatory Frameworks
To combat water pollution and preserve human health, governments worldwide enforce strict environmental restrictions and water quality requirements. These laws encourage leading companies to invest in effective algae treatment methods to meet discharge limitations and maintain acceptable water quality.
High Costs to Impede Market Growth
Compared to other ways, the low cost of chemicals is set to discourage potential clients from purchasing these goods. Volatility in raw material and energy costs compound the cost issues that manufacturers and end users experience. As a result, high costs of chemicals inhibit market expansion and acceptance, restricting the accessibility of these treatments to sectors wanting to address water pollution.
The section will go into detail on the algae treatment chemical industry in a few key countries, including India, China, Hungary, and Mexico. This section will lay emphasis on the various reasons that are propelling growth of the market in the below-mentioned regions.
| Countries | CAGR (2025 to 2035) |
|---|---|
| India | 5.6% |
| China | 4.5% |
| Hungary | 3.3% |
| Mexico | 2.4% |
| Canada | 1.9% |
India’s growing population, urbanization, and industrialization have aggravated pollution and water contamination issues. The government’s decisions to promote environmental sustainability and regulatory compliance are increasing the demand in several industries in India. As a result, India is seeing substantial growth in the market, establishing itself as a key player in the global market.
China's growing industrial base and environmental concerns pose significant water pollution challenges due to urbanization and advanced technologies. Consumer awareness of algae blooms' environmental and health impacts surge demand for proactive algae treatment measures, with education campaigns promoting responsible water management practices in China.
China's commitment to environmental sustainability and regulatory compliance encourages using sludge treatment chemicals in various industries, including urban water treatment, agricultural, aquaculture, and industrial activities. China's research & development investments also strengthen the competitiveness and innovativeness of its algae chemical industry, both in international markets and positioning as a key partner.
The United States' stringent water quality and pollution control regulations, enforced by agencies like the EPA, fuel demand for chemicals that meet environmental standards. Harmed algal blooms in the United States water bodies raise water safety and ecosystem health concerns, necessitating algae treatment chemicals to manage and mitigate their impact.
Climate, water temperature, nutrient runoff, and agricultural practices influence algal bloom levels in the United States, affecting chemical demand across states and regions. The market increasingly prioritizes sustainable and eco-friendly algae treatment solutions, utilizing bio-based algaecides and eco-friendly technologies to minimize ecological impact.
Canada’s algae treatment chemical market benefits from technological developments in water treatment processes, including chemical formulations, algae monitoring systems, and remote sensing technologies for early algal bloom detection.
The government and private sector are investing in upgrading water infrastructure to improve water quality, reduce environmental challenges like algal blooms, and create job opportunities in Canada. The industry in Canada faces competition from manufacturers and suppliers, with consolidation through mergers, acquisitions, and strategic alliances as companies grow their presence.
The section below shows the algaecides dominating based on product type. It is forecast to thrive at 4.5% CAGR between 2025 and 2035. Based on the end-use industry, the industrial water treatment segment is anticipated to hold a dominant share through 2035. It is set to exhibit a CAGR of 4.9% during the forecast period.
| Top Segment (Product Type) | Algaecides |
|---|---|
| Predicted CAGR (2025 to 2035) | 4.5% |
Based on product type, algaecides are gaining traction in the market due to their ability to control and inhibit algae growth in several water bodies. Technological developments have resulted in robust chemicals that eliminate algae and prevent regrowth, fueling the market.
Rising environmental consciousness among consumers increases demand for eco-friendly options in agricultural pounds and pools, fueling demand for algaecides. This combination of efficacy, simplicity, and sustainability solidifies algaecides as preferred options for fighting algal proliferation.
| Top Segment (End-use Industry) | Industrial Water Treatment |
|---|---|
| Projected CAGR (2025 to 2035) | 4.9% |
Based on the end-use industry, algae treatment chemicals are gaining popularity in the industrial water treatment industry due to the importance of improving water quality and efficiency. As manufacturers are prioritizing environmental sustainability, the significance of algae treatment chemicals is increasing.
Technological developments have LED to the emergence of of efficient and environmentally friendly technologies. These have further increased their popularity in the industrial water treatment industry.
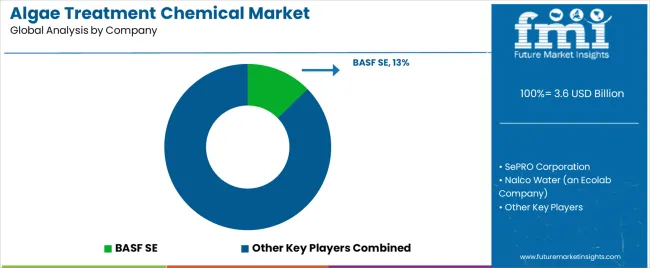
The market is consolidated, with leading players accounting for around 40% to 45% share. Applied Biochemists, BioSafe Systems LLC, LG Sonic, Ocean Harvest Technology, SePRO Corporation, and BASF SE are the leading manufacturers and suppliers of the algae treatment chemicals listed in the report.
Key global algae treatment chemicals companies are investing in continuous research for producing new products and increasing their production capacity to meet end-user demand. To strengthen their global footprint, they are directed toward adopting growth strategies, including acquisitions, partnerships, mergers, and facility expansions.
Recent Developments
The global algae treatment chemical market is estimated to be valued at USD 3.6 billion in 2025.
The market size for the algae treatment chemical market is projected to reach USD 6.0 billion by 2035.
The algae treatment chemical market is expected to grow at a 5.2% CAGR between 2025 and 2035.
The key product types in algae treatment chemical market are algaecides, coagulants and flocculants, ph adjusters, oxidizers, biocides, nutrient reduction chemicals and others.
In terms of algae type, macroalgae segment to command 55.7% share in the algae treatment chemical market in 2025.


Our Research Products

The "Full Research Suite" delivers actionable market intel, deep dives on markets or technologies, so clients act faster, cut risk, and unlock growth.

The Leaderboard benchmarks and ranks top vendors, classifying them as Established Leaders, Leading Challengers, or Disruptors & Challengers.

Locates where complements amplify value and substitutes erode it, forecasting net impact by horizon

We deliver granular, decision-grade intel: market sizing, 5-year forecasts, pricing, adoption, usage, revenue, and operational KPIs—plus competitor tracking, regulation, and value chains—across 60 countries broadly.

Spot the shifts before they hit your P&L. We track inflection points, adoption curves, pricing moves, and ecosystem plays to show where demand is heading, why it is changing, and what to do next across high-growth markets and disruptive tech

Real-time reads of user behavior. We track shifting priorities, perceptions of today’s and next-gen services, and provider experience, then pace how fast tech moves from trial to adoption, blending buyer, consumer, and channel inputs with social signals (#WhySwitch, #UX).

Partner with our analyst team to build a custom report designed around your business priorities. From analysing market trends to assessing competitors or crafting bespoke datasets, we tailor insights to your needs.
Supplier Intelligence
Discovery & Profiling
Capacity & Footprint
Performance & Risk
Compliance & Governance
Commercial Readiness
Who Supplies Whom
Scorecards & Shortlists
Playbooks & Docs
Category Intelligence
Definition & Scope
Demand & Use Cases
Cost Drivers
Market Structure
Supply Chain Map
Trade & Policy
Operating Norms
Deliverables
Buyer Intelligence
Account Basics
Spend & Scope
Procurement Model
Vendor Requirements
Terms & Policies
Entry Strategy
Pain Points & Triggers
Outputs
Pricing Analysis
Benchmarks
Trends
Should-Cost
Indexation
Landed Cost
Commercial Terms
Deliverables
Brand Analysis
Positioning & Value Prop
Share & Presence
Customer Evidence
Go-to-Market
Digital & Reputation
Compliance & Trust
KPIs & Gaps
Outputs
Full Research Suite comprises of:
Market outlook & trends analysis
Interviews & case studies
Strategic recommendations
Vendor profiles & capabilities analysis
5-year forecasts
8 regions and 60+ country-level data splits
Market segment data splits
12 months of continuous data updates
DELIVERED AS:
PDF EXCEL ONLINE
Soil Treatment Chemicals Market
Water Treatment Chemical Market Size and Share Forecast Outlook 2025 to 2035
Sludge Treatment Chemicals Market Growth - Trends & Forecast 2025 to 2035
Surface Treatment Chemicals Market Size and Share Forecast Outlook 2025 to 2035
Boiler Water Treatment Chemicals Market Size and Share Forecast Outlook 2025 to 2035
Cooling Water Treatment Chemicals Market Growth - Trends & Forecast 2025 to 2035
Concrete Surface Treatment Chemicals Market Size and Share Forecast Outlook 2025 to 2035
Advanced Surface Treatment Chemicals Market Analysis by Chemical, Surface, End-Use Industry and Region: Forecast from 2025 to 2035
Bioelectrochemical Systems For Wastewater Treatment Market Size and Share Forecast Outlook 2025 to 2035
Water and Waste Water Treatment Chemical Market Size and Share Forecast Outlook 2025 to 2035
Industrial Wastewater Treatment Chemical Market Insights - Growth & Demand 2025 to 2035
Chemical Hydraulic Valves Market Size and Share Forecast Outlook 2025 to 2035
Chemical Vapor Deposition Market Forecast Outlook 2025 to 2035
Algae-Polymer Extruders Market Size and Share Forecast Outlook 2025 to 2035
Chemical Recycling Service Market Forecast Outlook 2025 to 2035
Chemical Dosing Equipment Market Size and Share Forecast Outlook 2025 to 2035
Chemical Filling System Market Size and Share Forecast Outlook 2025 to 2035
Chemical Absorbent Pads Market Size and Share Forecast Outlook 2025 to 2035
Chemical Indicator Inks Market Size and Share Forecast Outlook 2025 to 2035
Chemical Boiler Market Size and Share Forecast Outlook 2025 to 2035

Thank you!
You will receive an email from our Business Development Manager. Please be sure to check your SPAM/JUNK folder too.
Chat With
MaRIA