Microalgae Market Size and Share Forecast Outlook 2025 to 2035

The global microalgae market is likely to reach USD 29.6 billion by 2035, reflecting a CAGR of 8.0%. The market is valued at USD 13.7 billion in 2025. Factors driving this growth include rising demand for natural, sustainable ingredients across the food, pet care, and cosmetics industries, along with technological advances in photobioreactor systems.
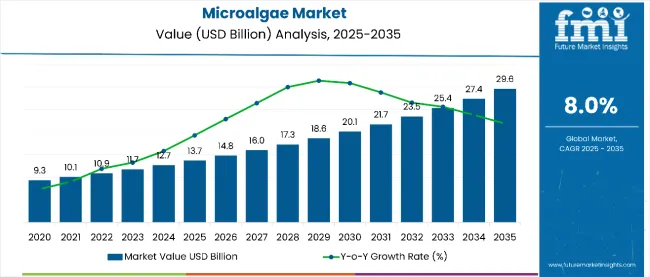
Quick Stats for Microalgae Market

  • Market Value (2025): USD 13.7 billion
  • Forecast Value (2035): USD 29.6 billion
  • Forecast CAGR: 8.0%
  • Product Leader in 2025: Spirulina (38% Market Share)
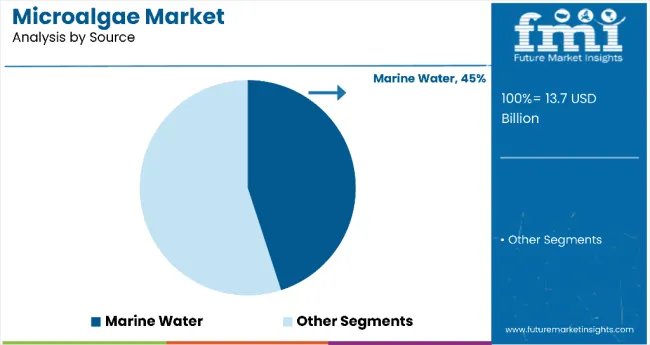
  • Top Source Segment: Marine Water (45% Market Share)
  • Key Growth Region: North America (fastest growing market in the USA with 8.2% CAGR)

Microalgae Market

Metric Value
Estimated Size (2025E) USD 13.7 billion
Projected Value (2035F) USD 29.6 billion
CAGR (2025 to 2035) 8.0%

The expanding application scope in bioplastics, nutraceuticals, and fermented algae-based fuels is also anticipated to create lucrative opportunities during the forecast period.

The USA is expected to lead the global microalgae market with the largest market share in 2025, growing at a significant CAGR of 8.2%. Meanwhile, France and Japan are anticipated to register the fastest growth with CAGRs of 5.2% and 5.1% respectively. Spirulina is projected to dominate the species segment with a 38% market share, followed by Chlorella. The marine water source segment is expected to lead with a 45% share in 2025, owing to the ease of cultivation and minimal land use.

The market holds a significant share across several broader sectors due to its diverse applications. It accounts for approximately 18% of the overall seaweed and algae market, driven by its higher commercial value and versatility. Within the functional ingredients market, it contributes around 6%, owing to its rising use in food, beverages, and cosmetics.

In the nutraceuticals market, microalgae represent nearly 8%, fueled by growing demand for natural supplements. It also holds about 5% share in the alternative protein market and roughly 3% in the renewable energy market, mainly due to its emerging role in algae-based biofuels.

Going forward, the microalgae market is anticipated to benefit from increased government funding for clean energy and water treatment technologies. Recent innovations include algae-derived heme for plant-based meat and biodegradable plastics. Supportive regulations encouraging sustainable farming and renewable ingredients are also expected to accelerate commercialization.

Key universities and startups are entering the market with R&D in algae cultivation, bioremediation, and nutraceutical applications. Further, government support for eco-friendly energy solutions and initiatives for wastewater treatment using microalgae is expected to boost adoption.

Microalgae Market Analysis by Top Investment Segment

The market is segmented into species, source, application, and region. Under species, the key categories include spirulina, chlorella, dunaliella, haematococcus, crypthecodinium, schizochytrium, euglena, nannochloropsis, phaedactylum, and others (including ankistrodesmus, tetraselmis, and tsochrysis).

In terms of source, the market is divided into Marine Water and Fresh Water. Application-wise, it includes food and beverages sector, health and medical sector, animal feed sector, pet food sector, cosmetics and personal care sector, and fertilizers sector. Geographically, the market spans North America, Latin America, Europe, Asia Pacific, and the Middle East & Africa (MEA).
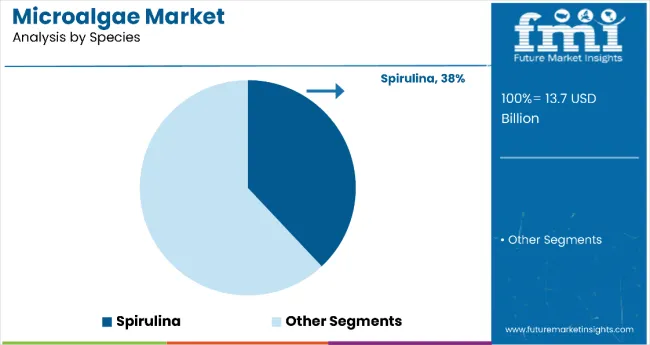
By Species, Spirulina Accounts for 38% of the Market Share

Microalgae Market Analysis By Species

Spirulina is projected to dominate the species segment with a 38% share in 2025, owing to its high protein content and increasing usage in dietary supplements, functional beverages, and health food products. Its antioxidant and anti-inflammatory benefits have led to wider acceptance in the nutraceutical and personal care sectors.
  • Widely used in health supplements and wellness drinks
  • Contains phycocyanin, aiding detox and immunity
  • Cost-effective species for large-scale cultivation
  • Backed by WHO and NASA as a key nutrition source

By Source, Marine Water Accounts for 45% of the Market Share

Microalgae Market Analysis By Source

Marine water microalgae are estimated to hold a 45% market share in 2025, driven by their ability to grow on non-arable land and without freshwater resources. This segment is highly favored due to low cultivation cost and minimal environmental impact. Marine algae like Nannochloropsis and Dunaliella are particularly rich in Omega-3s and carotenoids, making them valuable for health and feed applications.
  • Can be cultivated in desert regions with saline water
  • Ideal for biofuel and Omega-3 oil extraction
  • Less dependence on freshwater makes it sustainable
  • Lowers competition with food crops for land usage

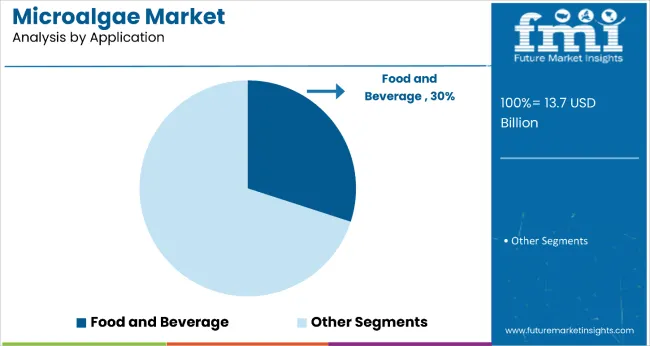
By Application, the Food and Beverages Segment Accounts for 30% of the Market Share

Microalgae Market Analysis By Application

The food and beverages sector is set to lead with a 30% share in 2025, as manufacturers increasingly use microalgae for fortification, color, and taste enhancement. From energy bars to dairy alternatives and plant-based meat, algae are now present in multiple mainstream formats. Their nutritional richness and natural sourcing make them popular among vegan and health-conscious consumers.

  • Enhances color, texture, and nutritional content in foods
  • Growing use in plant-based and clean-label foods
  • Ideal for gluten-free and vegan food production
  • Regulatory approvals expanding product development

Top Microalgae Market Dynamics

Recent Trends in the Microalgae Market

  • Surge in demand for algae-derived proteins and functional ingredients in vegan food products.
  • Rising adoption of photobioreactor technology for scalable and efficient cultivation.
  • Increasing investments in microalgae-based sustainable aviation fuel and bioplastics.
  • Expansion of cosmetic brands launching algae-infused skincare and haircare products.

Key Challenges in the Microalgae Market
  • High production and downstream processing costs limit large-scale commercialization.
  • Lack of consumer awareness in developing regions about microalgae’s benefits.
  • Regulatory hurdles related to novel food approvals in some countries.
  • Technical barriers in strain improvement and biomass harvesting methods.

Analyzing Top Countries Producing, Using and Supplying Microalgae

Microalgae Market Country Wise Analysis

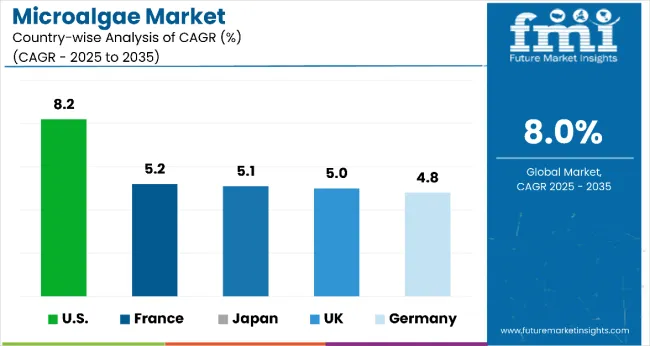
Among the top five countries in the market, the USA leads with the highest projected CAGR of 8.2% from 2025 to 2035, driven by strong investments in sustainable fuels and nutraceuticals. France follows at 5.2%, supported by its robust food sector and agricultural applications. Japan and the UK both record stable growth at CAGRs of 5.1% and 5.0%, fueled by clean energy transitions and algae-based health products.

Germany is anticipated to grow at 4.8%, benefiting from academic-industry partnerships and the expansion of algae-based cosmetics. Overall, North America is set to outpace Europe and Asia in terms of growth momentum in microalgae production and consumption.

The report covers an in-depth analysis of 40+ countries; five top-performing OECD countries are highlighted below.
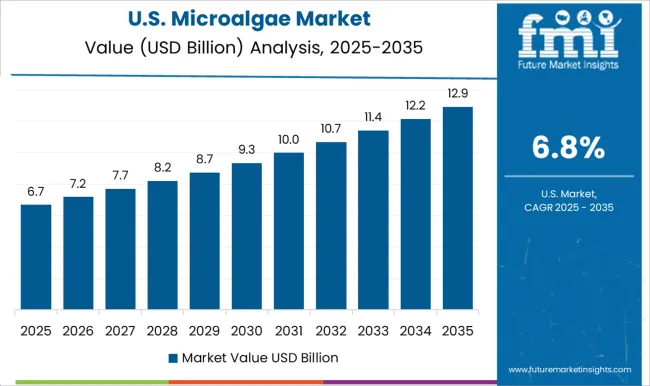
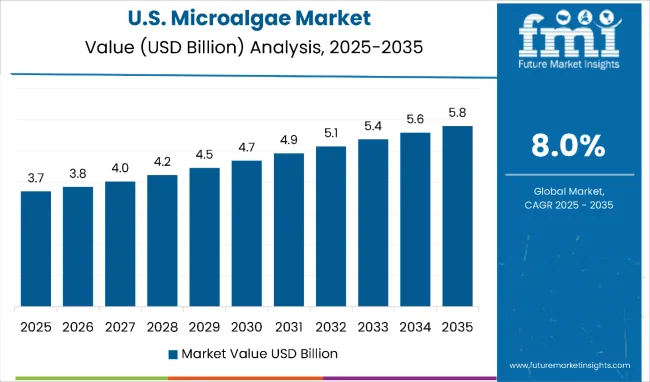
United States Microalgae Market Analysis

United States Microalgae Market Value Analysis 2025 To 2035

The microalgae revenue in the USA is expected to expand at a CAGR of 8.2% from 2025 to 2035. Growth is primarily driven by advanced applications in aerospace and sustainable fuel initiatives, as well as a strong focus on nutraceuticals and functional foods. Regulatory support for algae-based aviation fuels and the growing preference for algae-derived ingredients in cosmetics and supplements are key contributors to the expanding market.

  • Growing investments in algae-based biofuels and jet fuels.
  • Robust consumer demand for natural supplements and functional foods.
  • Extensive research funding for algae-based innovations.

Microalgae Demand Analysis in the United Kingdom

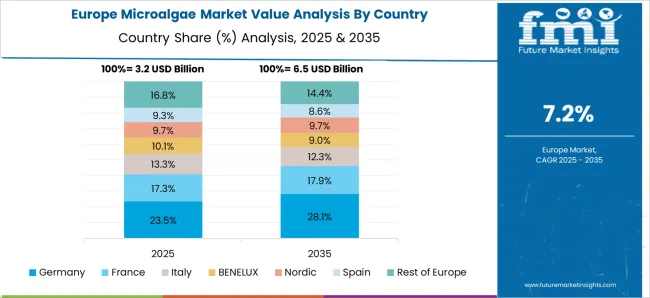
The microalgae market in the UK is forecast to grow at a CAGR of 5.0% between 2025 and 2035. Growth is supported by strong academic-industry collaboration, especially in industrial biotechnology. Programs like Algae-UK are enhancing the development of sustainable algae-based solutions. Companies are using microalgae in everything from biofertilizers to functional beverages, creating new avenues for domestic and export-oriented production.
  • Growing focus on carbon-neutral biotechnology and algae R&D.
  • Use of microalgae in organic cosmetics and hair care is expanding.
  • Government grants are boosting algae-based farming practices.

Germany Microalgae Sales Analysis

The sales of microalgae in Germany are projected to witness a CAGR of 4.8% from 2025 to 2035. The country is at the forefront of clean energy policies and algae-derived biomass utilization. There is increased usage in animal feed, bioplastics, and dietary supplements. Advanced cultivation systems such as closed-loop photobioreactors are increasingly deployed to meet industrial demands and strict EU quality standards.

  • Growing adoption of algae-derived feed and protein products.
  • Focus on algae cultivation as part of energy transition efforts.
  • Strict sustainability targets encouraging algae innovation.

Microalgae Demand Analysis in France

The revenue from microalgae in France is expected to grow at a CAGR of 5.2% from 2025 to 2035. The country’s robust food and beverage sector is integrating microalgae in dairy alternatives, sauces, and health snacks. France also leads in incorporating algae into organic fertilizers and biostimulants to support regenerative agriculture. Public-private partnerships are supporting innovation in cultivation in Brittany and other regions.

  • Increasing integration of algae in clean-label food products.
  • Adoption of microalgae in sustainable agriculture practices.
  • Public-funded R&D fostering algae farming innovation.

Japan Microalgae Market Analysis

The microalgae market in Japan is projected to record a CAGR of 5.1% from 2025 to 2035. The country emphasizes novel photobioreactor applications in wastewater treatment and energy systems. Microalgae are used in dietary supplements, fermented foods, and skincare. The scarcity of fossil fuel resources has prompted Japan to develop algae-based alternatives, while the government supports algae R&D through innovation grants.
  • Strong government incentives for algae-based energy and purification.
  • High demand for functional and anti-aging health products.
  • Use of algae in wastewater treatment is expanding rapidly.

Leading Microalgae Market Suppliers

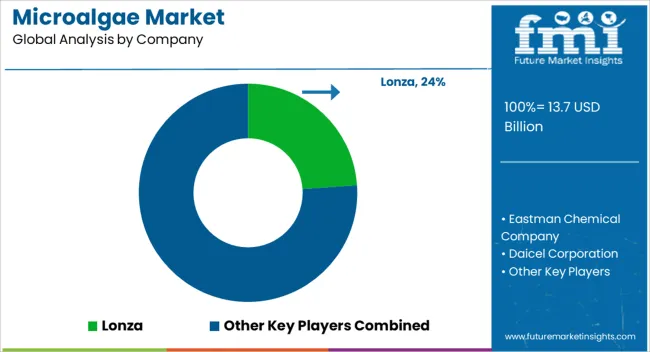
The microalgae market is moderately fragmented, with several established and emerging players competing across diverse application segments. Key suppliers such as Lonza, Eastman Chemical Company, Mitsubishi Chemical Co., Ltd., and Daicel Corporation are enhancing their competitive edge through innovation in microalgae-derived nutraceuticals, cosmetics, and sustainable fuels. These companies operate globally, often leveraging region-specific R&D centers and supply chain advantages to meet the growing demand for algae-based functional ingredients.

Top players are competing based on pricing, quality, and product differentiation, particularly in the rapidly growing health and medical, food and beverage, and personal care markets. Companies are also focusing on sustainable production models, algae strain optimization, and clean-label certification.

Strategic partnerships and expansion into high-growth markets such as Asia-Pacific and North America are central to their growth strategies. Lonza and Eastman Chemical Company have notably increased investments in microalgae for pharmaceutical-grade compounds, while firms like Jubilant Life Sciences Ltd. are targeting applications in bioenergy and animal nutrition.

Recent Microalgae Industry News

  • In March 2025, Daicel launched "BELLOCEA® BS7," an eco-friendly cosmetic texture improver that combines high surface smoothness with biodegradability, reinforcing its commitment to sustainable product development.
  • In 2025, Lonza implemented a new "One Lonza" organizational model in April 2025, streamlining operations into three business platforms: Integrated Biologics, Advanced Synthesis, and Specialized Modalities. The CHI business continues to operate independently, with growth anticipated in 2025.

Microalgae Market Report Scope

Report Attributes Details
Current Total Market Size (2025) USD 13.7 billion
Projected Market Size (2035) USD 29.6 billion
CAGR (2025 to 2035) 8.0%
Base Year for Estimation 2024
Historical Period 2020-2024
Projections Period 2025-2035
Market Analysis Parameters Revenue in USD billions/Volume in Kilotons
By Species Type Spirulina, Chlorella, Dunaliella, Haematococcus, Crypthecodinium, Schizochytrium, Euglena, Nannochloropsis, Phaedactylum, Others (Ankistrodesmus, Tetraselmis, Isochrysis)
By Source Marine Water, Fresh Water
By Application Food and Beverages Sector, Health and Medical Sector, Animal Feed Sector, Pet Food Sector, Cosmetics and Personal Care Sector, Fertilizers Sector
Regions Covered North America, Latin America, Europe, Middle East & Africa, Asia Pacific
Countries Covered United States, Canada, United Kingdom, Germany, France, China, Japan, South Korea, Brazil, Australia
Key Players Lonza, Eastman Chemical Company, Daicel Corporation, Laxmi Organic Industries Ltd., Mitsubishi Chemical Co., Ltd., Zhangjiagang Hope Chemicals Co., Ltd., Nantong Acetic Acid Chemical Co., Ltd., Ningbo Wanglong Technology Co., Jubilant Life Sciences Ltd., Toronto Research Chemicals
Additional Attributes Dollar sales by value, segment-wise market share analysis, and country-wise market breakdown

Key Segments

By Species Type:

  • Spirulina
  • Chlorella
  • Dunaliella
  • Haematococcus
  • Crypthecodinium
  • Schizochytrium
  • Euglena
  • Nannochloropsis
  • Phaedactylum
  • Others

By Source:

  • Marine Water
  • Fresh Water

By End Use Application:

  • Food and Beverages Sector
  • Health and Medical Sector
  • Animal Feed Sector
  • Pet Food Sector
  • Cosmetics and Personal Care Sector
  • Fertilizers Sector

By Region:

  • North America
  • Latin America
  • Western Europe
  • Eastern Europe
  • East Asia
  • South Asia & Pacific
  • Middle East and Africa

Table of Content

  1. Executive Summary
    • Global Market Outlook
    • Demand-side Trends
    • Supply-side Trends
    • Technology Roadmap Analysis
    • Analysis and Recommendations
  2. Market Overview
    • Market Coverage / Taxonomy
    • Market Definition / Scope / Limitations
  3. Market Background
    • Market Dynamics
      • Drivers
      • Restraints
      • Opportunity
      • Trends
    • Scenario Forecast
      • Demand in Optimistic Scenario
      • Demand in Likely Scenario
      • Demand in Conservative Scenario
    • Opportunity Map Analysis
    • Product Life Cycle Analysis
    • Supply Chain Analysis
      • Supply Side Participants and their Roles
        • Producers
        • Mid-Level Participants (Traders/ Agents/ Brokers)
        • Wholesalers and Distributors
      • Value Added and Value Created at Node in the Supply Chain
      • List of Raw Material Suppliers
      • List of Existing and Potential Buyer’s
    • Investment Feasibility Matrix
    • Value Chain Analysis
      • Profit Margin Analysis
      • Wholesalers and Distributors
      • Retailers
    • PESTLE and Porter’s Analysis
    • Regulatory Landscape
      • By Key Regions
      • By Key Countries
    • Regional Parent Market Outlook
    • Production and Consumption Statistics
    • Import and Export Statistics
  4. Global Market Analysis 2020 to 2024 and Forecast, 2025 to 2035
    • Historical Market Size Value (USD billion) & Volume (Kilotons) Analysis, 2020 to 2024
    • Current and Future Market Size Value (USD billion) & Volume (Kilotons) Projections, 2025 to 2035
      • Y-o-Y Growth Trend Analysis
      • Absolute $ Opportunity Analysis
  5. Global Market Pricing Analysis 2020 to 2024 and Forecast 2025 to 2035
  6. Global Market Analysis 2020 to 2024 and Forecast 2025 to 2035, By Species
    • Introduction / Key Findings
    • Historical Market Size Value (USD billion) & Volume (Kilotons) Analysis By Species, 2020 to 2024
    • Current and Future Market Size Value (USD billion) & Volume (Kilotons) Analysis and Forecast By Species, 2025 to 2035
      • Spirulina
      • Chlorellla
      • Dunaliella
      • Haematococcus
      • Crypthecodinium
      • Schizochytrium
      • Euglena
      • Nannochloropsis
      • Phaedactylum
      • Other
        • Ankistrodesmus
        • Tetraselmis
        • Isochrysis
    • Y-o-Y Growth Trend Analysis By Species, 2020 to 2024
    • Absolute $ Opportunity Analysis By Species, 2025 to 2035
  7. Global Market Analysis 2020 to 2024 and Forecast 2025 to 2035, By Source
    • Introduction / Key Findings
    • Historical Market Size Value (USD billion) & Volume (Kilotons) Analysis By Source, 2020 to 2024
    • Current and Future Market Size Value (USD billion) & Volume (Kilotons) Analysis and Forecast By Source, 2025 to 2035
      • Marine Water
      • Fresh water
    • Y-o-Y Growth Trend Analysis By Source, 2020 to 2024
    • Absolute $ Opportunity Analysis By Source, 2025 to 2035
  8. Global Market Analysis 2020 to 2024 and Forecast 2025 to 2035, By Application
    • Introduction / Key Findings
    • Historical Market Size Value (USD billion) & Volume (Kilotons) Analysis By Application, 2020 to 2024
    • Current and Future Market Size Value (USD billion) & Volume (Kilotons) Analysis and Forecast By Application, 2025 to 2035
      • Food and Beverage Sector
      • Health and Medical Sector
      • Animal Feed Sector
      • Pet Food Sector
      • Cosmetics and Personal Care Sector
      • Fertilizer Sector
    • Y-o-Y Growth Trend Analysis By Application, 2020 to 2024
    • Absolute $ Opportunity Analysis By Application, 2025 to 2035
  9. Global Market Analysis 2020 to 2024 and Forecast 2025 to 2035, By Region
    • Introduction
    • Historical Market Size Value (USD billion) & Volume (Kilotons) Analysis By Region, 2020 to 2024
    • Current Market Size Value (USD billion) & Volume (Kilotons) Analysis and Forecast By Region, 2025 to 2035
      • North America
      • Latin America
      • Western Europe
      • Eastern Europe
      • East Asia
      • South Asia & Pacific
      • Middle East and Africa
    • Market Attractiveness Analysis By Region
  10. North America Market Analysis 2020 to 2024 and Forecast 2025 to 2035, By Country
    • Historical Market Size Value (USD billion) & Volume (Kilotons) Trend Analysis By Market Taxonomy, 2020 to 2024
    • Market Size Value (USD billion) & Volume (Kilotons) Forecast By Market Taxonomy, 2025 to 2035
      • By Country
        • USA
        • Canada
        • Mexico
      • By Species
      • By Source
      • By Application
    • Market Attractiveness Analysis
      • By Country
      • By Species
      • By Source
      • By Application
    • Key Takeaways
  11. Latin America Market Analysis 2020 to 2024 and Forecast 2025 to 2035, By Country
    • Historical Market Size Value (USD billion) & Volume (Kilotons) Trend Analysis By Market Taxonomy, 2020 to 2024
    • Market Size Value (USD billion) & Volume (Kilotons) Forecast By Market Taxonomy, 2025 to 2035
      • By Country
        • Brazil
        • Argentina
        • Rest of LATAM
      • By Species
      • By Source
      • By Application
    • Market Attractiveness Analysis
      • By Country
      • By Species
      • By Source
      • By Application
    • Key Takeaways
  12. Western Europe Market Analysis 2020 to 2024 and Forecast 2025 to 2035, By Country
    • Historical Market Size Value (USD billion) & Volume (Kilotons) Trend Analysis By Market Taxonomy, 2020 to 2024
    • Market Size Value (USD billion) & Volume (Kilotons) Forecast By Market Taxonomy, 2025 to 2035
      • By Country
        • Germany
        • Italy
        • France
        • UK
        • Spain
        • BENELUX
        • Nordic
        • Rest of W.Europe
      • By Species
      • By Source
      • By Application
    • Market Attractiveness Analysis
      • By Country
      • By Species
      • By Source
      • By Application
    • Key Takeaways
  13. Eastern Europe Market Analysis 2020 to 2024 and Forecast 2025 to 2035, By Country
    • Historical Market Size Value (USD billion) & Volume (Kilotons) Trend Analysis By Market Taxonomy, 2020 to 2024
    • Market Size Value (USD billion) & Volume (Kilotons) Forecast By Market Taxonomy, 2025 to 2035
      • By Country
        • Russia
        • Hungary
        • Poland
        • Balkan & Baltics
        • Rest of E. Europe
      • By Species
      • By Source
      • By Application
    • Market Attractiveness Analysis
      • By Country
      • By Species
      • By Source
      • By Application
    • Key Takeaways
  14. East Asia Market Analysis 2020 to 2024 and Forecast 2025 to 2035, By Country
    • Historical Market Size Value (USD billion) & Volume (Kilotons) Trend Analysis By Market Taxonomy, 2020 to 2024
    • Market Size Value (USD billion) & Volume (Kilotons) Forecast By Market Taxonomy, 2025 to 2035
      • By Country
        • China
        • Japan
        • South Korea
      • By Species
      • By Source
      • By Application
    • Market Attractiveness Analysis
      • By Country
      • By Species
      • By Source
      • By Application
    • Key Takeaways
  15. South Asia & Pacific Market Analysis 2020 to 2024 and Forecast 2025 to 2035, By Country
    • Historical Market Size Value (USD billion) & Volume (Kilotons) Trend Analysis By Market Taxonomy, 2020 to 2024
    • Market Size Value (USD billion) & Volume (Kilotons) Forecast By Market Taxonomy, 2025 to 2035
      • By Country
        • India
        • Australia & New Zealand
        • ASEAN
        • Rest of SAP
      • By Species
      • By Source
      • By Application
    • Market Attractiveness Analysis
      • By Country
      • By Species
      • By Source
      • By Application
    • Key Takeaways
  16. Middle East and Africa Market Analysis 2020 to 2024 and Forecast 2025 to 2035, By Country
    • Historical Market Size Value (USD billion) & Volume (Kilotons) Trend Analysis By Market Taxonomy, 2020 to 2024
    • Market Size Value (USD billion) & Volume (Kilotons) Forecast By Market Taxonomy, 2025 to 2035
      • By Country
        • GCC Countries
        • Northern Africa
        • South Africa
        • Turkiye
        • Rest of MEA
      • By Species
      • By Source
      • By Application
    • Market Attractiveness Analysis
      • By Country
      • By Species
      • By Source
      • By Application
    • Key Takeaways
  17. Key Countries Market Analysis
    • USA
      • Pricing Analysis
      • Market Share Analysis, 2024
        • By Species
        • By Source
        • By Application
    • Canada
      • Pricing Analysis
      • Market Share Analysis, 2024
        • By Species
        • By Source
        • By Application
    • Brazil
      • Pricing Analysis
      • Market Share Analysis, 2024
        • By Species
        • By Source
        • By Application
    • Mexico
      • Pricing Analysis
      • Market Share Analysis, 2024
        • By Species
        • By Source
        • By Application
    • Argentina
      • Pricing Analysis
      • Market Share Analysis, 2024
        • By Species
        • By Source
        • By Application
  18. Market Structure Analysis
    • Competition Dashboard
    • Competition Benchmarking
    • Market Share Analysis of Top Players
      • By Regional
      • By Species
      • By Source
      • By Application
  19. Competition Analysis
    • Competition Deep Dive
      • Lonza
        • Overview
        • Product Portfolio
        • Profitability by Market Segments (Product/Age /Sales Channel/Region)
        • Sales Footprint
        • Strategy Overview
          • Marketing Strategy
          • Product Strategy
          • Channel Strategy
      • Eastman Chemical Company
        • Overview
        • Product Portfolio
        • Profitability by Market Segments (Product/Age /Sales Channel/Region)
        • Sales Footprint
        • Strategy Overview
          • Marketing Strategy
          • Product Strategy
          • Channel Strategy
      • Daicel Corporation
        • Overview
        • Product Portfolio
        • Profitability by Market Segments (Product/Age /Sales Channel/Region)
        • Sales Footprint
        • Strategy Overview
          • Marketing Strategy
          • Product Strategy
          • Channel Strategy
      • Laxmi Organic Industries Ltd.
        • Overview
        • Product Portfolio
        • Profitability by Market Segments (Product/Age /Sales Channel/Region)
        • Sales Footprint
        • Strategy Overview
          • Marketing Strategy
          • Product Strategy
          • Channel Strategy
      • Mitsubishi Chemical Co., Ltd.
        • Overview
        • Product Portfolio
        • Profitability by Market Segments (Product/Age /Sales Channel/Region)
        • Sales Footprint
        • Strategy Overview
          • Marketing Strategy
          • Product Strategy
          • Channel Strategy
      • Zhangjigang Hope Chemicals Co., Ltd.
        • Overview
        • Product Portfolio
        • Profitability by Market Segments (Product/Age /Sales Channel/Region)
        • Sales Footprint
        • Strategy Overview
          • Marketing Strategy
          • Product Strategy
          • Channel Strategy
      • Nantong Acetic Acid Chemical Co., Ltd.
        • Overview
        • Product Portfolio
        • Profitability by Market Segments (Product/Age /Sales Channel/Region)
        • Sales Footprint
        • Strategy Overview
          • Marketing Strategy
          • Product Strategy
          • Channel Strategy
      • Ningbo Wanglong Technology Co.
        • Overview
        • Product Portfolio
        • Profitability by Market Segments (Product/Age /Sales Channel/Region)
        • Sales Footprint
        • Strategy Overview
          • Marketing Strategy
          • Product Strategy
          • Channel Strategy
      • Jubilant Life Sciences Ltd.
        • Overview
        • Product Portfolio
        • Profitability by Market Segments (Product/Age /Sales Channel/Region)
        • Sales Footprint
        • Strategy Overview
          • Marketing Strategy
          • Product Strategy
          • Channel Strategy
      • Toronto Research Chemicals
        • Overview
        • Product Portfolio
        • Profitability by Market Segments (Product/Age /Sales Channel/Region)
        • Sales Footprint
        • Strategy Overview
          • Marketing Strategy
          • Product Strategy
          • Channel Strategy
  20. Assumptions & Acronyms Used
  21. Research Methodology

List of Tables

  • Table 1: Global Market Value (USD billion) Forecast by Region, 2020-2035
  • Table 2: Global Market Volume (Kilotons) Forecast by Region, 2020-2035
  • Table 3: Global Market Value (USD billion) Forecast by Species, 2020-2035
  • Table 4: Global Market Volume (Kilotons) Forecast by Species, 2020-2035
  • Table 5: Global Market Value (USD billion) Forecast by Source, 2020-2035
  • Table 6: Global Market Volume (Kilotons) Forecast by Source, 2020-2035
  • Table 7: Global Market Value (USD billion) Forecast by Application, 2020-2035
  • Table 8: Global Market Volume (Kilotons) Forecast by Application, 2020-2035
  • Table 9: North America Market Value (USD billion) Forecast by Country, 2020-2035
  • Table 10: North America Market Volume (Kilotons) Forecast by Country, 2020-2035
  • Table 11: North America Market Value (USD billion) Forecast by Species, 2020-2035
  • Table 12: North America Market Volume (Kilotons) Forecast by Species, 2020-2035
  • Table 13: North America Market Value (USD billion) Forecast by Source, 2020-2035
  • Table 14: North America Market Volume (Kilotons) Forecast by Source, 2020-2035
  • Table 15: North America Market Value (USD billion) Forecast by Application, 2020-2035
  • Table 16: North America Market Volume (Kilotons) Forecast by Application, 2020-2035
  • Table 17: Latin America Market Value (USD billion) Forecast by Country, 2020-2035
  • Table 18: Latin America Market Volume (Kilotons) Forecast by Country, 2020-2035
  • Table 19: Latin America Market Value (USD billion) Forecast by Species, 2020-2035
  • Table 20: Latin America Market Volume (Kilotons) Forecast by Species, 2020-2035
  • Table 21: Latin America Market Value (USD billion) Forecast by Source, 2020-2035
  • Table 22: Latin America Market Volume (Kilotons) Forecast by Source, 2020-2035
  • Table 23: Latin America Market Value (USD billion) Forecast by Application, 2020-2035
  • Table 24: Latin America Market Volume (Kilotons) Forecast by Application, 2020-2035
  • Table 25: Western Europe Market Value (USD billion) Forecast by Country, 2020-2035
  • Table 26: Western Europe Market Volume (Kilotons) Forecast by Country, 2020-2035
  • Table 27: Western Europe Market Value (USD billion) Forecast by Species, 2020-2035
  • Table 28: Western Europe Market Volume (Kilotons) Forecast by Species, 2020-2035
  • Table 29: Western Europe Market Value (USD billion) Forecast by Source, 2020-2035
  • Table 30: Western Europe Market Volume (Kilotons) Forecast by Source, 2020-2035
  • Table 31: Western Europe Market Value (USD billion) Forecast by Application, 2020-2035
  • Table 32: Western Europe Market Volume (Kilotons) Forecast by Application, 2020-2035
  • Table 33: Eastern Europe Market Value (USD billion) Forecast by Country, 2020-2035
  • Table 34: Eastern Europe Market Volume (Kilotons) Forecast by Country, 2020-2035
  • Table 35: Eastern Europe Market Value (USD billion) Forecast by Species, 2020-2035
  • Table 36: Eastern Europe Market Volume (Kilotons) Forecast by Species, 2020-2035
  • Table 37: Eastern Europe Market Value (USD billion) Forecast by Source, 2020-2035
  • Table 38: Eastern Europe Market Volume (Kilotons) Forecast by Source, 2020-2035
  • Table 39: Eastern Europe Market Value (USD billion) Forecast by Application, 2020-2035
  • Table 40: Eastern Europe Market Volume (Kilotons) Forecast by Application, 2020-2035
  • Table 41: East Asia Market Value (USD billion) Forecast by Country, 2020-2035
  • Table 42: East Asia Market Volume (Kilotons) Forecast by Country, 2020-2035
  • Table 43: East Asia Market Value (USD billion) Forecast by Species, 2020-2035
  • Table 44: East Asia Market Volume (Kilotons) Forecast by Species, 2020-2035
  • Table 45: East Asia Market Value (USD billion) Forecast by Source, 2020-2035
  • Table 46: East Asia Market Volume (Kilotons) Forecast by Source, 2020-2035
  • Table 47: East Asia Market Value (USD billion) Forecast by Application, 2020-2035
  • Table 48: East Asia Market Volume (Kilotons) Forecast by Application, 2020-2035
  • Table 49: South Asia & Pacific Market Value (USD billion) Forecast by Country, 2020-2035
  • Table 50: South Asia & Pacific Market Volume (Kilotons) Forecast by Country, 2020-2035
  • Table 51: South Asia & Pacific Market Value (USD billion) Forecast by Species, 2020-2035
  • Table 52: South Asia & Pacific Market Volume (Kilotons) Forecast by Species, 2020-2035
  • Table 53: South Asia & Pacific Market Value (USD billion) Forecast by Source, 2020-2035
  • Table 54: South Asia & Pacific Market Volume (Kilotons) Forecast by Source, 2020-2035
  • Table 55: South Asia & Pacific Market Value (USD billion) Forecast by Application, 2020-2035
  • Table 56: South Asia & Pacific Market Volume (Kilotons) Forecast by Application, 2020-2035
  • Table 57: Middle East and Africa Market Value (USD billion) Forecast by Country, 2020-2035
  • Table 58: Middle East and Africa Market Volume (Kilotons) Forecast by Country, 2020-2035
  • Table 59: Middle East and Africa Market Value (USD billion) Forecast by Species, 2020-2035
  • Table 60: Middle East and Africa Market Volume (Kilotons) Forecast by Species, 2020-2035
  • Table 61: Middle East and Africa Market Value (USD billion) Forecast by Source, 2020-2035
  • Table 62: Middle East and Africa Market Volume (Kilotons) Forecast by Source, 2020-2035
  • Table 63: Middle East and Africa Market Value (USD billion) Forecast by Application, 2020-2035
  • Table 64: Middle East and Africa Market Volume (Kilotons) Forecast by Application, 2020-2035

List of Figures

  • Figure 1: Global Market Volume (Kilotons) Forecast 2020-2035
  • Figure 2: Global Market Pricing Analysis
  • Figure 3: Global Market Value (USD billion) Forecast 2020-2035
  • Figure 4: Global Market Value Share and BPS Analysis by Species, 2025 and 2035
  • Figure 5: Global Market Y-o-Y Growth Comparison by Species, 2025-2035
  • Figure 6: Global Market Attractiveness Analysis by Species
  • Figure 7: Global Market Value Share and BPS Analysis by Source, 2025 and 2035
  • Figure 8: Global Market Y-o-Y Growth Comparison by Source, 2025-2035
  • Figure 9: Global Market Attractiveness Analysis by Source
  • Figure 10: Global Market Value Share and BPS Analysis by Application, 2025 and 2035
  • Figure 11: Global Market Y-o-Y Growth Comparison by Application, 2025-2035
  • Figure 12: Global Market Attractiveness Analysis by Application
  • Figure 13: Global Market Value (USD billion) Share and BPS Analysis by Region, 2025 and 2035
  • Figure 14: Global Market Y-o-Y Growth Comparison by Region, 2025-2035
  • Figure 15: Global Market Attractiveness Analysis by Region
  • Figure 16: North America Market Incremental $ Opportunity, 2025-2035
  • Figure 17: Latin America Market Incremental $ Opportunity, 2025-2035
  • Figure 18: Western Europe Market Incremental $ Opportunity, 2025-2035
  • Figure 19: Eastern Europe Market Incremental $ Opportunity, 2025-2035
  • Figure 20: East Asia Market Incremental $ Opportunity, 2025-2035
  • Figure 21: South Asia & Pacific Market Incremental $ Opportunity, 2025-2035
  • Figure 22: Middle East and Africa Market Incremental $ Opportunity, 2025-2035
  • Figure 23: North America Market Value Share and BPS Analysis by Country, 2025 and 2035
  • Figure 24: North America Market Value Share and BPS Analysis by Species, 2025 and 2035
  • Figure 25: North America Market Y-o-Y Growth Comparison by Species, 2025-2035
  • Figure 26: North America Market Attractiveness Analysis by Species
  • Figure 27: North America Market Value Share and BPS Analysis by Source, 2025 and 2035
  • Figure 28: North America Market Y-o-Y Growth Comparison by Source, 2025-2035
  • Figure 29: North America Market Attractiveness Analysis by Source
  • Figure 30: North America Market Value Share and BPS Analysis by Application, 2025 and 2035
  • Figure 31: North America Market Y-o-Y Growth Comparison by Application, 2025-2035
  • Figure 32: North America Market Attractiveness Analysis by Application
  • Figure 33: Latin America Market Value Share and BPS Analysis by Country, 2025 and 2035
  • Figure 34: Latin America Market Value Share and BPS Analysis by Species, 2025 and 2035
  • Figure 35: Latin America Market Y-o-Y Growth Comparison by Species, 2025-2035
  • Figure 36: Latin America Market Attractiveness Analysis by Species
  • Figure 37: Latin America Market Value Share and BPS Analysis by Source, 2025 and 2035
  • Figure 38: Latin America Market Y-o-Y Growth Comparison by Source, 2025-2035
  • Figure 39: Latin America Market Attractiveness Analysis by Source
  • Figure 40: Latin America Market Value Share and BPS Analysis by Application, 2025 and 2035
  • Figure 41: Latin America Market Y-o-Y Growth Comparison by Application, 2025-2035
  • Figure 42: Latin America Market Attractiveness Analysis by Application
  • Figure 43: Western Europe Market Value Share and BPS Analysis by Country, 2025 and 2035
  • Figure 44: Western Europe Market Value Share and BPS Analysis by Species, 2025 and 2035
  • Figure 45: Western Europe Market Y-o-Y Growth Comparison by Species, 2025-2035
  • Figure 46: Western Europe Market Attractiveness Analysis by Species
  • Figure 47: Western Europe Market Value Share and BPS Analysis by Source, 2025 and 2035
  • Figure 48: Western Europe Market Y-o-Y Growth Comparison by Source, 2025-2035
  • Figure 49: Western Europe Market Attractiveness Analysis by Source
  • Figure 50: Western Europe Market Value Share and BPS Analysis by Application, 2025 and 2035
  • Figure 51: Western Europe Market Y-o-Y Growth Comparison by Application, 2025-2035
  • Figure 52: Western Europe Market Attractiveness Analysis by Application
  • Figure 53: Eastern Europe Market Value Share and BPS Analysis by Country, 2025 and 2035
  • Figure 54: Eastern Europe Market Value Share and BPS Analysis by Species, 2025 and 2035
  • Figure 55: Eastern Europe Market Y-o-Y Growth Comparison by Species, 2025-2035
  • Figure 56: Eastern Europe Market Attractiveness Analysis by Species
  • Figure 57: Eastern Europe Market Value Share and BPS Analysis by Source, 2025 and 2035
  • Figure 58: Eastern Europe Market Y-o-Y Growth Comparison by Source, 2025-2035
  • Figure 59: Eastern Europe Market Attractiveness Analysis by Source
  • Figure 60: Eastern Europe Market Value Share and BPS Analysis by Application, 2025 and 2035
  • Figure 61: Eastern Europe Market Y-o-Y Growth Comparison by Application, 2025-2035
  • Figure 62: Eastern Europe Market Attractiveness Analysis by Application
  • Figure 63: East Asia Market Value Share and BPS Analysis by Country, 2025 and 2035
  • Figure 64: East Asia Market Value Share and BPS Analysis by Species, 2025 and 2035
  • Figure 65: East Asia Market Y-o-Y Growth Comparison by Species, 2025-2035
  • Figure 66: East Asia Market Attractiveness Analysis by Species
  • Figure 67: East Asia Market Value Share and BPS Analysis by Source, 2025 and 2035
  • Figure 68: East Asia Market Y-o-Y Growth Comparison by Source, 2025-2035
  • Figure 69: East Asia Market Attractiveness Analysis by Source
  • Figure 70: East Asia Market Value Share and BPS Analysis by Application, 2025 and 2035
  • Figure 71: East Asia Market Y-o-Y Growth Comparison by Application, 2025-2035
  • Figure 72: East Asia Market Attractiveness Analysis by Application
  • Figure 73: South Asia & Pacific Market Value Share and BPS Analysis by Country, 2025 and 2035
  • Figure 74: South Asia & Pacific Market Value Share and BPS Analysis by Species, 2025 and 2035
  • Figure 75: South Asia & Pacific Market Y-o-Y Growth Comparison by Species, 2025-2035
  • Figure 76: South Asia & Pacific Market Attractiveness Analysis by Species
  • Figure 77: South Asia & Pacific Market Value Share and BPS Analysis by Source, 2025 and 2035
  • Figure 78: South Asia & Pacific Market Y-o-Y Growth Comparison by Source, 2025-2035
  • Figure 79: South Asia & Pacific Market Attractiveness Analysis by Source
  • Figure 80: South Asia & Pacific Market Value Share and BPS Analysis by Application, 2025 and 2035
  • Figure 81: South Asia & Pacific Market Y-o-Y Growth Comparison by Application, 2025-2035
  • Figure 82: South Asia & Pacific Market Attractiveness Analysis by Application
  • Figure 83: Middle East and Africa Market Value Share and BPS Analysis by Country, 2025 and 2035
  • Figure 84: Middle East and Africa Market Value Share and BPS Analysis by Species, 2025 and 2035
  • Figure 85: Middle East and Africa Market Y-o-Y Growth Comparison by Species, 2025-2035
  • Figure 86: Middle East and Africa Market Attractiveness Analysis by Species
  • Figure 87: Middle East and Africa Market Value Share and BPS Analysis by Source, 2025 and 2035
  • Figure 88: Middle East and Africa Market Y-o-Y Growth Comparison by Source, 2025-2035
  • Figure 89: Middle East and Africa Market Attractiveness Analysis by Source
  • Figure 90: Middle East and Africa Market Value Share and BPS Analysis by Application, 2025 and 2035
  • Figure 91: Middle East and Africa Market Y-o-Y Growth Comparison by Application, 2025-2035
  • Figure 92: Middle East and Africa Market Attractiveness Analysis by Application
  • Figure 93: Global Market - Tier Structure Analysis
  • Figure 94: Global Market - Company Share Analysis

Frequently Asked Questions

What is the projected size of the microalgae market in 2025?

The market size is valued at USD 13.7 billion in 2025.

What is the outlook on the microalgae market demand by 2035?

The market is forecasted to reach USD 29.6 billion by 2035, reflecting a CAGR of 8.0%.

Which species type leads the microalgae market in 2025?

Spirulina is expected to lead the market with a 38% share in 2025.

What is the projected share of marine water in the source segment by 2025?

Marine water is projected to account for a 45% share of the market in 2025.

Which country is projected to have the fastest-growing microalgae market?

The USA is anticipated to be the fastest-growing market with a CAGR of 8.2% from 2025 to 2035.

Explore Similar Insights

Future Market Insights

Microalgae Market