Algae Omega Market Size and Share Forecast Outlook 2025 to 2035

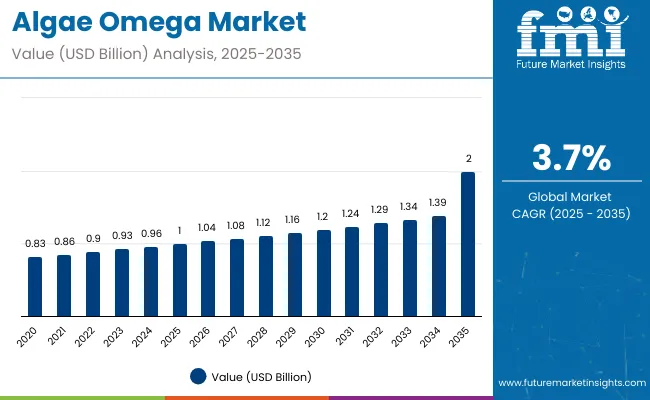
The algae omega market is to be valued at USD 1.0 billion in 2025 and is projected to reach USD 2.0 billion by 2035, registering a compound annual growth rate (CAGR) of 3.7% over the forecast period. The market adds an absolute dollar opportunity of USD 1.0 billion during this period. This reflects a 2.0 times growth at a CAGR of 3.7%. The market evolution will be shaped by rising consumer demand for plant-based omega sources, growth in dietary supplements and functional foods, and sustainability concerns driving the shift away from fish oil.
Quick Stats for Algae Omega Market

  • Algae Omega Market Value (2025): USD 1.0 billion
  • Algae Omega Market Forecast Value (2035): USD 2.0 billion
  • Algae Omega Market Forecast CAGR (2025-2035): 3.7%
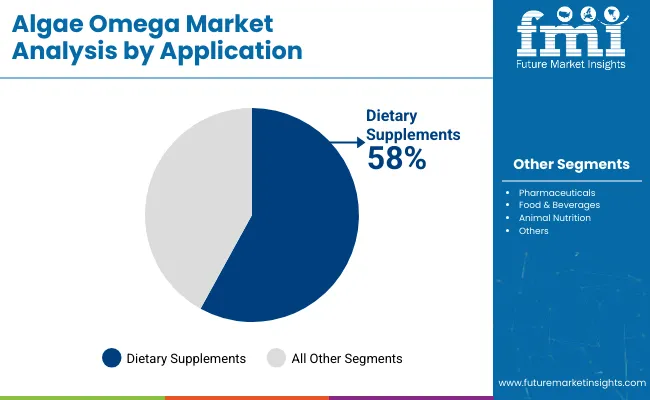
  • Leading Segment in Algae Omega Market (2025): Dietary Supplements (58% market share)
  • Key Growth Regions in Algae Omega Market: North America, Europe, and Asia-Pacific
  • Top Players in Algae Omega Market: BASF SE, Koninklijke DSM NV, Archer Daniels Midland Company, Nordic Naturals, and Cellana Inc.

Algae Omega Market

Metric Value
Estimated Size (2025E) USD 1 billion
Projected Value (2035F) USD 2 billion
CAGR (2025 to 2035) 3.7%

By 2030, the market is likely to reach USD 1.5 billion, accounting for USD 0.5 billion in incremental value over the first half of the decade. The remaining USD 0.5 billion is expected during the second half, suggesting a balanced growth pattern supported by strong expansion in North America, Europe, and Asia-Pacific.

Companies such as BASF SE, Koninklijke DSM NV, Archer Daniels Midland Company, and Qualitas Health are strengthening their market positions through investments in R&D, large-scale algae cultivation, and partnerships with nutraceutical and infant formula manufacturers. Strategic focus is on improving bioavailability, product stability, and sustainability certifications, which will be key differentiators in the competitive landscape.

The market holds a strong position across its parent industries, reflecting its rising adoption in nutraceuticals, functional foods, infant nutrition, and pharmaceuticals. Within the dietary supplements category, algae omega contributes notably with an estimated 58% share, as consumers increasingly shift toward plant-based omega-3 sources. In the functional foods and beverages market, its share is estimated at around 12%, supported by fortified dairy, bakery, and beverage formulations

. Within the omega-3 ingredients market, algae omega accounts for nearly 25%, reflecting its growing appeal as a sustainable alternative to fish oil. In the infant formula segment, its share is 18%, driven by regulatory approvals and clinical evidence supporting DHA benefits. Across these parent markets, algae omega’s contribution underscores both its nutritional importance and sustainability advantage.

The market is being driven by rising health awareness, expanding demand for plant-based alternatives, and increasing incorporation of DHA/EPA in functional nutrition. Innovations are being observed in microencapsulation, bioavailability enhancement, and cost-efficient algae cultivation technologies, aligning with consumer preferences for purity and sustainability.

Developments include capacity expansions in North America, Europe, and Asia-Pacific, where nutraceutical and infant nutrition demand is accelerating. Trends show a shift toward vegan, contaminant-free, and eco-friendly omega sources; however, algae omega continues to face cost challenges compared to fish oil. Growing regulatory support, sustainability certifications, and strategic collaborations among global and regional players are shaping R&D directions and influencing competitive positioning.

Why is the Algae Omega Market Growing?

Algae omega’s unique ability to deliver plant-based, sustainable sources of DHA and EPA is driving its adoption across global nutrition industries. Its functional benefits, including support for cognitive, cardiovascular, and prenatal health, make it indispensable in dietary supplements, infant nutrition, functional foods, and pharmaceuticals, where purity, efficacy, and sustainability are critical.

Rising demand for vegan and contaminant-free alternatives to fish oil is further propelling market growth, supported by increasing consumer health awareness, clean-label product preferences, and expansion of the nutraceutical sector. Technological advancements in microalgae cultivation, bioavailability improvement, and microencapsulation are enhancing product quality, stability, and cost efficiency, making algae omega more competitive in mainstream applications.

Government support for sustainable nutrition initiatives, coupled with regulatory approvals for DHA/EPA inclusion in infant formulas and fortified foods, is strengthening the market outlook. As industries increasingly prioritize sustainability, product differentiation, and scalability, algae omega continues to gain traction. With manufacturers and end-users focusing on innovation, certifications, and partnerships for large-scale distribution, the market is set to witness steady expansion across dietary supplements, functional foods, and clinical nutrition applications.

Algae Omega Market Analysis by Top Investment Segments

The market is segmented by type, form, concentration, sales channel, packaging, application, and region. By type, the market is categorized into EPA (Eicosapentaenoic acid), ALA (Alpha-linolenic acid), and DHA (Docosahexaenoic acid). By form, the market is segmented into capsules, powder, and liquid. By concentration, the market is divided into concentrated, high-concentrated, and low-concentrated variants.

By sales channel, the market is bifurcated into online and offline distribution. By packaging, the market is segmented into tetra packs, bulk, and bottles. By application, the market is segmented into dietary supplements, pharmaceuticals, food & beverages, animal nutrition, and others. Regionally, the market spans across North America, Latin America, Western Europe, Eastern Europe, Balkans & Baltic, Russia & Belarus, Central Asia, East Asia, South Asia & Pacific, and the Middle East & Africa.
By Application, Dietary Supplements Account for 58% of the Market Share

Algae Omega Market By Application

The dietary supplements segment dominates the application category with 58% of the market share in 2025, driven by rising consumer preference for plant-based omega-3 sources. Algae-derived DHA and EPA are increasingly used in capsules, soft gels, and gummies targeted at heart health, cognitive support, and prenatal nutrition.

Manufacturers favor algae omega in dietary supplements because it offers a sustainable, vegan, and contaminant-free alternative to traditional fish oil, aligning with clean-label and eco-conscious consumer demand. Its clinical backing for brain, eye, and cardiovascular health further cements its leadership in this category.

Ongoing innovations in bioavailability enhancement, taste masking, and microencapsulation technologies are improving product acceptance. With growing adoption among health-conscious, vegetarian, and vegan populations, the dietary supplements segment is expected to remain the cornerstone of algae omega consumption globally.
By Type, DHA (Docosahexaenoic Acid) Accounts for 45% of the Market Share

Algae Omega Market By Type

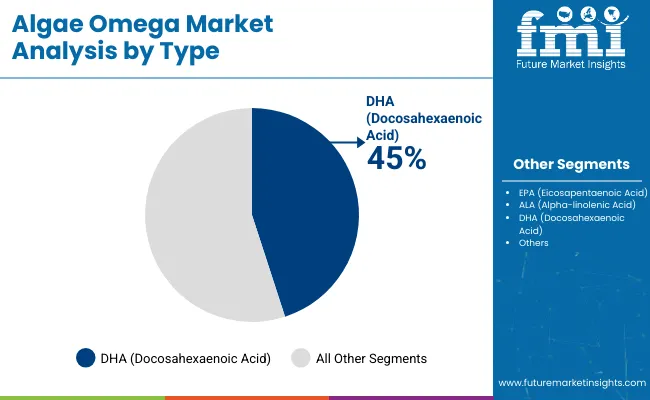
The DHA segment holds a dominant position with 45% of the market share in the type category, supported by its extensive applications in infant formula, nutraceuticals, and clinical nutrition. DHA derived from algae is a primary omega-3 fatty acid essential for brain, eye, and prenatal development, making it the most in-demand algae omega type.

Infant formula manufacturers, in particular, prefer algae-derived DHA due to regulatory approvals, purity, and traceability, which help meet safety and sustainability standards. Similarly, supplement makers use algae DHA as a direct alternative to fish-derived DHA, enabling broader market access to vegetarian and vegan consumers.

Investments in large-scale algae cultivation, improved extraction methods, and strain optimization are enhancing DHA yields and reducing production costs. With its strong clinical evidence and broad industry adoption, DHA is expected to retain its leadership position, driving the majority of revenue growth within the algae omega market.

What are the Drivers, Restraints, and Key Trends of the Algae Omega Market?

In 2024, global algae omega demand grew steadily, with North America and Europe together accounting for over 55% of total consumption. Applications include dietary supplements, infant nutrition, functional foods, pharmaceuticals, and animal nutrition. Manufacturers are investing in advanced algae cultivation, improved extraction methods, and microencapsulation technologies to enhance bioavailability, stability, and sustainability. Cost-effectiveness, clean-label positioning, and plant-based advantages continue to support market penetration. Algae omega products are increasingly being adopted in health-conscious and vegan formulations, further driving market growth.

Rising Health Awareness and Nutritional Demand Drives Algae Omega Adoption

The dietary supplements and infant nutrition sectors are the largest consumers of algae omega, leveraging its high DHA/EPA content, vegan origin, and contaminant-free profile. With global demand for heart health, cognitive support, and prenatal nutrition increasing, algae-derived omega-3 oils are witnessing expanded adoption. Algae omega is estimated to account for a significant share of global omega-3 consumption, particularly in dietary supplements, where it offers a sustainable alternative to fish oil. Rising awareness of sustainable nutrition, along with expansion of functional foods and fortified beverages, further strengthens growth prospects.

High Production Costs and Regulatory Approval Timelines Restrain Expansion

Market growth faces limitations due to high production costs compared to fish oil, limited large-scale algae cultivation infrastructure, and the need for continuous R&D in strain optimization. Regulatory approval processes for novel algae strains and fortified applications can delay product launches in certain regions. Price sensitivity in emerging markets also constrains adoption, as fish oil remains a lower-cost alternative. These restraints place pressure on manufacturers to enhance cost efficiency, improve yields, and maintain product traceability, while balancing scalability and affordability.
Algae Omega Market Analysis by Top Countries

Country Wise Analysis Of Algae Omega Market

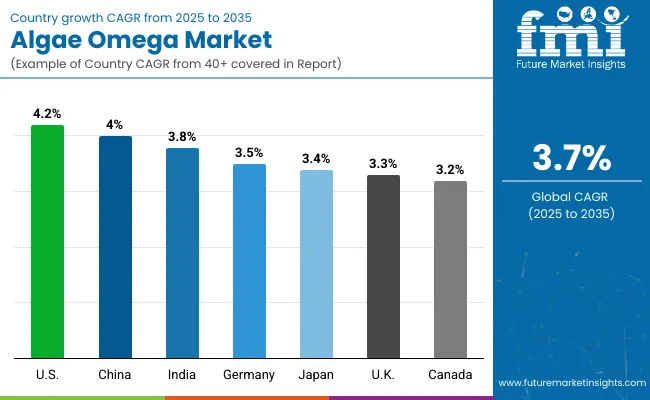
Countries CAGR (2025 to 2035)
USA 4.2%
China 4.0%
India 3.8%
Germany 3.5%
Japan 3.4%
UK 3.3%
Canada 3.2%

The algae omega market shows varied growth trajectories across the top seven countries. The USA leads with the highest projected CAGR of 4.2% from 2025 to 2035, supported by strong demand for dietary supplements, infant nutrition, and functional foods. China maintains steady growth at 4.0%, driven by increasing health awareness, rising middle-class incomes, and expansion of nutraceutical manufacturing.

India follows at 3.8%, benefiting from growing supplement consumption and government initiatives promoting health and wellness. Germany (3.5%) and Japan (3.4%) show moderate growth, supported by established supplement markets and regulatory approvals for DHA/EPA inclusion. TheUK (3.3%) and Canada (3.2%) experience steady growth, reflecting rising adoption of vegan and clean-label omega products.

The report covers an in-depth analysis of 40+ countries; seven top-performing OECD countries are highlighted below.

Growth Outlook of the Algae Omega Market in the USA

The algae omega market in the USA is projected to expand at a CAGR of 4.2% from 2025 to 2035, driven by strong demand for dietary supplements, infant nutrition, and functional foods. Health-conscious consumers increasingly prefer plant-based, contaminant-free DHA and EPA, supporting market penetration. Manufacturers are investing in microalgae cultivation, bioavailability enhancement, and microencapsulation technologies to meet growing demand.

Key Statistics:

  • Rising consumer preference for plant-based and contaminant-free DHA/EPA.
  • Expansion of algae omega incorporation in dietary supplements and infant nutrition.
  • Investment in advanced cultivation and processing technologies to enhance product quality.

China Algae Omega Market Outlook

Revenue from algae omega in China is projected to grow at a CAGR of 4.0% from 2025 to 2035, reflecting rising nutraceutical adoption and functional food fortification. Major consumption hubs include Guangdong and Jiangsu provinces, where supplement and infant formula manufacturing are concentrated. Companies are investing in sustainable production methods and large-scale algae cultivation to meet domestic and export demands.

Key Statistics:

  • Increasing adoption in dietary supplements and fortified foods.
  • Expansion of large-scale and sustainable algae cultivation operations.
  • Investment in quality enhancement and production optimization technologies.

Expansion of Algae Omega Applications in India

Sales of algae omega in India are expected to grow at a CAGR of 3.8% from 2025 to 2035, driven by rising health awareness, dietary supplement adoption, and infant nutrition fortification. Supplement manufacturers in Maharashtra, Karnataka, and Delhi are expanding production capacity, relying increasingly on algae-derived DHA/EPA. Growing emphasis on clean-label and plant-based products is encouraging investment in sustainable production technologies.

Key Statistics:

  • Growing incorporation of algae DHA/EPA in supplements and infant nutrition.
  • Expansion of clean-label and plant-based product offerings.
  • Investment in sustainable algae production technologies.

Dynamics of the Algae Omega Market in Germany

Revenue from algae omega in Germany is projected to grow at a CAGR of 3.5% from 2025 to 2035, supported by high-value dietary supplements and functional foods. Manufacturers focus on traceable, contaminant-free DHA/EPA sources to meet stringent food and supplement regulations. The clean-label and vegan positioning of algae omega strengthens its appeal in both retail and clinical nutrition segments.

Key Statistics:

  • High adoption in supplements and functional foods emphasizing purity.
  • Expansion of traceable and contaminant-free production practices.
  • Growing consumer preference for clean-label and vegan products.

Growth Opportunities of the Algae Omega Market in Japan

Sales of algae omega in Japan are projected to grow at a CAGR of 3.4% from 2025 to 2035, reflecting rising health-conscious consumer demand and integration in infant nutrition and functional beverages. Japanese manufacturers emphasize high-purity DHA/EPA and clinical substantiation, supporting widespread adoption. Innovation in microencapsulation and taste-masking technologies is enhancing product appeal, while partnerships with global nutraceutical brands are expanding market reach. Government initiatives promoting maternal and child health supplements are further boosting demand.

Key Statistics:

  • Increasing incorporation in infant nutrition and functional beverages.
  • Expansion of high-purity extraction and innovative delivery technologies.
  • Growth of partnerships between local and global nutraceutical manufacturers.

Growth Assessment for Algae Omega Market in the UK

The algae omega market in the UK is expected to expand at a CAGR of 3.3% from 2025 to 2035, driven by dietary supplements and vegan/plant-based nutrition trends. Regulatory emphasis on supplement safety and clean-label standards shapes market dynamics. Manufacturers focus on sustainable sourcing and eco-certified production to meet consumer and retailer requirements. Rising popularity of functional foods and fortified beverages supports category expansion, while strategic collaborations between algae producers and supplement brands strengthen distribution networks.

Key Statistics:

  • Rising demand for vegan and plant-based omega-3 products.
  • Expansion of sustainable and eco-certified algae sourcing.
  • Growth of functional foods and fortified beverages incorporating algae DHA/EPA.

Clean-Label Demand for Algae Omega Market in Canada

Demand for algae omega in Canada is projected to grow at a CAGR of 3.2% from 2025 to 2035, supported by increasing supplement consumption and functional food fortification. Manufacturers focus on sustainable algae sourcing and quality assurance, aligning with consumer demand for vegan and clean-label products. Growing interest in preventive healthcare and wellness supplements is driving consumer adoption, while investments in scalable cultivation technologies are enhancing supply stability and cost efficiency.

Key Statistics:
  • Increasing incorporation in dietary supplements and fortified foods.
  • Expansion of sustainable algae sourcing and quality assurance practices.
  • Investment in scalable cultivation and downstream processing technologies.

Competitive Landscape of the Algae Omega Market

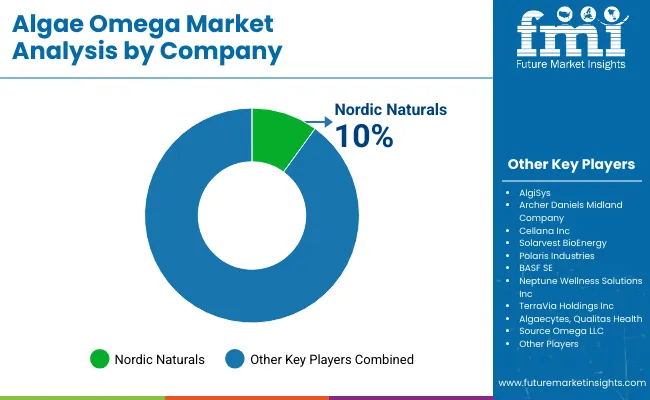
Algae Omega Market By Company

The market is moderately consolidated, comprising a mix of multinational nutraceutical corporations, specialized algae producers, and regional supplement manufacturers. Key players include Nordic Naturals, AlgiSys, Archer Daniels Midland Company, Cellana Inc, Solarvest BioEnergy, BASF SE, Neptune Wellness Solutions Inc, Algaecytes, Qualitas Health, Source Omega LLC, Novotech Nutraceuticals Inc, Koninklijke DSM NV. These companies leverage advanced algae cultivation technologies, extraction methods, and extensive distribution networks to supply dietary supplements, infant nutrition, functional foods, pharmaceuticals, and animal nutrition products.

The market is characterized by a significant share of DHA-based algae omega, accounting for 45% in 2025, driven by its high demand in infant nutrition and cognitive health supplements. Capsules and powders dominate the form segment due to longer shelf life, ease of dosing, and better bioavailability, while liquids are gaining traction in fortified beverages and functional foods. Companies are emphasizing product innovation, clinical substantiation, and quality assurance to meet evolving consumer expectations and regulatory standards.

Strategic initiatives such as mergers and acquisitions, partnerships, regional expansions, and R&D in bioavailability and sustainable cultivation are common among market players seeking to strengthen their presence. Firms are also focusing on sustainable sourcing, traceability, and eco-certified production to address consumer demand for plant-based, contaminant-free omega-3 oils. In summary, the algae omega market is evolving with established and emerging companies striving to enhance their competitive positions through innovation, sustainability initiatives, and expanded global reach, shaping the industry’s dynamics and growth trajectory.

Scope of Report

Items Values
Quantitative Units (2025) USD 1 billion
Form Capsule, Powder, and Liquid
Type DHA (Docosahexaenoic acid), EPA (Eicosapentaenoic acid), and ALA (Alpha- linolenic acid)
Concentration Concentrated, High-Concentrated, and Low-Concentrated
Sales Channel Online and Offline
Packaging Tetra Pack, Bulk, and Bottle
Application Dietary Supplements, Pharmaceuticals, Food & Beverages, Animal Nutrition, and Others
Regions Covered North America, Latin America, Western Europe, Eastern Europe, Balkans & Baltic, Russia & Belarus, Central Asia, East Asia, South Asia & Pacific, and Middle East & Africa
Country Covered United States, Canada, United Kingdom, Germany, France, China, Japan, South Korea, Brazil, Australia and 40+ countries
Key Companies Profiled Nordic Naturals, AlgiSys , Archer Daniels Midland Company, Cellana Inc , Solarvest BioEnergy , BASF SE, Neptune Wellness Solutions Inc , Algaecytes , Qualitas Health, Source Omega LLC, Novotech Nutraceuticals Inc , Koninklijke DSM NV, and Others
Additional Attributes Dollar sales by type and application, regional demand trends, competitive landscape, consumer preferences for plant-based vs. traditional omega-3, innovations in algae extraction, quality standardization, and sustainable sourcing practices

Key Segmentation

By Type:

As per Type, the industry has been categorized into EPA (Eicosapentaenoic acid), ALA (Alpha-linolenic acid) and DHA (Docosahexaenoic acid).

By Form:

As per Form, the industry has been categorized into Capsule, Powder and Liquid.

By Concentration:

As per Concentration, the industry has been categorized into Concentrated, High-Concentrated and Low-Concentrated.

By Sales Channel:

As per Sales Channel, the industry has been categorized into Online and Offline.

By Packaging:

As per Packaging, the industry has been categorized into Tetra Pack, Bulk and Bottle.

By Application:

As per Application, the industry has been categorized into Dietary Supplements, Pharmaceuticals, Food & Beverages, Animal Nutrition and Others.

By Region:

Industry analysis has been carried out in key countries of North America, Latin America, Western Europe Eastern Europe, Balkans & Baltic, Russia & Belarus, Central Asia, East Asia, South Asia & Pacific, and Middle East & Africa.

Table of Content

  1. Executive Summary
    • Global Market Outlook
    • Demand-side Trends
    • Supply-side Trends
    • Technology Roadmap Analysis
    • Analysis and Recommendations
  2. Market Overview
    • Market Coverage / Taxonomy
    • Market Definition / Scope / Limitations
  3. Market Background
    • Market Dynamics
      • Drivers
      • Restraints
      • Opportunity
      • Trends
    • Scenario Forecast
      • Demand in Optimistic Scenario
      • Demand in Likely Scenario
      • Demand in Conservative Scenario
    • Opportunity Map Analysis
    • Product Life Cycle Analysis
    • Supply Chain Analysis
      • Supply Side Participants and their Roles
        • Producers
        • Mid-Level Participants (Traders/ Agents/ Brokers)
        • Wholesalers and Distributors
      • Value Added and Value Created at Node in the Supply Chain
      • List of Raw Material Suppliers
      • List of Existing and Potential Buyer’s
    • Investment Feasibility Matrix
    • Value Chain Analysis
      • Profit Margin Analysis
      • Wholesalers and Distributors
      • Retailers
    • PESTLE and Porter’s Analysis
    • Regulatory Landscape
      • By Key Regions
      • By Key Countries
    • Regional Parent Market Outlook
    • Production and Consumption Statistics
    • Import and Export Statistics
  4. Global Market Analysis 2020 to 2024 and Forecast, 2025 to 2035
    • Historical Market Size Value (USD Billion) & Volume (Metric Tons) Analysis, 2020 to 2024
    • Current and Future Market Size Value (USD Billion) & Volume (Metric Tons) Projections, 2025 to 2035
      • Y-o-Y Growth Trend Analysis
      • Absolute $ Opportunity Analysis
  5. Global Market Pricing Analysis 2020 to 2024 and Forecast 2025 to 2035
  6. Global Market Analysis 2020 to 2024 and Forecast 2025 to 2035, By Type
    • Introduction / Key Findings
    • Historical Market Size Value (USD Billion) & Volume (Metric Tons) Analysis By Type, 2020 to 2024
    • Current and Future Market Size Value (USD Billion) & Volume (Metric Tons) Analysis and Forecast By Type, 2025 to 2035
      • EPA (Eicosapentaenoic acid)
      • ALA (Alpha-linolenic acid)
      • DHA (Docosahexaenoic acid)
    • Y-o-Y Growth Trend Analysis By Type, 2020 to 2024
    • Absolute $ Opportunity Analysis By Type, 2025 to 2035
  7. Global Market Analysis 2020 to 2024 and Forecast 2025 to 2035, By Form
    • Introduction / Key Findings
    • Historical Market Size Value (USD Billion) & Volume (Metric Tons) Analysis By Form, 2020 to 2024
    • Current and Future Market Size Value (USD Billion) & Volume (Metric Tons) Analysis and Forecast By Form, 2025 to 2035
      • Capsule
      • Powder
      • Liquid
    • Y-o-Y Growth Trend Analysis By Form, 2020 to 2024
    • Absolute $ Opportunity Analysis By Form, 2025 to 2035
  8. Global Market Analysis 2020 to 2024 and Forecast 2025 to 2035, By Concentration
    • Introduction / Key Findings
    • Historical Market Size Value (USD Billion) & Volume (Metric Tons) Analysis By Concentration, 2020 to 2024
    • Current and Future Market Size Value (USD Billion) & Volume (Metric Tons) Analysis and Forecast By Concentration, 2025 to 2035
      • Concentrated
      • High-Concentrated
      • Low-Concentrated
    • Y-o-Y Growth Trend Analysis By Concentration, 2020 to 2024
    • Absolute $ Opportunity Analysis By Concentration, 2025 to 2035
  9. Global Market Analysis 2020 to 2024 and Forecast 2025 to 2035, By Sales Channel
    • Introduction / Key Findings
    • Historical Market Size Value (USD Billion) & Volume (Metric Tons) Analysis By Sales Channel, 2020 to 2024
    • Current and Future Market Size Value (USD Billion) & Volume (Metric Tons) Analysis and Forecast By Sales Channel, 2025 to 2035
      • Online
      • Offline
    • Y-o-Y Growth Trend Analysis By Sales Channel, 2020 to 2024
    • Absolute $ Opportunity Analysis By Sales Channel, 2025 to 2035
  10. Global Market Analysis 2020 to 2024 and Forecast 2025 to 2035, By Packaging
    • Introduction / Key Findings
    • Historical Market Size Value (USD Billion) & Volume (Metric Tons) Analysis By Packaging, 2020 to 2024
    • Current and Future Market Size Value (USD Billion) & Volume (Metric Tons) Analysis and Forecast By Packaging, 2025 to 2035
      • Tetra Pack
      • Bulk
      • Bottle
    • Y-o-Y Growth Trend Analysis By Packaging, 2020 to 2024
    • Absolute $ Opportunity Analysis By Packaging, 2025 to 2035
  11. Global Market Analysis 2020 to 2024 and Forecast 2025 to 2035, By Application
    • Introduction / Key Findings
    • Historical Market Size Value (USD Billion) & Volume (Metric Tons) Analysis By Application, 2020 to 2024
    • Current and Future Market Size Value (USD Billion) & Volume (Metric Tons) Analysis and Forecast By Application, 2025 to 2035
      • Dietary Supplements
      • Pharmaceuticals
      • Food & Beverages
      • Animal Nutrition
      • Others
    • Y-o-Y Growth Trend Analysis By Application, 2020 to 2024
    • Absolute $ Opportunity Analysis By Application, 2025 to 2035
  12. Global Market Analysis 2020 to 2024 and Forecast 2025 to 2035, By Region
    • Introduction
    • Historical Market Size Value (USD Billion) & Volume (Metric Tons) Analysis By Region, 2020 to 2024
    • Current Market Size Value (USD Billion) & Volume (Metric Tons) Analysis and Forecast By Region, 2025 to 2035
      • North America
      • Latin America
      • Western Europe
      • Eastern Europe
      • East Asia
      • South Asia & Pacific
      • Middle East and Africa
    • Market Attractiveness Analysis By Region
  13. North America Market Analysis 2020 to 2024 and Forecast 2025 to 2035, By Country
    • Historical Market Size Value (USD Billion) & Volume (Metric Tons) Trend Analysis By Market Taxonomy, 2020 to 2024
    • Market Size Value (USD Billion) & Volume (Metric Tons) Forecast By Market Taxonomy, 2025 to 2035
      • By Country
        • USA
        • Canada
        • Mexico
      • By Type
      • By Form
      • By Concentration
      • By Sales Channel
      • By Packaging
      • By Application
    • Market Attractiveness Analysis
      • By Country
      • By Type
      • By Form
      • By Concentration
      • By Sales Channel
      • By Packaging
      • By Application
    • Key Takeaways
  14. Latin America Market Analysis 2020 to 2024 and Forecast 2025 to 2035, By Country
    • Historical Market Size Value (USD Billion) & Volume (Metric Tons) Trend Analysis By Market Taxonomy, 2020 to 2024
    • Market Size Value (USD Billion) & Volume (Metric Tons) Forecast By Market Taxonomy, 2025 to 2035
      • By Country
        • Brazil
        • Argentina
        • Rest of LATAM
      • By Type
      • By Form
      • By Concentration
      • By Sales Channel
      • By Packaging
      • By Application
    • Market Attractiveness Analysis
      • By Country
      • By Type
      • By Form
      • By Concentration
      • By Sales Channel
      • By Packaging
      • By Application
    • Key Takeaways
  15. Western Europe Market Analysis 2020 to 2024 and Forecast 2025 to 2035, By Country
    • Historical Market Size Value (USD Billion) & Volume (Metric Tons) Trend Analysis By Market Taxonomy, 2020 to 2024
    • Market Size Value (USD Billion) & Volume (Metric Tons) Forecast By Market Taxonomy, 2025 to 2035
      • By Country
        • Germany
        • Italy
        • France
        • UK
        • Spain
        • BENELUX
        • Nordic
        • Rest of W.Europe
      • By Type
      • By Form
      • By Concentration
      • By Sales Channel
      • By Packaging
      • By Application
    • Market Attractiveness Analysis
      • By Country
      • By Type
      • By Form
      • By Concentration
      • By Sales Channel
      • By Packaging
      • By Application
    • Key Takeaways
  16. Eastern Europe Market Analysis 2020 to 2024 and Forecast 2025 to 2035, By Country
    • Historical Market Size Value (USD Billion) & Volume (Metric Tons) Trend Analysis By Market Taxonomy, 2020 to 2024
    • Market Size Value (USD Billion) & Volume (Metric Tons) Forecast By Market Taxonomy, 2025 to 2035
      • By Country
        • Russia
        • Hungary
        • Poland
        • Balkan & Baltics
        • Rest of E. Europe
      • By Type
      • By Form
      • By Concentration
      • By Sales Channel
      • By Packaging
      • By Application
    • Market Attractiveness Analysis
      • By Country
      • By Type
      • By Form
      • By Concentration
      • By Sales Channel
      • By Packaging
      • By Application
    • Key Takeaways
  17. East Asia Market Analysis 2020 to 2024 and Forecast 2025 to 2035, By Country
    • Historical Market Size Value (USD Billion) & Volume (Metric Tons) Trend Analysis By Market Taxonomy, 2020 to 2024
    • Market Size Value (USD Billion) & Volume (Metric Tons) Forecast By Market Taxonomy, 2025 to 2035
      • By Country
        • China
        • Japan
        • South Korea
      • By Type
      • By Form
      • By Concentration
      • By Sales Channel
      • By Packaging
      • By Application
    • Market Attractiveness Analysis
      • By Country
      • By Type
      • By Form
      • By Concentration
      • By Sales Channel
      • By Packaging
      • By Application
    • Key Takeaways
  18. South Asia & Pacific Market Analysis 2020 to 2024 and Forecast 2025 to 2035, By Country
    • Historical Market Size Value (USD Billion) & Volume (Metric Tons) Trend Analysis By Market Taxonomy, 2020 to 2024
    • Market Size Value (USD Billion) & Volume (Metric Tons) Forecast By Market Taxonomy, 2025 to 2035
      • By Country
        • India
        • Australia & New Zealand
        • ASEAN
        • Rest of SAP
      • By Type
      • By Form
      • By Concentration
      • By Sales Channel
      • By Packaging
      • By Application
    • Market Attractiveness Analysis
      • By Country
      • By Type
      • By Form
      • By Concentration
      • By Sales Channel
      • By Packaging
      • By Application
    • Key Takeaways
  19. Middle East and Africa Market Analysis 2020 to 2024 and Forecast 2025 to 2035, By Country
    • Historical Market Size Value (USD Billion) & Volume (Metric Tons) Trend Analysis By Market Taxonomy, 2020 to 2024
    • Market Size Value (USD Billion) & Volume (Metric Tons) Forecast By Market Taxonomy, 2025 to 2035
      • By Country
        • GCC Countries
        • Northern Africa
        • South Africa
        • Turkiye
        • Rest of MEA
      • By Type
      • By Form
      • By Concentration
      • By Sales Channel
      • By Packaging
      • By Application
    • Market Attractiveness Analysis
      • By Country
      • By Type
      • By Form
      • By Concentration
      • By Sales Channel
      • By Packaging
      • By Application
    • Key Takeaways
  20. Key Countries Market Analysis
    • USA
      • Pricing Analysis
      • Market Share Analysis, 2024
        • By Type
        • By Form
        • By Concentration
        • By Sales Channel
        • By Packaging
        • By Application
    • Canada
      • Pricing Analysis
      • Market Share Analysis, 2024
        • By Type
        • By Form
        • By Concentration
        • By Sales Channel
        • By Packaging
        • By Application
    • Brazil
      • Pricing Analysis
      • Market Share Analysis, 2024
        • By Type
        • By Form
        • By Concentration
        • By Sales Channel
        • By Packaging
        • By Application
    • Mexico
      • Pricing Analysis
      • Market Share Analysis, 2024
        • By Type
        • By Form
        • By Concentration
        • By Sales Channel
        • By Packaging
        • By Application
    • Argentina
      • Pricing Analysis
      • Market Share Analysis, 2024
        • By Type
        • By Form
        • By Concentration
        • By Sales Channel
        • By Packaging
        • By Application
  21. Market Structure Analysis
    • Competition Dashboard
    • Competition Benchmarking
    • Market Share Analysis of Top Players
      • By Regional
      • By Type
      • By Form
      • By Concentration
      • By Sales Channel
      • By Packaging
      • By Application
  22. Competition Analysis
    • Competition Deep Dive
      • Nordic Naturals
        • Overview
        • Product Portfolio
        • Profitability by Market Segments (Product/Age /Sales Channel/Region)
        • Sales Footprint
        • Strategy Overview
          • Marketing Strategy
          • Product Strategy
          • Channel Strategy
      • AlgiSys
        • Overview
        • Product Portfolio
        • Profitability by Market Segments (Product/Age /Sales Channel/Region)
        • Sales Footprint
        • Strategy Overview
          • Marketing Strategy
          • Product Strategy
          • Channel Strategy
      • Archer Daniels Midland Company
        • Overview
        • Product Portfolio
        • Profitability by Market Segments (Product/Age /Sales Channel/Region)
        • Sales Footprint
        • Strategy Overview
          • Marketing Strategy
          • Product Strategy
          • Channel Strategy
      • Cellana Inc
        • Overview
        • Product Portfolio
        • Profitability by Market Segments (Product/Age /Sales Channel/Region)
        • Sales Footprint
        • Strategy Overview
          • Marketing Strategy
          • Product Strategy
          • Channel Strategy
      • Solarvest BioEnergy
        • Overview
        • Product Portfolio
        • Profitability by Market Segments (Product/Age /Sales Channel/Region)
        • Sales Footprint
        • Strategy Overview
          • Marketing Strategy
          • Product Strategy
          • Channel Strategy
      • BASF SE
        • Overview
        • Product Portfolio
        • Profitability by Market Segments (Product/Age /Sales Channel/Region)
        • Sales Footprint
        • Strategy Overview
          • Marketing Strategy
          • Product Strategy
          • Channel Strategy
      • Neptune Wellness Solutions Inc
        • Overview
        • Product Portfolio
        • Profitability by Market Segments (Product/Age /Sales Channel/Region)
        • Sales Footprint
        • Strategy Overview
          • Marketing Strategy
          • Product Strategy
          • Channel Strategy
      • TerraVia Holdings Inc
        • Overview
        • Product Portfolio
        • Profitability by Market Segments (Product/Age /Sales Channel/Region)
        • Sales Footprint
        • Strategy Overview
          • Marketing Strategy
          • Product Strategy
          • Channel Strategy
      • Algaecytes
        • Overview
        • Product Portfolio
        • Profitability by Market Segments (Product/Age /Sales Channel/Region)
        • Sales Footprint
        • Strategy Overview
          • Marketing Strategy
          • Product Strategy
          • Channel Strategy
      • Qualitas Health
        • Overview
        • Product Portfolio
        • Profitability by Market Segments (Product/Age /Sales Channel/Region)
        • Sales Footprint
        • Strategy Overview
          • Marketing Strategy
          • Product Strategy
          • Channel Strategy
      • Source Omega LLC
        • Overview
        • Product Portfolio
        • Profitability by Market Segments (Product/Age /Sales Channel/Region)
        • Sales Footprint
        • Strategy Overview
          • Marketing Strategy
          • Product Strategy
          • Channel Strategy
      • Novotech Nutraceuticals Inc
        • Overview
        • Product Portfolio
        • Profitability by Market Segments (Product/Age /Sales Channel/Region)
        • Sales Footprint
        • Strategy Overview
          • Marketing Strategy
          • Product Strategy
          • Channel Strategy
      • Koninklijke DSM NV
        • Overview
        • Product Portfolio
        • Profitability by Market Segments (Product/Age /Sales Channel/Region)
        • Sales Footprint
        • Strategy Overview
          • Marketing Strategy
          • Product Strategy
          • Channel Strategy
  23. Assumptions & Acronyms Used
  24. Research Methodology

List of Tables

  • Table 1: Global Market Value (USD Billion) Forecast by Region, 2020-2035
  • Table 2: Global Market Volume (Metric Tons) Forecast by Region, 2020-2035
  • Table 3: Global Market Value (USD Billion) Forecast by Type, 2020-2035
  • Table 4: Global Market Volume (Metric Tons) Forecast by Type, 2020-2035
  • Table 5: Global Market Value (USD Billion) Forecast by Form, 2020-2035
  • Table 6: Global Market Volume (Metric Tons) Forecast by Form, 2020-2035
  • Table 7: Global Market Value (USD Billion) Forecast by Concentration, 2020-2035
  • Table 8: Global Market Volume (Metric Tons) Forecast by Concentration, 2020-2035
  • Table 9: Global Market Value (USD Billion) Forecast by Sales Channel, 2020-2035
  • Table 10: Global Market Volume (Metric Tons) Forecast by Sales Channel, 2020-2035
  • Table 11: Global Market Value (USD Billion) Forecast by Packaging, 2020-2035
  • Table 12: Global Market Volume (Metric Tons) Forecast by Packaging, 2020-2035
  • Table 13: Global Market Value (USD Billion) Forecast by Application, 2020-2035
  • Table 14: Global Market Volume (Metric Tons) Forecast by Application, 2020-2035
  • Table 15: North America Market Value (USD Billion) Forecast by Country, 2020-2035
  • Table 16: North America Market Volume (Metric Tons) Forecast by Country, 2020-2035
  • Table 17: North America Market Value (USD Billion) Forecast by Type, 2020-2035
  • Table 18: North America Market Volume (Metric Tons) Forecast by Type, 2020-2035
  • Table 19: North America Market Value (USD Billion) Forecast by Form, 2020-2035
  • Table 20: North America Market Volume (Metric Tons) Forecast by Form, 2020-2035
  • Table 21: North America Market Value (USD Billion) Forecast by Concentration, 2020-2035
  • Table 22: North America Market Volume (Metric Tons) Forecast by Concentration, 2020-2035
  • Table 23: North America Market Value (USD Billion) Forecast by Sales Channel, 2020-2035
  • Table 24: North America Market Volume (Metric Tons) Forecast by Sales Channel, 2020-2035
  • Table 25: North America Market Value (USD Billion) Forecast by Packaging, 2020-2035
  • Table 26: North America Market Volume (Metric Tons) Forecast by Packaging, 2020-2035
  • Table 27: North America Market Value (USD Billion) Forecast by Application, 2020-2035
  • Table 28: North America Market Volume (Metric Tons) Forecast by Application, 2020-2035
  • Table 29: Latin America Market Value (USD Billion) Forecast by Country, 2020-2035
  • Table 30: Latin America Market Volume (Metric Tons) Forecast by Country, 2020-2035
  • Table 31: Latin America Market Value (USD Billion) Forecast by Type, 2020-2035
  • Table 32: Latin America Market Volume (Metric Tons) Forecast by Type, 2020-2035
  • Table 33: Latin America Market Value (USD Billion) Forecast by Form, 2020-2035
  • Table 34: Latin America Market Volume (Metric Tons) Forecast by Form, 2020-2035
  • Table 35: Latin America Market Value (USD Billion) Forecast by Concentration, 2020-2035
  • Table 36: Latin America Market Volume (Metric Tons) Forecast by Concentration, 2020-2035
  • Table 37: Latin America Market Value (USD Billion) Forecast by Sales Channel, 2020-2035
  • Table 38: Latin America Market Volume (Metric Tons) Forecast by Sales Channel, 2020-2035
  • Table 39: Latin America Market Value (USD Billion) Forecast by Packaging, 2020-2035
  • Table 40: Latin America Market Volume (Metric Tons) Forecast by Packaging, 2020-2035
  • Table 41: Latin America Market Value (USD Billion) Forecast by Application, 2020-2035
  • Table 42: Latin America Market Volume (Metric Tons) Forecast by Application, 2020-2035
  • Table 43: Western Europe Market Value (USD Billion) Forecast by Country, 2020-2035
  • Table 44: Western Europe Market Volume (Metric Tons) Forecast by Country, 2020-2035
  • Table 45: Western Europe Market Value (USD Billion) Forecast by Type, 2020-2035
  • Table 46: Western Europe Market Volume (Metric Tons) Forecast by Type, 2020-2035
  • Table 47: Western Europe Market Value (USD Billion) Forecast by Form, 2020-2035
  • Table 48: Western Europe Market Volume (Metric Tons) Forecast by Form, 2020-2035
  • Table 49: Western Europe Market Value (USD Billion) Forecast by Concentration, 2020-2035
  • Table 50: Western Europe Market Volume (Metric Tons) Forecast by Concentration, 2020-2035
  • Table 51: Western Europe Market Value (USD Billion) Forecast by Sales Channel, 2020-2035
  • Table 52: Western Europe Market Volume (Metric Tons) Forecast by Sales Channel, 2020-2035
  • Table 53: Western Europe Market Value (USD Billion) Forecast by Packaging, 2020-2035
  • Table 54: Western Europe Market Volume (Metric Tons) Forecast by Packaging, 2020-2035
  • Table 55: Western Europe Market Value (USD Billion) Forecast by Application, 2020-2035
  • Table 56: Western Europe Market Volume (Metric Tons) Forecast by Application, 2020-2035
  • Table 57: Eastern Europe Market Value (USD Billion) Forecast by Country, 2020-2035
  • Table 58: Eastern Europe Market Volume (Metric Tons) Forecast by Country, 2020-2035
  • Table 59: Eastern Europe Market Value (USD Billion) Forecast by Type, 2020-2035
  • Table 60: Eastern Europe Market Volume (Metric Tons) Forecast by Type, 2020-2035
  • Table 61: Eastern Europe Market Value (USD Billion) Forecast by Form, 2020-2035
  • Table 62: Eastern Europe Market Volume (Metric Tons) Forecast by Form, 2020-2035
  • Table 63: Eastern Europe Market Value (USD Billion) Forecast by Concentration, 2020-2035
  • Table 64: Eastern Europe Market Volume (Metric Tons) Forecast by Concentration, 2020-2035
  • Table 65: Eastern Europe Market Value (USD Billion) Forecast by Sales Channel, 2020-2035
  • Table 66: Eastern Europe Market Volume (Metric Tons) Forecast by Sales Channel, 2020-2035
  • Table 67: Eastern Europe Market Value (USD Billion) Forecast by Packaging, 2020-2035
  • Table 68: Eastern Europe Market Volume (Metric Tons) Forecast by Packaging, 2020-2035
  • Table 69: Eastern Europe Market Value (USD Billion) Forecast by Application, 2020-2035
  • Table 70: Eastern Europe Market Volume (Metric Tons) Forecast by Application, 2020-2035
  • Table 71: East Asia Market Value (USD Billion) Forecast by Country, 2020-2035
  • Table 72: East Asia Market Volume (Metric Tons) Forecast by Country, 2020-2035
  • Table 73: East Asia Market Value (USD Billion) Forecast by Type, 2020-2035
  • Table 74: East Asia Market Volume (Metric Tons) Forecast by Type, 2020-2035
  • Table 75: East Asia Market Value (USD Billion) Forecast by Form, 2020-2035
  • Table 76: East Asia Market Volume (Metric Tons) Forecast by Form, 2020-2035
  • Table 77: East Asia Market Value (USD Billion) Forecast by Concentration, 2020-2035
  • Table 78: East Asia Market Volume (Metric Tons) Forecast by Concentration, 2020-2035
  • Table 79: East Asia Market Value (USD Billion) Forecast by Sales Channel, 2020-2035
  • Table 80: East Asia Market Volume (Metric Tons) Forecast by Sales Channel, 2020-2035
  • Table 81: East Asia Market Value (USD Billion) Forecast by Packaging, 2020-2035
  • Table 82: East Asia Market Volume (Metric Tons) Forecast by Packaging, 2020-2035
  • Table 83: East Asia Market Value (USD Billion) Forecast by Application, 2020-2035
  • Table 84: East Asia Market Volume (Metric Tons) Forecast by Application, 2020-2035
  • Table 85: South Asia & Pacific Market Value (USD Billion) Forecast by Country, 2020-2035
  • Table 86: South Asia & Pacific Market Volume (Metric Tons) Forecast by Country, 2020-2035
  • Table 87: South Asia & Pacific Market Value (USD Billion) Forecast by Type, 2020-2035
  • Table 88: South Asia & Pacific Market Volume (Metric Tons) Forecast by Type, 2020-2035
  • Table 89: South Asia & Pacific Market Value (USD Billion) Forecast by Form, 2020-2035
  • Table 90: South Asia & Pacific Market Volume (Metric Tons) Forecast by Form, 2020-2035
  • Table 91: South Asia & Pacific Market Value (USD Billion) Forecast by Concentration, 2020-2035
  • Table 92: South Asia & Pacific Market Volume (Metric Tons) Forecast by Concentration, 2020-2035
  • Table 93: South Asia & Pacific Market Value (USD Billion) Forecast by Sales Channel, 2020-2035
  • Table 94: South Asia & Pacific Market Volume (Metric Tons) Forecast by Sales Channel, 2020-2035
  • Table 95: South Asia & Pacific Market Value (USD Billion) Forecast by Packaging, 2020-2035
  • Table 96: South Asia & Pacific Market Volume (Metric Tons) Forecast by Packaging, 2020-2035
  • Table 97: South Asia & Pacific Market Value (USD Billion) Forecast by Application, 2020-2035
  • Table 98: South Asia & Pacific Market Volume (Metric Tons) Forecast by Application, 2020-2035
  • Table 99: Middle East and Africa Market Value (USD Billion) Forecast by Country, 2020-2035
  • Table 100: Middle East and Africa Market Volume (Metric Tons) Forecast by Country, 2020-2035
  • Table 101: Middle East and Africa Market Value (USD Billion) Forecast by Type, 2020-2035
  • Table 102: Middle East and Africa Market Volume (Metric Tons) Forecast by Type, 2020-2035
  • Table 103: Middle East and Africa Market Value (USD Billion) Forecast by Form, 2020-2035
  • Table 104: Middle East and Africa Market Volume (Metric Tons) Forecast by Form, 2020-2035
  • Table 105: Middle East and Africa Market Value (USD Billion) Forecast by Concentration, 2020-2035
  • Table 106: Middle East and Africa Market Volume (Metric Tons) Forecast by Concentration, 2020-2035
  • Table 107: Middle East and Africa Market Value (USD Billion) Forecast by Sales Channel, 2020-2035
  • Table 108: Middle East and Africa Market Volume (Metric Tons) Forecast by Sales Channel, 2020-2035
  • Table 109: Middle East and Africa Market Value (USD Billion) Forecast by Packaging, 2020-2035
  • Table 110: Middle East and Africa Market Volume (Metric Tons) Forecast by Packaging, 2020-2035
  • Table 111: Middle East and Africa Market Value (USD Billion) Forecast by Application, 2020-2035
  • Table 112: Middle East and Africa Market Volume (Metric Tons) Forecast by Application, 2020-2035

List of Figures

  • Figure 1: Global Market Volume (Metric Tons) Forecast 2020-2035
  • Figure 2: Global Market Pricing Analysis
  • Figure 3: Global Market Value (USD Billion) Forecast 2020-2035
  • Figure 4: Global Market Value Share and BPS Analysis by Type, 2025 and 2035
  • Figure 5: Global Market Y-o-Y Growth Comparison by Type, 2025-2035
  • Figure 6: Global Market Attractiveness Analysis by Type
  • Figure 7: Global Market Value Share and BPS Analysis by Form, 2025 and 2035
  • Figure 8: Global Market Y-o-Y Growth Comparison by Form, 2025-2035
  • Figure 9: Global Market Attractiveness Analysis by Form
  • Figure 10: Global Market Value Share and BPS Analysis by Concentration, 2025 and 2035
  • Figure 11: Global Market Y-o-Y Growth Comparison by Concentration, 2025-2035
  • Figure 12: Global Market Attractiveness Analysis by Concentration
  • Figure 13: Global Market Value Share and BPS Analysis by Sales Channel, 2025 and 2035
  • Figure 14: Global Market Y-o-Y Growth Comparison by Sales Channel, 2025-2035
  • Figure 15: Global Market Attractiveness Analysis by Sales Channel
  • Figure 16: Global Market Value Share and BPS Analysis by Packaging, 2025 and 2035
  • Figure 17: Global Market Y-o-Y Growth Comparison by Packaging, 2025-2035
  • Figure 18: Global Market Attractiveness Analysis by Packaging
  • Figure 19: Global Market Value Share and BPS Analysis by Application, 2025 and 2035
  • Figure 20: Global Market Y-o-Y Growth Comparison by Application, 2025-2035
  • Figure 21: Global Market Attractiveness Analysis by Application
  • Figure 22: Global Market Value (USD Billion) Share and BPS Analysis by Region, 2025 and 2035
  • Figure 23: Global Market Y-o-Y Growth Comparison by Region, 2025-2035
  • Figure 24: Global Market Attractiveness Analysis by Region
  • Figure 25: North America Market Incremental $ Opportunity, 2025-2035
  • Figure 26: Latin America Market Incremental $ Opportunity, 2025-2035
  • Figure 27: Western Europe Market Incremental $ Opportunity, 2025-2035
  • Figure 28: Eastern Europe Market Incremental $ Opportunity, 2025-2035
  • Figure 29: East Asia Market Incremental $ Opportunity, 2025-2035
  • Figure 30: South Asia & Pacific Market Incremental $ Opportunity, 2025-2035
  • Figure 31: Middle East and Africa Market Incremental $ Opportunity, 2025-2035
  • Figure 32: North America Market Value Share and BPS Analysis by Country, 2025 and 2035
  • Figure 33: North America Market Value Share and BPS Analysis by Type, 2025 and 2035
  • Figure 34: North America Market Y-o-Y Growth Comparison by Type, 2025-2035
  • Figure 35: North America Market Attractiveness Analysis by Type
  • Figure 36: North America Market Value Share and BPS Analysis by Form, 2025 and 2035
  • Figure 37: North America Market Y-o-Y Growth Comparison by Form, 2025-2035
  • Figure 38: North America Market Attractiveness Analysis by Form
  • Figure 39: North America Market Value Share and BPS Analysis by Concentration, 2025 and 2035
  • Figure 40: North America Market Y-o-Y Growth Comparison by Concentration, 2025-2035
  • Figure 41: North America Market Attractiveness Analysis by Concentration
  • Figure 42: North America Market Value Share and BPS Analysis by Sales Channel, 2025 and 2035
  • Figure 43: North America Market Y-o-Y Growth Comparison by Sales Channel, 2025-2035
  • Figure 44: North America Market Attractiveness Analysis by Sales Channel
  • Figure 45: North America Market Value Share and BPS Analysis by Packaging, 2025 and 2035
  • Figure 46: North America Market Y-o-Y Growth Comparison by Packaging, 2025-2035
  • Figure 47: North America Market Attractiveness Analysis by Packaging
  • Figure 48: North America Market Value Share and BPS Analysis by Application, 2025 and 2035
  • Figure 49: North America Market Y-o-Y Growth Comparison by Application, 2025-2035
  • Figure 50: North America Market Attractiveness Analysis by Application
  • Figure 51: Latin America Market Value Share and BPS Analysis by Country, 2025 and 2035
  • Figure 52: Latin America Market Value Share and BPS Analysis by Type, 2025 and 2035
  • Figure 53: Latin America Market Y-o-Y Growth Comparison by Type, 2025-2035
  • Figure 54: Latin America Market Attractiveness Analysis by Type
  • Figure 55: Latin America Market Value Share and BPS Analysis by Form, 2025 and 2035
  • Figure 56: Latin America Market Y-o-Y Growth Comparison by Form, 2025-2035
  • Figure 57: Latin America Market Attractiveness Analysis by Form
  • Figure 58: Latin America Market Value Share and BPS Analysis by Concentration, 2025 and 2035
  • Figure 59: Latin America Market Y-o-Y Growth Comparison by Concentration, 2025-2035
  • Figure 60: Latin America Market Attractiveness Analysis by Concentration
  • Figure 61: Latin America Market Value Share and BPS Analysis by Sales Channel, 2025 and 2035
  • Figure 62: Latin America Market Y-o-Y Growth Comparison by Sales Channel, 2025-2035
  • Figure 63: Latin America Market Attractiveness Analysis by Sales Channel
  • Figure 64: Latin America Market Value Share and BPS Analysis by Packaging, 2025 and 2035
  • Figure 65: Latin America Market Y-o-Y Growth Comparison by Packaging, 2025-2035
  • Figure 66: Latin America Market Attractiveness Analysis by Packaging
  • Figure 67: Latin America Market Value Share and BPS Analysis by Application, 2025 and 2035
  • Figure 68: Latin America Market Y-o-Y Growth Comparison by Application, 2025-2035
  • Figure 69: Latin America Market Attractiveness Analysis by Application
  • Figure 70: Western Europe Market Value Share and BPS Analysis by Country, 2025 and 2035
  • Figure 71: Western Europe Market Value Share and BPS Analysis by Type, 2025 and 2035
  • Figure 72: Western Europe Market Y-o-Y Growth Comparison by Type, 2025-2035
  • Figure 73: Western Europe Market Attractiveness Analysis by Type
  • Figure 74: Western Europe Market Value Share and BPS Analysis by Form, 2025 and 2035
  • Figure 75: Western Europe Market Y-o-Y Growth Comparison by Form, 2025-2035
  • Figure 76: Western Europe Market Attractiveness Analysis by Form
  • Figure 77: Western Europe Market Value Share and BPS Analysis by Concentration, 2025 and 2035
  • Figure 78: Western Europe Market Y-o-Y Growth Comparison by Concentration, 2025-2035
  • Figure 79: Western Europe Market Attractiveness Analysis by Concentration
  • Figure 80: Western Europe Market Value Share and BPS Analysis by Sales Channel, 2025 and 2035
  • Figure 81: Western Europe Market Y-o-Y Growth Comparison by Sales Channel, 2025-2035
  • Figure 82: Western Europe Market Attractiveness Analysis by Sales Channel
  • Figure 83: Western Europe Market Value Share and BPS Analysis by Packaging, 2025 and 2035
  • Figure 84: Western Europe Market Y-o-Y Growth Comparison by Packaging, 2025-2035
  • Figure 85: Western Europe Market Attractiveness Analysis by Packaging
  • Figure 86: Western Europe Market Value Share and BPS Analysis by Application, 2025 and 2035
  • Figure 87: Western Europe Market Y-o-Y Growth Comparison by Application, 2025-2035
  • Figure 88: Western Europe Market Attractiveness Analysis by Application
  • Figure 89: Eastern Europe Market Value Share and BPS Analysis by Country, 2025 and 2035
  • Figure 90: Eastern Europe Market Value Share and BPS Analysis by Type, 2025 and 2035
  • Figure 91: Eastern Europe Market Y-o-Y Growth Comparison by Type, 2025-2035
  • Figure 92: Eastern Europe Market Attractiveness Analysis by Type
  • Figure 93: Eastern Europe Market Value Share and BPS Analysis by Form, 2025 and 2035
  • Figure 94: Eastern Europe Market Y-o-Y Growth Comparison by Form, 2025-2035
  • Figure 95: Eastern Europe Market Attractiveness Analysis by Form
  • Figure 96: Eastern Europe Market Value Share and BPS Analysis by Concentration, 2025 and 2035
  • Figure 97: Eastern Europe Market Y-o-Y Growth Comparison by Concentration, 2025-2035
  • Figure 98: Eastern Europe Market Attractiveness Analysis by Concentration
  • Figure 99: Eastern Europe Market Value Share and BPS Analysis by Sales Channel, 2025 and 2035
  • Figure 100: Eastern Europe Market Y-o-Y Growth Comparison by Sales Channel, 2025-2035
  • Figure 101: Eastern Europe Market Attractiveness Analysis by Sales Channel
  • Figure 102: Eastern Europe Market Value Share and BPS Analysis by Packaging, 2025 and 2035
  • Figure 103: Eastern Europe Market Y-o-Y Growth Comparison by Packaging, 2025-2035
  • Figure 104: Eastern Europe Market Attractiveness Analysis by Packaging
  • Figure 105: Eastern Europe Market Value Share and BPS Analysis by Application, 2025 and 2035
  • Figure 106: Eastern Europe Market Y-o-Y Growth Comparison by Application, 2025-2035
  • Figure 107: Eastern Europe Market Attractiveness Analysis by Application
  • Figure 108: East Asia Market Value Share and BPS Analysis by Country, 2025 and 2035
  • Figure 109: East Asia Market Value Share and BPS Analysis by Type, 2025 and 2035
  • Figure 110: East Asia Market Y-o-Y Growth Comparison by Type, 2025-2035
  • Figure 111: East Asia Market Attractiveness Analysis by Type
  • Figure 112: East Asia Market Value Share and BPS Analysis by Form, 2025 and 2035
  • Figure 113: East Asia Market Y-o-Y Growth Comparison by Form, 2025-2035
  • Figure 114: East Asia Market Attractiveness Analysis by Form
  • Figure 115: East Asia Market Value Share and BPS Analysis by Concentration, 2025 and 2035
  • Figure 116: East Asia Market Y-o-Y Growth Comparison by Concentration, 2025-2035
  • Figure 117: East Asia Market Attractiveness Analysis by Concentration
  • Figure 118: East Asia Market Value Share and BPS Analysis by Sales Channel, 2025 and 2035
  • Figure 119: East Asia Market Y-o-Y Growth Comparison by Sales Channel, 2025-2035
  • Figure 120: East Asia Market Attractiveness Analysis by Sales Channel
  • Figure 121: East Asia Market Value Share and BPS Analysis by Packaging, 2025 and 2035
  • Figure 122: East Asia Market Y-o-Y Growth Comparison by Packaging, 2025-2035
  • Figure 123: East Asia Market Attractiveness Analysis by Packaging
  • Figure 124: East Asia Market Value Share and BPS Analysis by Application, 2025 and 2035
  • Figure 125: East Asia Market Y-o-Y Growth Comparison by Application, 2025-2035
  • Figure 126: East Asia Market Attractiveness Analysis by Application
  • Figure 127: South Asia & Pacific Market Value Share and BPS Analysis by Country, 2025 and 2035
  • Figure 128: South Asia & Pacific Market Value Share and BPS Analysis by Type, 2025 and 2035
  • Figure 129: South Asia & Pacific Market Y-o-Y Growth Comparison by Type, 2025-2035
  • Figure 130: South Asia & Pacific Market Attractiveness Analysis by Type
  • Figure 131: South Asia & Pacific Market Value Share and BPS Analysis by Form, 2025 and 2035
  • Figure 132: South Asia & Pacific Market Y-o-Y Growth Comparison by Form, 2025-2035
  • Figure 133: South Asia & Pacific Market Attractiveness Analysis by Form
  • Figure 134: South Asia & Pacific Market Value Share and BPS Analysis by Concentration, 2025 and 2035
  • Figure 135: South Asia & Pacific Market Y-o-Y Growth Comparison by Concentration, 2025-2035
  • Figure 136: South Asia & Pacific Market Attractiveness Analysis by Concentration
  • Figure 137: South Asia & Pacific Market Value Share and BPS Analysis by Sales Channel, 2025 and 2035
  • Figure 138: South Asia & Pacific Market Y-o-Y Growth Comparison by Sales Channel, 2025-2035
  • Figure 139: South Asia & Pacific Market Attractiveness Analysis by Sales Channel
  • Figure 140: South Asia & Pacific Market Value Share and BPS Analysis by Packaging, 2025 and 2035
  • Figure 141: South Asia & Pacific Market Y-o-Y Growth Comparison by Packaging, 2025-2035
  • Figure 142: South Asia & Pacific Market Attractiveness Analysis by Packaging
  • Figure 143: South Asia & Pacific Market Value Share and BPS Analysis by Application, 2025 and 2035
  • Figure 144: South Asia & Pacific Market Y-o-Y Growth Comparison by Application, 2025-2035
  • Figure 145: South Asia & Pacific Market Attractiveness Analysis by Application
  • Figure 146: Middle East and Africa Market Value Share and BPS Analysis by Country, 2025 and 2035
  • Figure 147: Middle East and Africa Market Value Share and BPS Analysis by Type, 2025 and 2035
  • Figure 148: Middle East and Africa Market Y-o-Y Growth Comparison by Type, 2025-2035
  • Figure 149: Middle East and Africa Market Attractiveness Analysis by Type
  • Figure 150: Middle East and Africa Market Value Share and BPS Analysis by Form, 2025 and 2035
  • Figure 151: Middle East and Africa Market Y-o-Y Growth Comparison by Form, 2025-2035
  • Figure 152: Middle East and Africa Market Attractiveness Analysis by Form
  • Figure 153: Middle East and Africa Market Value Share and BPS Analysis by Concentration, 2025 and 2035
  • Figure 154: Middle East and Africa Market Y-o-Y Growth Comparison by Concentration, 2025-2035
  • Figure 155: Middle East and Africa Market Attractiveness Analysis by Concentration
  • Figure 156: Middle East and Africa Market Value Share and BPS Analysis by Sales Channel, 2025 and 2035
  • Figure 157: Middle East and Africa Market Y-o-Y Growth Comparison by Sales Channel, 2025-2035
  • Figure 158: Middle East and Africa Market Attractiveness Analysis by Sales Channel
  • Figure 159: Middle East and Africa Market Value Share and BPS Analysis by Packaging, 2025 and 2035
  • Figure 160: Middle East and Africa Market Y-o-Y Growth Comparison by Packaging, 2025-2035
  • Figure 161: Middle East and Africa Market Attractiveness Analysis by Packaging
  • Figure 162: Middle East and Africa Market Value Share and BPS Analysis by Application, 2025 and 2035
  • Figure 163: Middle East and Africa Market Y-o-Y Growth Comparison by Application, 2025-2035
  • Figure 164: Middle East and Africa Market Attractiveness Analysis by Application
  • Figure 165: Global Market - Tier Structure Analysis
  • Figure 166: Global Market - Company Share Analysis

Frequently Asked Questions

How big is the algae omega market in 2025?

The global algae omega market is estimated to be valued at USD 1.0 billion in 2025.

What will be the size of algae omega market in 2035?

The market size for algae omega is projected to reach USD 2.0 billion by 2035.

How much will be the algae omega market growth between 2025 and 2035?

The algae omega market is expected to grow at a 3.7% CAGR between 2025 and 2035.

Which type is projected to lead in the algae omega market in 2025?

The DHA (Docosahexaenoic acid) segment is projected to lead in the algae omega market with 45% market share in 2025.

Which application segment to contribute significant share in the algae omega market in 2025?

In terms of application, dietary supplements segment is projected to command 58% share in the algae omega market in 2025.

Explore Similar Insights

Future Market Insights

Algae Omega Market

Chat With

MaRIA

Hi There, I am MaRIA, Your Market Research Intelligence Assistant. How may I help you?