Algae-Based Eco-Pigments Market Size and Share Forecast Outlook 2025 to 2035

The algae-based eco-pigments market has been projected to reach USD 1,052.3 million in 2025 and USD 3,503.2 million by 2035, reflecting an absolute increase of USD 2,450.9 million over the period. This expansion represents a CAGR of 12.8%, highlighting robust momentum in sustainable pigment innovation. The decade-long rise is expected to be fueled by increasing regulatory scrutiny on synthetic pigments, alongside accelerating adoption of natural alternatives across beauty and personal care.
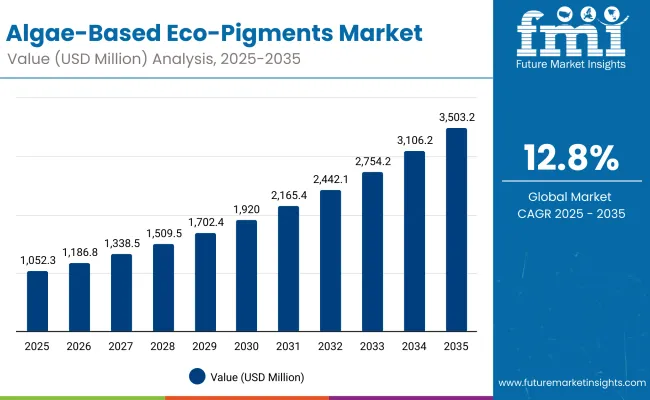
Algae Based Eco Pigments Market Value Analysis

Quick Stats for Algae-Based Eco-Pigments Market

  • Algae-Based Eco-Pigments Market Value (2025): USD 1,052.3 Million
  • Algae-Based Eco-Pigments Market Forecast Value (2035): USD 3,503.2 Million
  • Algae-Based Eco-Pigments Market Forecast CAGR (2025 to 2035): 12.8%
  • Leading Segment in 2025: Microalgae (49.0%)
  • Key Growth Regions: China, India, USA, Germany, Japan
  • Top Key Players: Sensient Cosmetic Technologies, DIC/Sun Chemical, Givaudan Active Beauty, BASF, Croda, Kobo Products, Seppic, Greentech, Algatech, Colorchem

Algae-Based Eco-Pigments Market Key Takeaways

Metric Value
Algae-Based Eco-Pigments Market Estimated Value In ( 2025E ) USD 1,052.3 million
Algae-Based Eco-Pigments Market Forecast Value in (2035F) USD 3,503.2 million
Forecast CAGR (2025 to 2035) 12.80%

During the first half of the forecast, between 2025 and 2030, the market is anticipated to grow from USD 1,052.3 million to USD 1,920.0 million, adding USD 867.7 million, which accounts for over one-third of the decade’s incremental growth.

This period is projected to be marked by consistent uptake in mainstream cosmetic applications, where product transparency and eco-labeled formulations are increasingly prioritized. Microalgae are expected to dominate the source segment with 49.0% share in 2025, while powder pigments are projected to lead product forms with 52.0% share, benefiting from versatility and ease of formulation.

The second phase, covering 2030 to 2035, is expected to add USD 1,583.2 million as the market surges from USD 1,920.0 million to USD 3,503.2 million. This later-stage acceleration is anticipated to be shaped by expansion into e-commerce-driven distribution and growth in Asia, particularly China and India, where CAGRs of 19.6% and 22.5% respectively are forecasted. By 2035, broader adoption of engineered algae pigments and encapsulated technologies is likely to further solidify long-term market potential.

From 2020 to 2024, the algae-based eco-pigments market was in its early adoption phase, with value expansion reinforced by demand for sustainable cosmetic colorants. By 2025, the market is forecasted to reach USD 1,052.3 million, setting the foundation for rapid scale-up toward USD 3,503.2 million in 2035. Growth will be shaped by accelerated adoption in natural makeup and skincare categories, where microalgae and powder pigments are anticipated to dominate due to performance and formulation versatility.

The competitive landscape is expected to evolve from fragmented participation toward structured leadership, as players like Sensient Cosmetic Technologies and BASF advance bio-engineered pigment technologies. While specialty beauty retail and e-commerce will account for the bulk of distribution in the near term, digital-first channels are projected to redefine access and brand positioning over the decade.

China and India will deliver the highest growth rates, supported by industrial scale and consumer preference for eco-certified products. Competitive advantage is anticipated to shift from raw pigment supply toward integrated innovation ecosystems combining sustainability, scalability, and application-specific performance.

Why the Algae-Based Eco-Pigments Market is growing?

Growth in the algae-based eco-pigments market is being driven by rising consumer preference for natural and sustainable colorants in beauty and personal care formulations. Strong momentum is being created by regulatory pressure against synthetic pigments, which are increasingly being scrutinized for safety and environmental impact.

Greater adoption is being facilitated by the alignment of algae-based pigments with claims such as vegan, reef-safe, and plastic-free, which are gaining traction in premium and mass-market segments alike. Expanding applications across makeup, skincare, and hair color are being supported by advancements in bioengineering, ensuring improved pigment stability and broader color ranges.

Rapid growth in digital commerce is enabling eco-certified brands to reach wider audiences, accelerating market penetration. Asia is projected to play a pivotal role, as China and India demonstrate double-digit growth supported by consumer demand for green formulations. Competitive differentiation is expected to emerge through innovation in encapsulation and engineered algae strains.

Segmental Analysis

The algae-based eco-pigments market has been segmented across multiple dimensions to highlight the areas driving adoption and revenue growth. Segmentation has been carried out by Source, Application, and Product Form, reflecting the categories most relevant to consumer preferences and industry innovation.

Each segment is expected to showcase distinct growth patterns influenced by sustainability trends, evolving beauty standards, and technological advancements in algae cultivation and pigment extraction. While microalgae, makeup applications, and powder pigments are currently positioned as leading categories, other sub-segments are anticipated to gain momentum over the forecast period as demand diversifies.

This structured segmentation provides clarity on current market dominance and future opportunities that are likely to reshape competitive strategies and investment priorities through 2035.
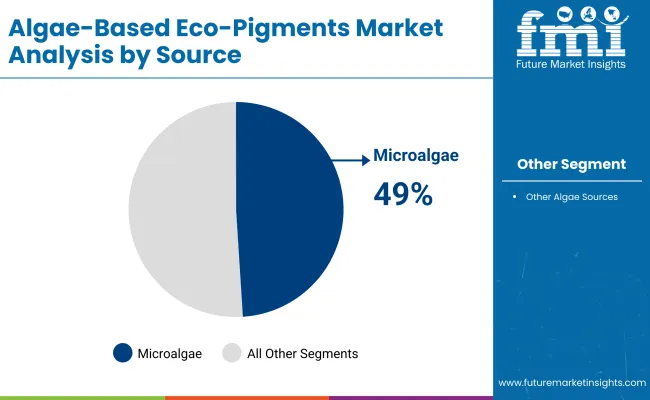
Insights into the Source Segment with Microalgae Leading in Market Share

Algae Based Eco Pigments Market By Source

Segment Market Value Share, 2025
Microalgae 49%
Others 51.0%

The source segment is anticipated to be anchored by microalgae, which are projected to contribute 49.0% of market share in 2025, valued at USD 588.9 million. Adoption is being driven by their superior pigment concentration, natural origin, and alignment with eco-labeling trends. The “Others” category is expected to capture 51.0% of value at USD 536.67 million, benefiting from diversified algae sources.

Rising demand for transparent ingredient sourcing and sustainability-focused cosmetics is expected to reinforce the relevance of microalgae pigments. As engineered algae strains gain traction in later years, the competitive dynamic within this segment is likely to shift toward enhanced functionality and scalability. Long-term differentiation is projected to emerge through efficiency in cultivation and bio-extraction processes.
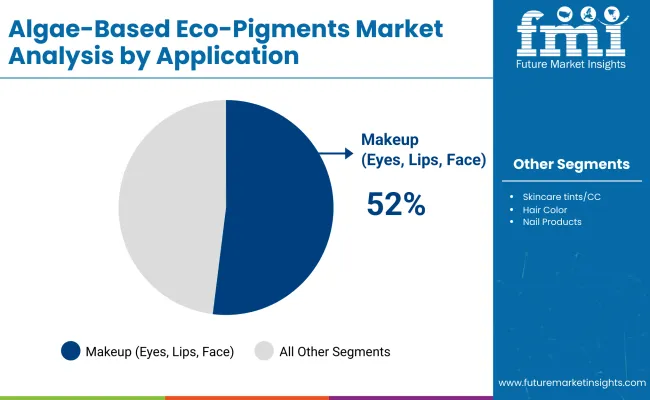
Insights into the Application Segment with Makeup Dominating the Demand

Algae Based Eco Pigments Market By Application

Segment Market Value Share, 2025
Makeup (eyes, lips, face) 52%
Others 48.0%

The application segment is expected to be dominated by makeup, which is projected to command 52.0% share in 2025, equivalent to USD 566.7 million. Pigments derived from algae are increasingly being positioned as sustainable and safer alternatives in lipsticks, eyeliners, and facial cosmetics, thereby driving widespread adoption.

The “Others” category, capturing 48.0% share or USD 505.1 million, will also remain significant, supported by growing use in skincare and multipurpose products. The appeal of algae-based pigments in enhancing both performance and sustainability credentials is anticipated to support long-term integration into mainstream product lines. Continuous consumer demand for clean beauty is expected to reinforce makeup as the leading driver of segmental growth through 2035.
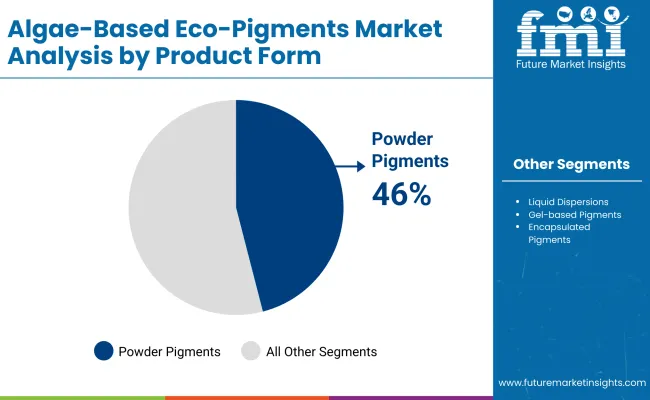
Insights into the Product Form Segment with Powder Pigments Retaining an Edge

Algae Based Eco Pigments Market By Product Form

Segment Market Value Share, 2025
Powder pigments 46%
Others 54.0%

The product form segment is projected to be led by powder pigments, which are expected to achieve 46.0% share in 2025, amounting to USD 533.3 million. Their durability, ease of formulation, and stability across makeup categories are driving preference. The “Others” category, representing 54.0% share or USD 568.24 million, is being reinforced by liquid dispersions and emerging gel-based formats.

As consumer trends move toward versatile and hybrid applications, broader innovation across pigment formats is expected. Powder pigments, however, are likely to sustain leadership through their compatibility with existing cosmetic manufacturing. Advancements in encapsulation and delivery methods are projected to enhance performance across all forms, ensuring steady diversification in the product form landscape.

What are the Drivers, Restraints, and Key Trends of the Algae-Based Eco-Pigments Market?

The algae-based eco-pigments market is being shaped by sustainability imperatives, regulatory pressures, and evolving consumer preferences, even as challenges related to production scale, formulation consistency, and competitive pricing remain significant barriers to wider commercialization across beauty, personal care, and allied industries.

Regulatory Endorsement of Eco-Certified Ingredients

A significant driver is being established through regulatory frameworks that increasingly prioritize safe, non-toxic, and eco-certified pigments. Algae-derived pigments are being positioned as compliant alternatives to synthetic dyes facing tighter restrictions in key markets.

Governments and certification agencies are expected to accelerate demand by incentivizing clean-label products, thereby creating both compliance advantages and marketing leverage for early adopters. This dynamic is anticipated to not only reduce dependency on chemical pigments but also reinforce algae-based pigments as the default choice for brands seeking global reach and consumer trust.

High Bioprocessing and Cultivation Costs

Market scalability is being constrained by the high costs associated with microalgae cultivation, extraction, and stabilization. Bioprocessing facilities require significant capital investment, while fluctuations in algae yield add uncertainty to supply chains. Without economies of scale, pricing pressure is being imposed on eco-pigment producers, limiting competitiveness against entrenched synthetic pigments.

Unless cost curves are flattened through industrial symbiosis, technological breakthroughs, or strategic partnerships, profitability risks may deter broader market participation. This structural restraint is anticipated to slow immediate expansion, particularly among smaller companies unable to absorb high input costs, while simultaneously leaving space for large players to dominate.
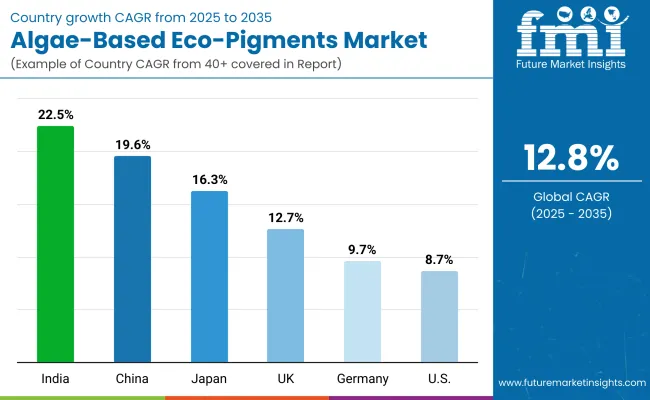
Analysis of Algae-Based Eco-Pigments Market By Key Countries

Algae Based Eco Pigments Market Country Wise Analysis

Country CAGR
China 19.6%
USA 8.7%
India 22.5%
UK 12.7%
Germany 9.7%
Japan 16.3%

The algae-based eco-pigments market is expected to display varied growth trajectories across major economies, shaped by differences in sustainability adoption, industrial modernization, and consumer behavior. Asia is projected to remain the primary growth hub, with India advancing at the fastest CAGR of 22.5% through 2035. Expansion in India is anticipated to be supported by rising demand for clean-label products, evolving beauty standards, and government-backed initiatives encouraging sustainable sourcing.

China is forecasted to record a 19.6% CAGR, propelled by large-scale investments in algae bioprocessing, expanding cosmetic industries, and regulatory preference for eco-certified ingredients. Japan, at 16.3%, is expected to benefit from heightened consumer awareness of reef-safe and vegan claims, alongside strong innovation in hybrid beauty formulations.

Europe is set to remain steady, with the UK (12.7%) and Germany (9.7%) contributing through strict compliance mandates and demand for sustainable cosmetic innovation. The USA, growing at 8.7%, is anticipated to experience more moderate expansion, influenced by mature market conditions but supported by niche premium beauty segments that emphasize transparency and natural formulations.

Together, these countries represent the structural backbone of the algae-based eco-pigments industry, with Asia’s momentum expected to outpace other regions, while Europe and North America provide long-term stability through regulatory alignment and consumer trust.
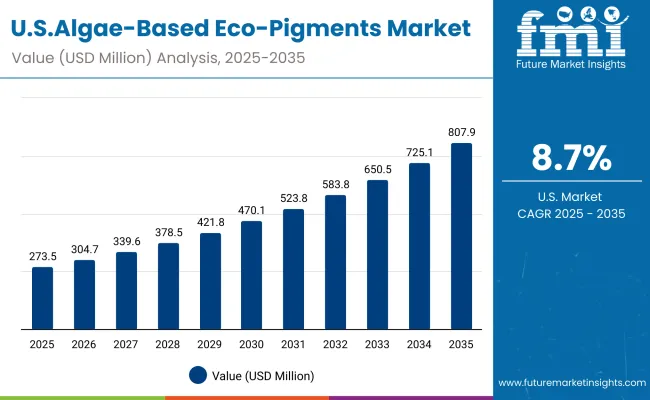
Sales Outlook for Algae-Based Eco-Pigments in the United States

Usa Algae Based Eco Pigments Market

Year USA Algae-Based Eco-Pigments Market (USD Million)
2025 273.50
2026 304.79
2027 339.66
2028 378.52
2029 421.82
2030 470.08
2031 523.86
2032 583.80
2033 650.59
2034 725.02
2035 807.96

The algae-based eco-pigments market in the United States is projected to grow at a CAGR of 11.9%, rising from USD 273.50 million in 2025 to USD 807.96 million by 2035. Expansion is being propelled by increasing consumer demand for eco-certified and sustainable beauty products. Regulatory scrutiny of synthetic pigments is expected to accelerate substitution, particularly in makeup and skincare formulations. Continuous investment in algae bioprocessing and formulation technologies is forecasted to enhance pigment quality and scalability.

  • Clean-label demand is reinforcing algae pigment adoption across premium and mass-market categories.
  • Digital-first cosmetic brands are leveraging algae-based pigments to differentiate product portfolios.
  • Strategic collaborations between pigment innovators and large beauty manufacturers are anticipated to create new growth pathways.

Growth and Expansion Outlook for Algae-Based Eco-Pigments Market in the United Kingdom

The algae-based eco-pigments market in the United Kingdom is projected to expand at a CAGR of 12.7% from 2025 to 2035, reflecting steady integration of sustainable pigments across the beauty and personal care landscape. Expansion is being guided by regulatory mandates on ingredient transparency, as well as consumer demand for reef-safe and vegan formulations. The country’s cosmetic industry is positioned as a strong adopter of clean-label products, with algae pigments expected to gain traction in both premium and mass-market lines. Strategic partnerships between suppliers and local brands are anticipated to accelerate commercialization.

  • Regulatory compliance is reinforcing adoption of reef-safe and vegan pigments.
  • Local brands are leveraging algae-based pigments to strengthen eco-positioning.
  • Investment in R&D is expected to drive innovations in hybrid formulations.
  • Market growth is projected to be sustained by mainstream consumer acceptance of natural colorants.

Growth and Expansion Outlook for Algae-Based Eco-Pigments Market in India

The algae-based eco-pigments market in India is forecasted to grow at a CAGR of 22.5%, the fastest among major economies, during 2025 to 2035. Growth is being fueled by rising consumer preference for herbal and natural cosmetics, supported by cultural affinity for plant- and algae-derived ingredients.

Large-scale adoption is expected to be driven by expanding e-commerce ecosystems, which provide broad access to eco-certified products. Supportive government initiatives promoting sustainable raw materials and clean beauty manufacturing are anticipated to further strengthen market prospects.

  • India will remain the fastest-growing algae pigment market globally.
  • Expanding e-commerce is accelerating consumer access to sustainable products.
  • Government policies are incentivizing eco-friendly cosmetic formulations.
  • Domestic beauty brands are integrating algae pigments to compete with global players.

Sales Outlook for Algae-Based Eco-Pigments in China

The algae-based eco-pigments market in China is projected to advance at a CAGR of 19.6% between 2025 and 2035, supported by large-scale industrialization of algae cultivation and pigment extraction. Cosmetic manufacturers in China are increasingly investing in bio-based innovation to capture growing consumer demand for eco-certified beauty products.

The country is expected to emerge as a hub for mass production of algae pigments, providing cost advantages and export opportunities. Local regulatory frameworks favoring natural and safe formulations are anticipated to accelerate penetration into both domestic and international markets.
  • Large-scale algae cultivation is reinforcing supply-side competitiveness.
  • Government-backed standards are aligning with consumer preference for safe formulations.
  • Domestic brands are scaling eco-certified cosmetics for mass adoption.
  • Export potential is expected to strengthen China’s global influence in algae pigments.

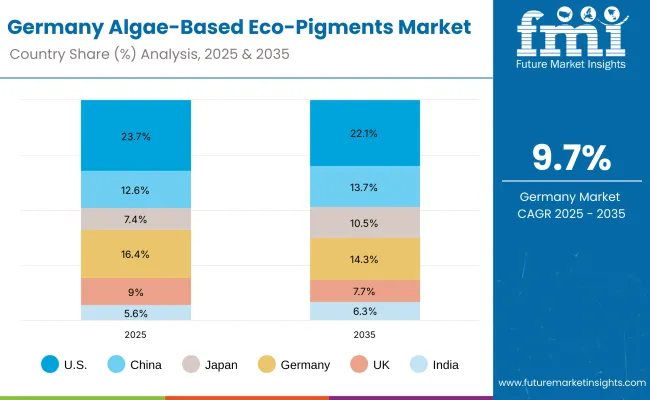
In-depth Analysis of Algae-Based Eco-Pigments in Germany

Germany Algae Based Eco Pigments Market

Countries 2025
USA 23.7%
China 12.6%
Japan 7.4%
Germany 16.4%
UK 9.0%
India 5.6%
Countries 2035
USA 22.1%
China 13.7%
Japan 10.5%
Germany 14.3%
UK 7.7%
India 6.3%

The algae-based eco-pigments market in Germany is expected to grow at a CAGR of 9.7% from 2025 to 2035, driven by strict sustainability regulations and heightened consumer demand for natural formulations. German cosmetic companies are recognized for early adoption of eco-labels and innovation in clean beauty products.

Algae-based pigments are being increasingly integrated into premium skincare and makeup categories, supported by the country’s strong R&D infrastructure. Export-driven opportunities are anticipated as German brands expand eco-certified product lines to other European markets.
  • Germany’s regulatory standards are creating strong incentives for eco-pigment adoption.
  • Premium skincare is emerging as a leading application for algae-based pigments.
  • Innovation in encapsulation and stability technologies is being prioritized.
  • Export orientation is strengthening Germany’s role in the European clean beauty market.

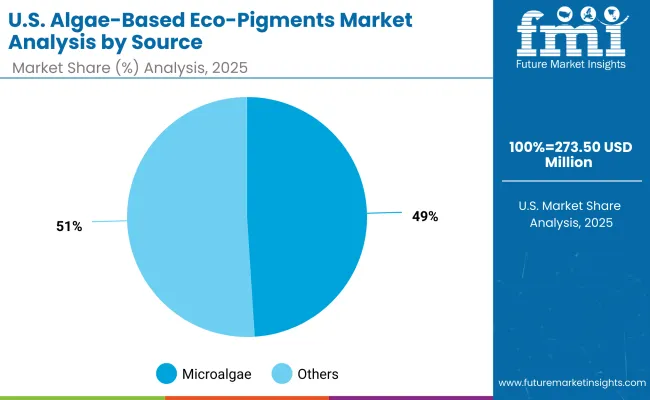
Growth Outlook for Algae-Based Eco-Pigments Market in USA

Usa Algae Based Eco Pigments Market By Source

Segment Market Value Share, 2025
Microalgae 49%
Others 51.0%

The algae-based eco-pigments market in the United States is projected at USD 273.50 million in 2025. Microalgae contribute 49.0% (USD 134.0 million), while other algae-based sources hold a slightly larger 51.0% (USD 139.49 million). This marginal lead for the “Others” category underscores the ongoing diversification of pigment sourcing, as broader algae strains are being cultivated to meet growing cosmetic formulation requirements.

The competitive balance reflects both the established performance of microalgae and the expanding role of alternative sources in ensuring cost efficiency and product availability. Advanced bioengineering and cultivation methods are expected to further improve yields across multiple algae types, thereby strengthening the overall supply chain.
  • USA market value is estimated at USD 273.50 million in 2025.
  • Microalgae hold 49.0% share, while other algae types lead slightly at 51.0%.
  • Diversification of sources is anticipated to enhance resilience and scalability.
  • Bioengineering advances are projected to reinforce both quality and cost efficiency.

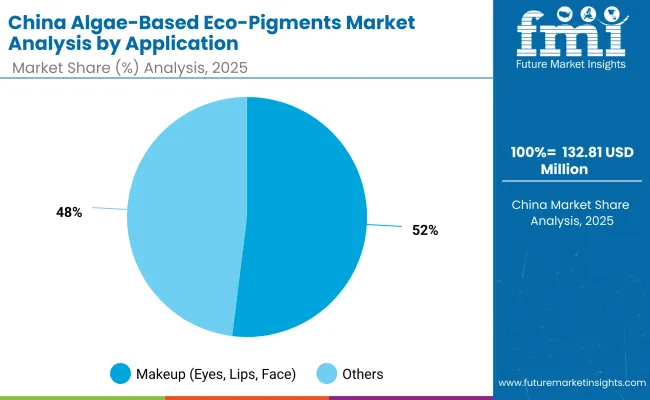
Opportunity Analysis of China Algae-Based Eco-Pigments Market

China Algae Based Eco Pigments Market By Application

Segment Market Value Share, 2025
Makeup (eyes, lips, face) 52%
Others 48.0%

The algae-based eco-pigments market in China is projected at USD 132.81 million in 2025. Makeup applications contribute 52.0% (USD 69.1 million), while other applications hold 48.0% (USD 63.75 million). This marginal dominance of the makeup category reflects the rapid growth of color cosmetics in China, where algae-derived pigments are being integrated into lip, eye, and face products to meet clean beauty expectations.

Consumer preference for eco-certified and vegan-friendly formulations is anticipated to accelerate this trend. The strong presence of domestic brands, coupled with government support for sustainable raw materials, is expected to sustain growth across all application areas.
  • China’s eco-pigment market is projected at USD 132.81 million in 2025.
  • Makeup leads with 52.0% share, slightly ahead of other applications at 48.0%.
  • Demand is being shaped by consumer preference for clean-label and vegan beauty.
  • Domestic innovation and supportive policy frameworks are anticipated to drive scale-up.

Competitive Landscape of Algae-Based Eco-Pigments Market

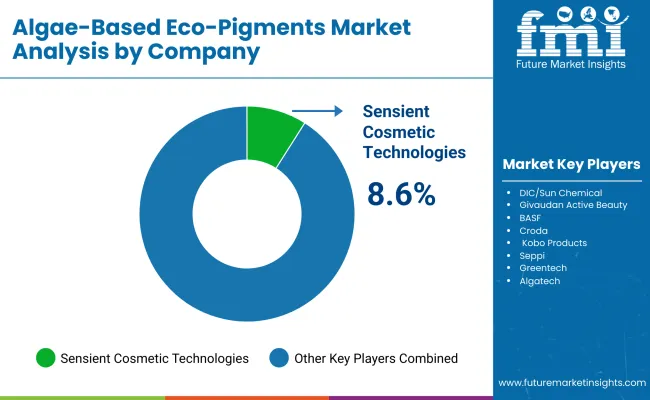
Algae Based Eco Pigments Market By Company

Company Global Value Share 2025
Sensient Cosmetic Technologies 8.6%
Others 91.4%

The algae-based eco-pigments market is moderately fragmented, with global leaders, emerging innovators, and regionally focused specialists competing for growth across beauty and personal care applications. Sensient Cosmetic Technologies is recognized as the dominant player, holding 8.6% of the global market share in 2025, making it the only company with measurable scale in this segment. In 2024, the company’s share was estimated at around 8.2%, indicating steady growth momentum supported by innovation in algae-derived colorants and partnerships with major cosmetic brands.

Other prominent players active in this space include DIC/Sun Chemical, Givaudan Active Beauty, BASF, Croda, Kobo Products, Seppic, Greentech, Algatech, and Colorchem. These companies are investing in bioprocessing, encapsulation technologies, and sustainable sourcing to strengthen their portfolios. While they hold smaller shares individually, their collective contribution represents over 91.4% of the market, highlighting a competitive environment where scale is still being established.

Competitive differentiation is increasingly being shaped by capabilities in bioengineering of algae strains, eco-certification, and integration into hybrid beauty formulations. Partnerships with cosmetic manufacturers are expected to expand, with algae pigments positioned as the preferred solution for vegan, reef-safe, and natural claims. As demand accelerates, focus is anticipated to shift from pigment performance alone toward supply chain resilience, certification, and application versatility, defining long-term leadership in this market.

Key Developments in Algae-Based Eco-Pigments Market

  • In May 2025, the USA Food and Drug Administration approved “galdieria extract blue,” an algae-derived pigment, as a color additive for use in foods. This approval was enabled by a petition process, broadening natural pigment choices for manufacturers and accelerating demand for algae-based colorants across beverage, confectionery, and dairy applications.
  • Between February and June 2025, China’s NMPA and NIFDC issued several regulatory measures including Decree No. 12 (Feb), enhanced Inventories of Existing Cosmetic Ingredients (June), and updated safety reporting requirements (May) - to promote innovation in cosmetic ingredients. These were aimed at easing registration burdens for novel, safe, and sustainable pigment sources such as algae-derived colors.

Scope of the Report

Item Value
Quantitative USD 1,052.3 million (2025); USD 3,503.2 million (2035); CAGR 12.8% (2025 to 2035)
Source Microalgae; Other algae sources (incl. macroalgae, cyanobacteria, engineered algae pigments)
Application Makeup (eyes, lips, face); Skincare tints/CC; Hair color; Nail products
Product Form Powder pigments; Liquid dispersions; Gel-based pigments; Encapsulated pigments
Channel Specialty beauty retail; E-commerce; Pharmacies; B2B color suppliers
Claims (Compliance Focus) Vegan; Natural/organic; Plastic-free; Reef-safe
Regions Covered North America; Europe; East Asia; South Asia & Pacific; Latin America; Middle East & Africa
Countries Covered (Key) China; United States; India; United Kingdom; Germany; Japan
Key Companies Profiled Sensient Cosmetic Technologies; DIC/Sun Chemical; Givaudan Active Beauty; BASF; Croda; Kobo Products; Seppic; Greentech; Algatech; Colorchem
Additional Attributes USD 566.7 million (2025) Makeup vs USD 505.1 million Others (Application); USD 533.3 million Powder vs USD 568.24 million Others (Product Form); USD 588.9 million Microalgae vs USD 536.67 million Others (Source); fast-growth countries: India 22.5% CAGR, China 19.6%, Japan 16.3%, UK 12.7%, Germany 9.7%, USA 8.7%; demand reinforced by eco-certifications (vegan, reef-safe, plastic-free); distribution led by E-commerce 54% and Specialty retail 46% in 2025; competitive landscape headed by Sensient Cosmetic Technologies 8.6% global share (2025) with diversified challengers.

Key Segments

By Source:

  • Microalgae
  • Macroalgae
  • Cyanobacteria
  • Engineered algae pigments

By Application:

  • Makeup (eyes, lips, face)
  • Skincare tints/CC
  • Hair color
  • Nail products

By Product Form:

  • Powder pigments
  • Liquid dispersions
  • Gel-based pigments
  • Encapsulated pigments

By Channel:

  • Specialty beauty retail
  • E-commerce
  • Pharmacies
  • B2B color suppliers

By Claim:

  • Vegan
  • Natural/organic
  • Plastic-free
  • Reef-safe

By Region:

  • North America
  • Latin America
  • Europe
  • East Asia
  • South Asia & Pacific
  • Middle East and Africa

Table of Content

  1. Executive Summary
    • Global Market Outlook
    • Demand-side Trends
    • Supply-side Trends
    • Technology Roadmap Analysis
    • Analysis and Recommendations
  2. Market Overview
    • Market Coverage / Taxonomy
    • Market Definition / Scope / Limitations
  3. Market Background
    • Market Dynamics
      • Drivers
      • Restraints
      • Opportunity
      • Trends
    • Scenario Forecast
      • Demand in Optimistic Scenario
      • Demand in Likely Scenario
      • Demand in Conservative Scenario
    • Opportunity Map Analysis
    • Product Life Cycle Analysis
    • Supply Chain Analysis
    • Investment Feasibility Matrix
    • Value Chain Analysis
    • PESTLE and Porter’s Analysis
    • Regulatory Landscape
    • Regional Parent Market Outlook
    • Production and Consumption Statistics
    • Import and Export Statistics
  4. Global Market Analysis 2020 to 2024 and Forecast, 2025 to 2035
    • Historical Market Size Value (USD Million) Analysis, 2020 to 2024
    • Current and Future Market Size Value (USD Million) Projections, 2025 to 2035
      • Y-o-Y Growth Trend Analysis
      • Absolute $ Opportunity Analysis
  5. Global Market Pricing Analysis 2020 to 2024 and Forecast 2025 to 2035
  6. Global Market Analysis 2020 to 2024 and Forecast 2025 to 2035, By Source
    • Introduction / Key Findings
    • Historical Market Size Value (USD Million) Analysis By Source, 2020 to 2024
    • Current and Future Market Size Value (USD Million) Analysis and Forecast By Source, 2025 to 2035
      • Microalgae
      • Macroalgae
      • Cyanobacteria
      • Engineered algae pigments
    • Y-o-Y Growth Trend Analysis By Source, 2020 to 2024
    • Absolute $ Opportunity Analysis By Source, 2025 to 2035
  7. Global Market Analysis 2020 to 2024 and Forecast 2025 to 2035, By Application
    • Introduction / Key Findings
    • Historical Market Size Value (USD Million) Analysis By Application, 2020 to 2024
    • Current and Future Market Size Value (USD Million) Analysis and Forecast By Application, 2025 to 2035
      • Makeup (eyes, lips, face)
      • Skincare tints/CC
      • Hair color
      • Nail products
    • Y-o-Y Growth Trend Analysis By Application, 2020 to 2024
    • Absolute $ Opportunity Analysis By Application, 2025 to 2035
  8. Global Market Analysis 2020 to 2024 and Forecast 2025 to 2035, By Product Form
    • Introduction / Key Findings
    • Historical Market Size Value (USD Million) Analysis By Product Form, 2020 to 2024
    • Current and Future Market Size Value (USD Million) Analysis and Forecast By Product Form, 2025 to 2035
      • Powder pigments
      • Liquid dispersions
      • Gel-based pigments
      • Encapsulated pigments
    • Y-o-Y Growth Trend Analysis By Product Form, 2020 to 2024
    • Absolute $ Opportunity Analysis By Product Form, 2025 to 2035
  9. Global Market Analysis 2020 to 2024 and Forecast 2025 to 2035, By Channel
    • Introduction / Key Findings
    • Historical Market Size Value (USD Million) Analysis By Channel, 2020 to 2024
    • Current and Future Market Size Value (USD Million) Analysis and Forecast By Channel, 2025 to 2035
      • Specialty beauty retail
      • E-commerce
      • Pharmacies
      • B2B color suppliers
    • Y-o-Y Growth Trend Analysis By Channel, 2020 to 2024
    • Absolute $ Opportunity Analysis By Channel, 2025 to 2035
  10. Global Market Analysis 2020 to 2024 and Forecast 2025 to 2035, By Claim
    • Introduction / Key Findings
    • Historical Market Size Value (USD Million) Analysis By Claim, 2020 to 2024
    • Current and Future Market Size Value (USD Million) Analysis and Forecast By Claim, 2025 to 2035
      • Vegan
      • Natural/organic
      • Plastic-free
      • Reef-safe
    • Y-o-Y Growth Trend Analysis By Claim, 2020 to 2024
    • Absolute $ Opportunity Analysis By Claim, 2025 to 2035
  11. Global Market Analysis 2020 to 2024 and Forecast 2025 to 2035, By Region
    • Introduction
    • Historical Market Size Value (USD Million) Analysis By Region, 2020 to 2024
    • Current Market Size Value (USD Million) Analysis and Forecast By Region, 2025 to 2035
      • North America
      • Latin America
      • Europe
      • East Asia
      • South Asia & Pacific
      • Middle East and Africa
    • Market Attractiveness Analysis By Region
  12. North America Market Analysis 2020 to 2024 and Forecast 2025 to 2035, By Country
    • Historical Market Size Value (USD Million) Trend Analysis By Market Taxonomy, 2020 to 2024
    • Market Size Value (USD Million) Forecast By Market Taxonomy, 2025 to 2035
      • By Country
        • USA
        • Canada
      • By Source
      • By Application
      • By Product Form
      • By Channel
      • By Claim
    • Market Attractiveness Analysis
      • By Country
      • By Source
      • By Application
      • By Product Form
      • By Channel
      • By Claim
    • Key Takeaways
  13. Latin America Market Analysis 2020 to 2024 and Forecast 2025 to 2035, By Country
    • Historical Market Size Value (USD Million) Trend Analysis By Market Taxonomy, 2020 to 2024
    • Market Size Value (USD Million) Forecast By Market Taxonomy, 2025 to 2035
      • By Country
        • Brazil
        • Mexico
        • Colombia
        • Rest of Latin America
      • By Source
      • By Application
      • By Product Form
      • By Channel
      • By Claim
    • Market Attractiveness Analysis
      • By Country
      • By Source
      • By Application
      • By Product Form
      • By Channel
      • By Claim
    • Key Takeaways
  14. Europe Market Analysis 2020 to 2024 and Forecast 2025 to 2035, By Country
    • Historical Market Size Value (USD Million) Trend Analysis By Market Taxonomy, 2020 to 2024
    • Market Size Value (USD Million) Forecast By Market Taxonomy, 2025 to 2035
      • By Country
        • Germany
        • UK
        • France
        • Italy
        • Spain
        • Belgium
        • Netherlands
        • Nordic
        • Switzerland
        • Russia
        • Poland
        • Rest of Europe
      • By Source
      • By Application
      • By Product Form
      • By Channel
      • By Claim
    • Market Attractiveness Analysis
      • By Country
      • By Source
      • By Application
      • By Product Form
      • By Channel
      • By Claim
    • Key Takeaways
  15. East Asia Market Analysis 2020 to 2024 and Forecast 2025 to 2035, By Country
    • Historical Market Size Value (USD Million) Trend Analysis By Market Taxonomy, 2020 to 2024
    • Market Size Value (USD Million) Forecast By Market Taxonomy, 2025 to 2035
      • By Country
        • China
        • Japan
        • South Korea
      • By Source
      • By Application
      • By Product Form
      • By Channel
      • By Claim
    • Market Attractiveness Analysis
      • By Country
      • By Source
      • By Application
      • By Product Form
      • By Channel
      • By Claim
    • Key Takeaways
  16. South Asia & Pacific Market Analysis 2020 to 2024 and Forecast 2025 to 2035, By Country
    • Historical Market Size Value (USD Million) Trend Analysis By Market Taxonomy, 2020 to 2024
    • Market Size Value (USD Million) Forecast By Market Taxonomy, 2025 to 2035
      • By Country
        • India
        • Thailand
        • Malaysia
        • Indonesia
        • Singapore
        • Vietnam
        • Australia
        • New Zealand
        • Rest of South Asia
      • By Source
      • By Application
      • By Product Form
      • By Channel
      • By Claim
    • Market Attractiveness Analysis
      • By Country
      • By Source
      • By Application
      • By Product Form
      • By Channel
      • By Claim
    • Key Takeaways
  17. Middle East and Africa Market Analysis 2020 to 2024 and Forecast 2025 to 2035, By Country
    • Historical Market Size Value (USD Million) Trend Analysis By Market Taxonomy, 2020 to 2024
    • Market Size Value (USD Million) Forecast By Market Taxonomy, 2025 to 2035
      • By Country
        • Turkey
        • UAE
        • Saudi Arabia
        • Israel
        • Other GCC Countries
        • North Africa
        • South Africa
      • By Source
      • By Application
      • By Product Form
      • By Channel
      • By Claim
    • Market Attractiveness Analysis
      • By Country
      • By Source
      • By Application
      • By Product Form
      • By Channel
      • By Claim
    • Key Takeaways
  18. Key Countries Market Analysis
    • USA
      • Pricing Analysis
      • Market Share Analysis, 2024
        • By Source
        • By Application
        • By Product Form
        • By Channel
        • By Claim
    • Canada
      • Pricing Analysis
      • Market Share Analysis, 2024
        • By Source
        • By Application
        • By Product Form
        • By Channel
        • By Claim
    • Mexico
      • Pricing Analysis
      • Market Share Analysis, 2024
        • By Source
        • By Application
        • By Product Form
        • By Channel
        • By Claim
    • Brazil
      • Pricing Analysis
      • Market Share Analysis, 2024
        • By Source
        • By Application
        • By Product Form
        • By Channel
        • By Claim
    • Germany
      • Pricing Analysis
      • Market Share Analysis, 2024
        • By Source
        • By Application
        • By Product Form
        • By Channel
        • By Claim
    • UK
      • Pricing Analysis
      • Market Share Analysis, 2024
        • By Source
        • By Application
        • By Product Form
        • By Channel
        • By Claim
    • Italy
      • Pricing Analysis
      • Market Share Analysis, 2024
        • By Source
        • By Application
        • By Product Form
        • By Channel
        • By Claim
    • Spain
      • Pricing Analysis
      • Market Share Analysis, 2024
        • By Source
        • By Application
        • By Product Form
        • By Channel
        • By Claim
    • France
      • Pricing Analysis
      • Market Share Analysis, 2024
        • By Source
        • By Application
        • By Product Form
        • By Channel
        • By Claim
    • India
      • Pricing Analysis
      • Market Share Analysis, 2024
        • By Source
        • By Application
        • By Product Form
        • By Channel
        • By Claim
    • Australia & New Zealand
      • Pricing Analysis
      • Market Share Analysis, 2024
        • By Source
        • By Application
        • By Product Form
        • By Channel
        • By Claim
    • China
      • Pricing Analysis
      • Market Share Analysis, 2024
        • By Source
        • By Application
        • By Product Form
        • By Channel
        • By Claim
    • Japan
      • Pricing Analysis
      • Market Share Analysis, 2024
        • By Source
        • By Application
        • By Product Form
        • By Channel
        • By Claim
    • South Korea
      • Pricing Analysis
      • Market Share Analysis, 2024
        • By Source
        • By Application
        • By Product Form
        • By Channel
        • By Claim
    • Russia
      • Pricing Analysis
      • Market Share Analysis, 2024
        • By Source
        • By Application
        • By Product Form
        • By Channel
        • By Claim
    • Poland
      • Pricing Analysis
      • Market Share Analysis, 2024
        • By Source
        • By Application
        • By Product Form
        • By Channel
        • By Claim
    • Hungary
      • Pricing Analysis
      • Market Share Analysis, 2024
        • By Source
        • By Application
        • By Product Form
        • By Channel
        • By Claim
    • Kingdom of Saudi Arabia
      • Pricing Analysis
      • Market Share Analysis, 2024
        • By Source
        • By Application
        • By Product Form
        • By Channel
        • By Claim
    • South Africa
      • Pricing Analysis
      • Market Share Analysis, 2024
        • By Source
        • By Application
        • By Product Form
        • By Channel
        • By Claim
  19. Market Structure Analysis
    • Competition Dashboard
    • Competition Benchmarking
    • Market Share Analysis of Top Players
      • By Regional
      • By Source
      • By Application
      • By Product Form
      • By Channel
      • By Claim
  20. Competition Analysis
    • Competition Deep Dive
      • Sensient Cosmetic Technologies
        • Overview
        • Product Portfolio
        • Profitability by Market Segments (Product/Age /Sales Channel/Region)
        • Sales Footprint
        • Strategy Overview
        • DIC / Sun Chemical
        • Givaudan Active Beauty
        • BASF
        • Croda
        • Kobo Products
        • Seppic
        • Greentech
        • Algatech
        • Colorchem
  21. Assumptions & Acronyms Used
  22. Research Methodology

List of Tables

  • Table 1: Global Market Value (USD Million) Forecast by Region, 2020-2035
  • Table 2: Global Market Value (USD Million) Forecast by Source, 2020-2035
  • Table 3: Global Market Value (USD Million) Forecast by Application, 2020-2035
  • Table 4: Global Market Value (USD Million) Forecast by Product Form, 2020-2035
  • Table 5: Global Market Value (USD Million) Forecast by Channel, 2020-2035
  • Table 6: Global Market Value (USD Million) Forecast by Claim, 2020-2035
  • Table 7: North America Market Value (USD Million) Forecast by Country, 2020-2035
  • Table 8: North America Market Value (USD Million) Forecast by Source, 2020-2035
  • Table 9: North America Market Value (USD Million) Forecast by Application, 2020-2035
  • Table 10: North America Market Value (USD Million) Forecast by Product Form, 2020-2035
  • Table 11: North America Market Value (USD Million) Forecast by Channel, 2020-2035
  • Table 12: North America Market Value (USD Million) Forecast by Claim, 2020-2035
  • Table 13: Latin America Market Value (USD Million) Forecast by Country, 2020-2035
  • Table 14: Latin America Market Value (USD Million) Forecast by Source, 2020-2035
  • Table 15: Latin America Market Value (USD Million) Forecast by Application, 2020-2035
  • Table 16: Latin America Market Value (USD Million) Forecast by Product Form, 2020-2035
  • Table 17: Latin America Market Value (USD Million) Forecast by Channel, 2020-2035
  • Table 18: Latin America Market Value (USD Million) Forecast by Claim, 2020-2035
  • Table 19: Europe Market Value (USD Million) Forecast by Country, 2020-2035
  • Table 20: Europe Market Value (USD Million) Forecast by Source, 2020-2035
  • Table 21: Europe Market Value (USD Million) Forecast by Application, 2020-2035
  • Table 22: Europe Market Value (USD Million) Forecast by Product Form, 2020-2035
  • Table 23: Europe Market Value (USD Million) Forecast by Channel, 2020-2035
  • Table 24: Europe Market Value (USD Million) Forecast by Claim, 2020-2035
  • Table 25: East Asia Market Value (USD Million) Forecast by Country, 2020-2035
  • Table 26: East Asia Market Value (USD Million) Forecast by Source, 2020-2035
  • Table 27: East Asia Market Value (USD Million) Forecast by Application, 2020-2035
  • Table 28: East Asia Market Value (USD Million) Forecast by Product Form, 2020-2035
  • Table 29: East Asia Market Value (USD Million) Forecast by Channel, 2020-2035
  • Table 30: East Asia Market Value (USD Million) Forecast by Claim, 2020-2035
  • Table 31: South Asia & Pacific Market Value (USD Million) Forecast by Country, 2020-2035
  • Table 32: South Asia & Pacific Market Value (USD Million) Forecast by Source, 2020-2035
  • Table 33: South Asia & Pacific Market Value (USD Million) Forecast by Application, 2020-2035
  • Table 34: South Asia & Pacific Market Value (USD Million) Forecast by Product Form, 2020-2035
  • Table 35: South Asia & Pacific Market Value (USD Million) Forecast by Channel, 2020-2035
  • Table 36: South Asia & Pacific Market Value (USD Million) Forecast by Claim, 2020-2035
  • Table 37: Middle East and Africa Market Value (USD Million) Forecast by Country, 2020-2035
  • Table 38: Middle East and Africa Market Value (USD Million) Forecast by Source, 2020-2035
  • Table 39: Middle East and Africa Market Value (USD Million) Forecast by Application, 2020-2035
  • Table 40: Middle East and Africa Market Value (USD Million) Forecast by Product Form, 2020-2035
  • Table 41: Middle East and Africa Market Value (USD Million) Forecast by Channel, 2020-2035
  • Table 42: Middle East and Africa Market Value (USD Million) Forecast by Claim, 2020-2035

List of Figures

  • Figure 1: Global Market Pricing Analysis
  • Figure 2: Global Market Value (USD Million) Forecast 2020-2035
  • Figure 3: Global Market Value Share and BPS Analysis by Source, 2025 and 2035
  • Figure 4: Global Market Y-o-Y Growth Comparison by Source, 2025-2035
  • Figure 5: Global Market Attractiveness Analysis by Source
  • Figure 6: Global Market Value Share and BPS Analysis by Application, 2025 and 2035
  • Figure 7: Global Market Y-o-Y Growth Comparison by Application, 2025-2035
  • Figure 8: Global Market Attractiveness Analysis by Application
  • Figure 9: Global Market Value Share and BPS Analysis by Product Form, 2025 and 2035
  • Figure 10: Global Market Y-o-Y Growth Comparison by Product Form, 2025-2035
  • Figure 11: Global Market Attractiveness Analysis by Product Form
  • Figure 12: Global Market Value Share and BPS Analysis by Channel, 2025 and 2035
  • Figure 13: Global Market Y-o-Y Growth Comparison by Channel, 2025-2035
  • Figure 14: Global Market Attractiveness Analysis by Channel
  • Figure 15: Global Market Value Share and BPS Analysis by Claim, 2025 and 2035
  • Figure 16: Global Market Y-o-Y Growth Comparison by Claim, 2025-2035
  • Figure 17: Global Market Attractiveness Analysis by Claim
  • Figure 18: Global Market Value (USD Million) Share and BPS Analysis by Region, 2025 and 2035
  • Figure 19: Global Market Y-o-Y Growth Comparison by Region, 2025-2035
  • Figure 20: Global Market Attractiveness Analysis by Region
  • Figure 21: North America Market Incremental $ Opportunity, 2025-2035
  • Figure 22: Latin America Market Incremental $ Opportunity, 2025-2035
  • Figure 23: Europe Market Incremental $ Opportunity, 2025-2035
  • Figure 24: East Asia Market Incremental $ Opportunity, 2025-2035
  • Figure 25: South Asia & Pacific Market Incremental $ Opportunity, 2025-2035
  • Figure 26: Middle East and Africa Market Incremental $ Opportunity, 2025-2035
  • Figure 27: North America Market Value Share and BPS Analysis by Country, 2025 and 2035
  • Figure 28: North America Market Value Share and BPS Analysis by Source, 2025 and 2035
  • Figure 29: North America Market Y-o-Y Growth Comparison by Source, 2025-2035
  • Figure 30: North America Market Attractiveness Analysis by Source
  • Figure 31: North America Market Value Share and BPS Analysis by Application, 2025 and 2035
  • Figure 32: North America Market Y-o-Y Growth Comparison by Application, 2025-2035
  • Figure 33: North America Market Attractiveness Analysis by Application
  • Figure 34: North America Market Value Share and BPS Analysis by Product Form, 2025 and 2035
  • Figure 35: North America Market Y-o-Y Growth Comparison by Product Form, 2025-2035
  • Figure 36: North America Market Attractiveness Analysis by Product Form
  • Figure 37: North America Market Value Share and BPS Analysis by Channel, 2025 and 2035
  • Figure 38: North America Market Y-o-Y Growth Comparison by Channel, 2025-2035
  • Figure 39: North America Market Attractiveness Analysis by Channel
  • Figure 40: North America Market Value Share and BPS Analysis by Claim, 2025 and 2035
  • Figure 41: North America Market Y-o-Y Growth Comparison by Claim, 2025-2035
  • Figure 42: North America Market Attractiveness Analysis by Claim
  • Figure 43: Latin America Market Value Share and BPS Analysis by Country, 2025 and 2035
  • Figure 44: Latin America Market Value Share and BPS Analysis by Source, 2025 and 2035
  • Figure 45: Latin America Market Y-o-Y Growth Comparison by Source, 2025-2035
  • Figure 46: Latin America Market Attractiveness Analysis by Source
  • Figure 47: Latin America Market Value Share and BPS Analysis by Application, 2025 and 2035
  • Figure 48: Latin America Market Y-o-Y Growth Comparison by Application, 2025-2035
  • Figure 49: Latin America Market Attractiveness Analysis by Application
  • Figure 50: Latin America Market Value Share and BPS Analysis by Product Form, 2025 and 2035
  • Figure 51: Latin America Market Y-o-Y Growth Comparison by Product Form, 2025-2035
  • Figure 52: Latin America Market Attractiveness Analysis by Product Form
  • Figure 53: Latin America Market Value Share and BPS Analysis by Channel, 2025 and 2035
  • Figure 54: Latin America Market Y-o-Y Growth Comparison by Channel, 2025-2035
  • Figure 55: Latin America Market Attractiveness Analysis by Channel
  • Figure 56: Latin America Market Value Share and BPS Analysis by Claim, 2025 and 2035
  • Figure 57: Latin America Market Y-o-Y Growth Comparison by Claim, 2025-2035
  • Figure 58: Latin America Market Attractiveness Analysis by Claim
  • Figure 59: Europe Market Value Share and BPS Analysis by Country, 2025 and 2035
  • Figure 60: Europe Market Value Share and BPS Analysis by Source, 2025 and 2035
  • Figure 61: Europe Market Y-o-Y Growth Comparison by Source, 2025-2035
  • Figure 62: Europe Market Attractiveness Analysis by Source
  • Figure 63: Europe Market Value Share and BPS Analysis by Application, 2025 and 2035
  • Figure 64: Europe Market Y-o-Y Growth Comparison by Application, 2025-2035
  • Figure 65: Europe Market Attractiveness Analysis by Application
  • Figure 66: Europe Market Value Share and BPS Analysis by Product Form, 2025 and 2035
  • Figure 67: Europe Market Y-o-Y Growth Comparison by Product Form, 2025-2035
  • Figure 68: Europe Market Attractiveness Analysis by Product Form
  • Figure 69: Europe Market Value Share and BPS Analysis by Channel, 2025 and 2035
  • Figure 70: Europe Market Y-o-Y Growth Comparison by Channel, 2025-2035
  • Figure 71: Europe Market Attractiveness Analysis by Channel
  • Figure 72: Europe Market Value Share and BPS Analysis by Claim, 2025 and 2035
  • Figure 73: Europe Market Y-o-Y Growth Comparison by Claim, 2025-2035
  • Figure 74: Europe Market Attractiveness Analysis by Claim
  • Figure 75: East Asia Market Value Share and BPS Analysis by Country, 2025 and 2035
  • Figure 76: East Asia Market Value Share and BPS Analysis by Source, 2025 and 2035
  • Figure 77: East Asia Market Y-o-Y Growth Comparison by Source, 2025-2035
  • Figure 78: East Asia Market Attractiveness Analysis by Source
  • Figure 79: East Asia Market Value Share and BPS Analysis by Application, 2025 and 2035
  • Figure 80: East Asia Market Y-o-Y Growth Comparison by Application, 2025-2035
  • Figure 81: East Asia Market Attractiveness Analysis by Application
  • Figure 82: East Asia Market Value Share and BPS Analysis by Product Form, 2025 and 2035
  • Figure 83: East Asia Market Y-o-Y Growth Comparison by Product Form, 2025-2035
  • Figure 84: East Asia Market Attractiveness Analysis by Product Form
  • Figure 85: East Asia Market Value Share and BPS Analysis by Channel, 2025 and 2035
  • Figure 86: East Asia Market Y-o-Y Growth Comparison by Channel, 2025-2035
  • Figure 87: East Asia Market Attractiveness Analysis by Channel
  • Figure 88: East Asia Market Value Share and BPS Analysis by Claim, 2025 and 2035
  • Figure 89: East Asia Market Y-o-Y Growth Comparison by Claim, 2025-2035
  • Figure 90: East Asia Market Attractiveness Analysis by Claim
  • Figure 91: South Asia & Pacific Market Value Share and BPS Analysis by Country, 2025 and 2035
  • Figure 92: South Asia & Pacific Market Value Share and BPS Analysis by Source, 2025 and 2035
  • Figure 93: South Asia & Pacific Market Y-o-Y Growth Comparison by Source, 2025-2035
  • Figure 94: South Asia & Pacific Market Attractiveness Analysis by Source
  • Figure 95: South Asia & Pacific Market Value Share and BPS Analysis by Application, 2025 and 2035
  • Figure 96: South Asia & Pacific Market Y-o-Y Growth Comparison by Application, 2025-2035
  • Figure 97: South Asia & Pacific Market Attractiveness Analysis by Application
  • Figure 98: South Asia & Pacific Market Value Share and BPS Analysis by Product Form, 2025 and 2035
  • Figure 99: South Asia & Pacific Market Y-o-Y Growth Comparison by Product Form, 2025-2035
  • Figure 100: South Asia & Pacific Market Attractiveness Analysis by Product Form
  • Figure 101: South Asia & Pacific Market Value Share and BPS Analysis by Channel, 2025 and 2035
  • Figure 102: South Asia & Pacific Market Y-o-Y Growth Comparison by Channel, 2025-2035
  • Figure 103: South Asia & Pacific Market Attractiveness Analysis by Channel
  • Figure 104: South Asia & Pacific Market Value Share and BPS Analysis by Claim, 2025 and 2035
  • Figure 105: South Asia & Pacific Market Y-o-Y Growth Comparison by Claim, 2025-2035
  • Figure 106: South Asia & Pacific Market Attractiveness Analysis by Claim
  • Figure 107: Middle East and Africa Market Value Share and BPS Analysis by Country, 2025 and 2035
  • Figure 108: Middle East and Africa Market Value Share and BPS Analysis by Source, 2025 and 2035
  • Figure 109: Middle East and Africa Market Y-o-Y Growth Comparison by Source, 2025-2035
  • Figure 110: Middle East and Africa Market Attractiveness Analysis by Source
  • Figure 111: Middle East and Africa Market Value Share and BPS Analysis by Application, 2025 and 2035
  • Figure 112: Middle East and Africa Market Y-o-Y Growth Comparison by Application, 2025-2035
  • Figure 113: Middle East and Africa Market Attractiveness Analysis by Application
  • Figure 114: Middle East and Africa Market Value Share and BPS Analysis by Product Form, 2025 and 2035
  • Figure 115: Middle East and Africa Market Y-o-Y Growth Comparison by Product Form, 2025-2035
  • Figure 116: Middle East and Africa Market Attractiveness Analysis by Product Form
  • Figure 117: Middle East and Africa Market Value Share and BPS Analysis by Channel, 2025 and 2035
  • Figure 118: Middle East and Africa Market Y-o-Y Growth Comparison by Channel, 2025-2035
  • Figure 119: Middle East and Africa Market Attractiveness Analysis by Channel
  • Figure 120: Middle East and Africa Market Value Share and BPS Analysis by Claim, 2025 and 2035
  • Figure 121: Middle East and Africa Market Y-o-Y Growth Comparison by Claim, 2025-2035
  • Figure 122: Middle East and Africa Market Attractiveness Analysis by Claim
  • Figure 123: Global Market - Tier Structure Analysis
  • Figure 124: Global Market - Company Share Analysis

Frequently Asked Questions

How big is the Algae-Based Eco-Pigments Market in 2025?

The global Algae-Based Eco-Pigments Market is estimated to be valued at USD 1,052.3 million in 2025.

What will be the size of the Algae-Based Eco-Pigments Market in 2035?

The market size for the Algae-Based Eco-Pigments Market is projected to reach USD 3,503.2 million by 2035.

How much will be the Algae-Based Eco-Pigments Market growth between 2025 and 2035?

The Algae-Based Eco-Pigments Market is expected to grow at a 12.8% CAGR between 2025 and 2035.

What are the key product types in the Algae-Based Eco-Pigments Market?

The key product forms in the Algae-Based Eco-Pigments Market are powder pigments, liquid dispersions, gel-based pigments, and encapsulated pigments.

Which application segment is expected to contribute significant share in the Algae-Based Eco-Pigments Market in 2025?

In terms of application, makeup (eyes, lips, face) is expected to command 52% share in 2025, making it the leading segment.

Future Market Insights

Algae-Based Eco-Pigments Market

Chat With

MaRIA

Hi There, I am MaRIA, Your Market Research Intelligence Assistant. How may I help you?