Reports

- Global Locations -

Headquarters

Future Market Insights, Inc.

Christiana Corporate, 200
Continental Drive, Suite 401,
Newark, Delaware - 19713,
United States

T: +1-845-579-5705

Americas

Future Market Insights, Inc.

616 Corporate Way, Suite 2-9018,
Valley Cottage, NY 10989, United States

T: +1-347-918-3531

MEA

Future Market Insights

1602-6 Jumeirah Bay X2 Tower, Plot No: JLT-PH2-X2A,
Jumeirah Lakes Towers, Dubai,
United Arab Emirates

Europe

Future Market Insights

3rd Floor, 207 Regent Street,
W1B 3HH London
United Kingdom

T: + 44 (0) 20 8123 9659
D: +44 (0) 20 3287 4268

Asia Pacific

Future Market Insights

IndiaLand Global Tech Park, Unit UG-1, Behind Grand HighStreet, Phase 1, Hinjawadi, MH, Pune – 411057, India

Burns Treatment Market Snapshot (2023 to 2033)

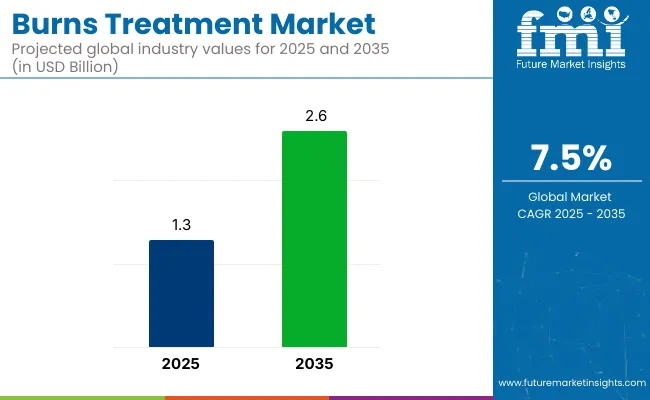
The global Burns Treatment Market is expected to garner a market value of US$ 1.2 Billion in 2023 and is expected to accumulate a market value of US$ 2.59 Billion by registering a CAGR of 8% in the forecast period 2023 to 2033. The market for Burns Treatment registered a CAGR of 5% in the historical period 2018 to 2022.

The burn treatment market is a segment of the healthcare industry that deals with the treatment of burn injuries. Burn injuries can range from minor to severe and can have a significant impact on a person's quality of life. The burn treatment market offers a range of products and services for the management and treatment of burn injuries, including wound dressings, topical agents, pain management products, and reconstructive surgery products.

Report Attribute Details
Expected Market Value (2023) US$ 1.2 Billion
Anticipated Forecast Value (2033) US$ 2.59 Billion
Projected Growth Rate (2023 to 2033) 8% CAGR

Don't pay for what you don't need

Customize your report by selecting specific countries or regions and save 30%!

2018 to 2022 Burns Treatment Market Demand Analysis vs. Forecast 2023 to 2033

According to market research and competitive intelligence provider Future Market Insights- the market for Burns Treatment reflected a value of 5% during the historical period, 2018 to 2022.

A series of international level collaborations involving healthcare stakeholders across various institutional settings are fueling further clinical trials and research studies dedicated to discovering effective ways for Burns Treatment.

According to the National Center for Biotechnology Information, Approximately 486,000 patients require treatment for burns, and 40,000 require hospitalization within the United States each year. Nationally, 70% of patients who are burned receive burns that comprise less than 10% total body surface area (%TBSA), and 88% of all patients receive a less than 20% TBSA burn

In its new study, ESOMAR-certified market research and consulting firm Future Market Insights (FMI) offers insights about key factors driving demand for Burns Treatment. In the years to come, increasing focus by government organizations and private agencies like WHO and pharmaceutical companies to create awareness of burn treatments is fuelling the market growth. Thus, the market for Burns Treatment is expected to register a CAGR of 8% in the forecast period 2023 to 2033.

Which are Some Prominent Drivers of the Burns Treatment Market?

Increased Prevalence of the Burn Injuries to Push the Market Growth

WHO reports that burns are a global public health problem, accounting for an estimated 180,000 deaths annually. The majority of these occur in low- and middle-income countries and almost two thirds occur in the WHO African and South-East Asia regions. In many high-income countries, burn death rates have been decreasing, and the rate of child deaths from burns is currently over 7 times higher in low- and middle-income countries than in high-income countries.

The rise in burn cases has fueled the need for advanced dressings like alginate, hydrogel, foam, hydrocolloid, collagen, etc. and biologics like skin grafts and traditional burn treatment products. With a variety of such products available, awareness of burn treatment among patients and healthcare professionals like surgeons, doctors, and nurses is growing.

For instance, in June 2022, The USA Food and Drug Administration approved StrataGraft for the treatment of deep partial thickness burns in adult patients. These burns are caused by direct contact with heat sources such as fire, hot surfaces, scalding water, or steam. StrataGraft offers healthcare professionals a new way to treat burn wounds and improve patient recovery by helping them return to their highest level of functionality and quality of life.

The treatment involves applying StrataGraft, made from human skin cells grown together to form a bi-layered construct, onto the burn. This can help reduce the need for skin grafting, where healthy skin is taken from the patient's body to cover the burn wound, leaving a new wound where the skin was removed. Over time, the patient's skin cells should grow to replace the lost skin cells, promoting healing.

Sabyasachi Ghosh
Sabyasachi Ghosh

Principal Consultant

Talk to Analyst

Find your sweet spots for generating winning opportunities in this market.

What are the Challenges Faced by the Burns Treatment Market?

Expensive Cost of Treatment to restrict Market Growth

The market is projected to get significantly affected by the challenging factors such as limited availability and high cost of advanced burn treatment products, lack of trained healthcare professionals in burn treatment, limited access to quality burn care facilities in developing countries, stringent government regulations for approval of burn treatment products, insufficient reimbursement for burn treatment procedures, competition from alternative treatments such as skin grafting and tissue engineering, risk of infections and other complications during burn wound treatment and so on.

Furthermore, lack of health remuneration policies, rise in cost, and side effects associated with certain treatments is expected to hinder the market growth.

Region-Wise Insights

How is the Burns Treatment Market Turning Out in the Asia Pacific Region?

Improvement in healthcare spending propelling growth of Burns Treatment in Asia Pacific

The Asia Pacific is expected to exhibit the significant growth rate of all regions over the forecast period, with a CAGR of 5% during the forecast period. The growth is owed to increased awareness, significant increases in healthcare spending, and a rising frequency of Burns Treatment Market in the region. Asia Pacific is an emerging market due to the increase in point of care approach to health & care. Increasing number of hospitals in India and China makes a promising market for the market worldwide.

India is expected to dominate the burn treatment market due to its large population and easy access to burn treatment products. The high population density increases the risk of cross-infection among patients, which is why top hospitals in India have equipped themselves with 30 isolated cubicles in ICUs and 10 private isolation beds to reduce the spread of infection. These factors make India a lucrative market for burn treatment products.

What are the Factors Boosting the Market for Burns Treatment in North America?

Technological Advancements Shaping Landscape for Burns Treatment in North America

North America is anticipated to acquire a market share of about 25% in the forecast period. This growth is attributable to the rising prevalence of the condition in the region. According to a 2018 report by the American Burn Association, over 300 children are treated in emergency rooms in the United States each day, with roughly two children dying from burn injuries. In the USA, children aged 16 and under account for roughly 26% of all burn center admissions. In addition, the National Center for Biotechnology Information (NCBI) estimates that 486,000 individuals are injured by fire each year. Thereby, the demand for burn treatment is anticipated to be in high demand as a result of a high rate of burns.

Furthermore, government initiatives and increase in the number of research partnerships are boosting the market growth across North America. The United States of America leads the regional market owing to the rising awareness about the condition and increasing number of populations with burn injuries is pushing the market growth.

Get the data you need at a Fraction of the cost

Personalize your report by choosing insights you need
and save 40%!

Category-Wise Insights

By Treatment, Which Segment is Likely to Account for a Prominent Share?

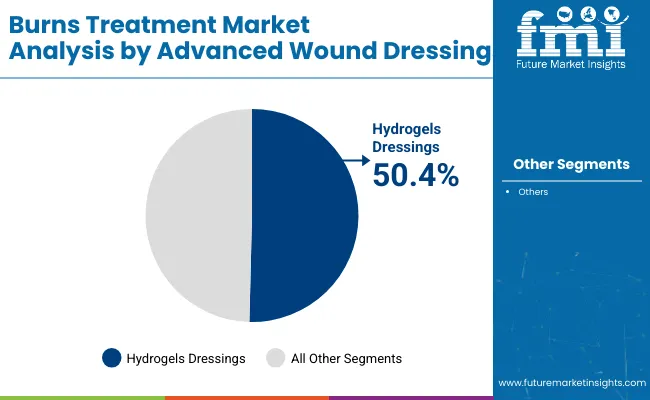
Wound care dressings as an effective treatment to drive the market

According to the FMI analysis, alginate dressings are expected to grow with a CAGR of 7%. Alginate is a key component in various wound dressings such as hydrogels, films, wafers, foams, nanofibers, and topical preparations. The ability of alginate dressings to absorb excess wound fluid, create a moist environment, and reduce the risk of bacterial infections has driven the sales of these products. Alginate, a biopolymer, is widely used in biomedical applications due to its biocompatibility and non-toxicity, with wound healing being a particularly appealing use.

By Degree of Burn, Which Segment is Likely to Account for a Significant Share?

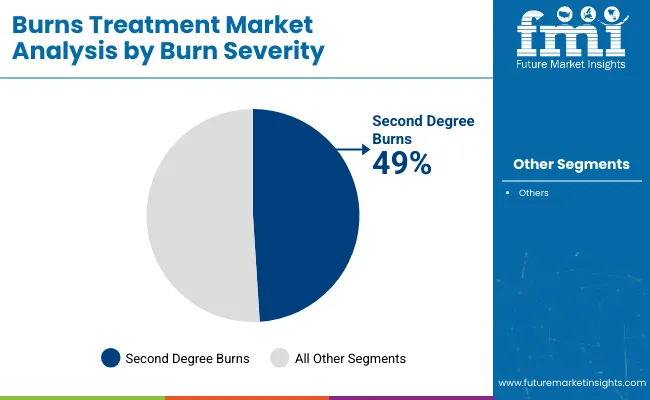
Second degree burns to take the lead and drive market growth

The second-degree burn segment is projected to grow at the fastest pace over the forecast period. Chronic wounds, including partial-thickness and full-thickness burns, take longer to heal and can cover more than 15% of the body. According to the FDA, around 40,000 people are hospitalized annually due to partial burns. The demand for biologics, like skin grafts and advanced dressings, is increasing to treat partial burns, driving the growth of the segment. Furthermore, favorable reimbursement policies in developed countries for second degree burn patients are expected to drive the segment's growth.

Market Competition

Key players in the Burns Treatment Market are Smith & Nephew, ConvaTec Group, B. Braun Melsungen AG, Molnlycke Health Care, Integra LifeSciences, Coloplast A/S, Paul Hartmann AG, 3M, Acelity L.P. Inc., and Medtronic among other global players.

  • In June 2022, the British Columbia Children's Hospital, Canada, received about USD 1 million from the BC Professional Fire Fighters Burn Fund to support specialized care for kids with burn injuries.
  • In June 2021, the United States Food and Drug Administration (FDA) approved Avita Medical's expanded use of the RECELL System in combination with meshed autografting for treating all sizes of acute full-thickness thermal burn wounds for both pediatric and adult patients.

Report Scope

Report Attribute Details
Market Value in 2023 US$ 1.2 Billion
Market Value in 2033 US$ 2.59 Billion
Growth Rate CAGR of 8% from 2023 to 2033
Base Year for Estimation 2022
Historical Data 2018 to 2022
Forecast Period 2023 to 2033
Quantitative Units Revenue in USD Million and CAGR from 2023 to 2033
Report Coverage Revenue Forecast, Volume Forecast, Company Ranking, Competitive Landscape, Growth Factors, Trends and Pricing Analysis
Segments Covered
  • Treatment Type
  • Degree of Burn
  • Region
Regions Covered
  • North America
  • Latin America
  • Europe
  • South Asia
  • East Asia
  • Middle East & Africa
  • Oceania
Key Countries Profiled
  • USA
  • Canada
  • Brazil
  • Argentina
  • Germany
  • United Kingdom
  • France
  • Spain
  • Italy
  • Nordics
  • BENELUX
  • Australia & New Zealand
  • China
  • India
  • Association of Southeast Asian Nations
  • Gulf Cooperation Council
  • South Africa
Key Companies Profiled
  • Smith & Nephew
  • ConvaTec Group
  • B. Braun Melsungen AG
  • Molnlycke Health Care
  • Integra LifeSciences
  • Coloplast A/S
  • Paul Hartmann AG
  • 3M
  • Acelity L.P. Inc.
  • Medtronic
Customization Available Upon Request

Key Segments Profiled in the Burns Treatment Industry Survey

Treatment Type:

  • Wound Care Dressings
    • Antimicrobial Dressings
    • Hydrocolloid Dressings
    • Hydrogel Dressings
    • Film Dressings
    • Foam Dressings
    • Alginate Dressings
  • Wound Care Therapy
    • Thermal Burn Therapy
    • Negative Pressure Wound Therapy
    • Ultrasound Therapy
    • Hyperbaric Oxygen Therapy
  • Medications
    • Burn Creams & Ointments
    • Anti-infective Drugs
    • Painkillers & Anti-anxiety Medications
    • IV-Fluids & Therapeutic Peptide

Degree of Burn

  • First-degree Burns
  • Second-degree Burns
  • Third-degree Burns

Region:

  • North America
  • Latin America
  • Europe
  • South Asia
  • East Asia
  • Middle East & Africa
  • Oceania

Frequently Asked Questions

What Might be the Net Worth of Burns Treatment Market in 2023?

The market’s net worth is expected to be US$ 1.2 billion in 2023.

What is the Projected Market Value?

The projected market value of burns treatment is US$ 2.59 billion by 2033.

What is Asia Pacific’s Growth Potential?

The Asia Pacific is expected to expand at a CAGR of 5% over the forecast period.

Which Treatment is Preferred for Treating Burns?

Wound care dressings are preferred for treating burns.

Which Degree of Burn Accounts for Considerable Share?

Second degree burns account for considerable market share.

Table of Content

1. Executive Summary | Burns Treatment Market

    1.1. Global Market Outlook

    1.2. Demand-side Trends

    1.3. Supply-side Trends

    1.4. Technology Roadmap Analysis

    1.5. Analysis and Recommendations

2. Market Overview

    2.1. Market Coverage / Taxonomy

    2.2. Market Definition / Scope / Limitations

3. Market Background

    3.1. Market Dynamics

        3.1.1. Drivers

        3.1.2. Restraints

        3.1.3. Opportunity

        3.1.4. Trends

    3.2. Scenario Forecast

        3.2.1. Demand in Optimistic Scenario

        3.2.2. Demand in Likely Scenario

        3.2.3. Demand in Conservative Scenario

    3.3. Opportunity Map Analysis

    3.4. Investment Feasibility Matrix

    3.5. PESTLE and Porter’s Analysis

    3.6. Regulatory Landscape

        3.6.1. By Key Regions

        3.6.2. By Key Countries

    3.7. Regional Parent Market Outlook

4. Global Market Analysis 2018 to 2022 and Forecast, 2023 to 2033

    4.1. Historical Market Size Value (US$ Million) Analysis, 2018 to 2022

    4.2. Current and Future Market Size Value (US$ Million) Projections, 2023 to 2033

        4.2.1. Y-o-Y Growth Trend Analysis

        4.2.2. Absolute $ Opportunity Analysis

5. Global Market Analysis 2018 to 2022 and Forecast 2023 to 2033, By Treatment Type

    5.1. Introduction / Key Findings

    5.2. Historical Market Size Value (US$ Million) Analysis By Treatment Type, 2018 to 2022

    5.3. Current and Future Market Size Value (US$ Million) Analysis and Forecast By Treatment Type, 2023 to 2033

        5.3.1. Wound Care Dressings

            5.3.1.1. Antimicrobial Dressings

            5.3.1.2. Hydrocolloid Dressings

            5.3.1.3. Hydrogel Dressings

            5.3.1.4. Film Dressings

            5.3.1.5. Foam Dressings

            5.3.1.6. Alginate Dressings

        5.3.2. Wound Care Therapy

            5.3.2.1. Thermal Burn Therapy

            5.3.2.2. Negative Pressure Wound Therapy

            5.3.2.3. Ultrasound Therapy

            5.3.2.4. Hyperbaric Oxygen Therapy

        5.3.3. Medications

            5.3.3.1. Burn Creams & Ointments

            5.3.3.2. Anti-infective Drugs

            5.3.3.3. Painkillers & Anti-anxiety Medications

            5.3.3.4. IV-Fluids & Therapeutic Peptide Nutrition

        5.3.4. Surgeries

    5.4. Y-o-Y Growth Trend Analysis By Treatment Type, 2018 to 2022

    5.5. Absolute $ Opportunity Analysis By Treatment Type, 2023 to 2033

6. Global Market Analysis 2018 to 2022 and Forecast 2023 to 2033, By Degree of Burn

    6.1. Introduction / Key Findings

    6.2. Historical Market Size Value (US$ Million) Analysis By Degree of Burn, 2018 to 2022

    6.3. Current and Future Market Size Value (US$ Million) Analysis and Forecast By Degree of Burn, 2023 to 2033

        6.3.1. First-degree Burns

        6.3.2. Second-degree Burns

        6.3.3. Third-degree Burns

    6.4. Y-o-Y Growth Trend Analysis By Degree of Burn, 2018 to 2022

    6.5. Absolute $ Opportunity Analysis By Degree of Burn, 2023 to 2033

7. Global Market Analysis 2018 to 2022 and Forecast 2023 to 2033, By Region

    7.1. Introduction

    7.2. Historical Market Size Value (US$ Million) Analysis By Region, 2018 to 2022

    7.3. Current Market Size Value (US$ Million) Analysis and Forecast By Region, 2023 to 2033

        7.3.1. North America

        7.3.2. Latin America

        7.3.3. Europe

        7.3.4. South Asia

        7.3.5. East Asia

        7.3.6. Oceania

        7.3.7. MEA

    7.4. Market Attractiveness Analysis By Region

8. North America Market Analysis 2018 to 2022 and Forecast 2023 to 2033, By Country

    8.1. Historical Market Size Value (US$ Million) Trend Analysis By Market Taxonomy, 2018 to 2022

    8.2. Market Size Value (US$ Million) Forecast By Market Taxonomy, 2023 to 2033

        8.2.1. By Country

            8.2.1.1. USA

            8.2.1.2. Canada

        8.2.2. By Treatment Type

        8.2.3. By Degree of Burn

    8.3. Market Attractiveness Analysis

        8.3.1. By Country

        8.3.2. By Treatment Type

        8.3.3. By Degree of Burn

    8.4. Key Takeaways

9. Latin America Market Analysis 2018 to 2022 and Forecast 2023 to 2033, By Country

    9.1. Historical Market Size Value (US$ Million) Trend Analysis By Market Taxonomy, 2018 to 2022

    9.2. Market Size Value (US$ Million) Forecast By Market Taxonomy, 2023 to 2033

        9.2.1. By Country

            9.2.1.1. Brazil

            9.2.1.2. Mexico

            9.2.1.3. Rest of Latin America

        9.2.2. By Treatment Type

        9.2.3. By Degree of Burn

    9.3. Market Attractiveness Analysis

        9.3.1. By Country

        9.3.2. By Treatment Type

        9.3.3. By Degree of Burn

    9.4. Key Takeaways

10. Europe Market Analysis 2018 to 2022 and Forecast 2023 to 2033, By Country

    10.1. Historical Market Size Value (US$ Million) Trend Analysis By Market Taxonomy, 2018 to 2022

    10.2. Market Size Value (US$ Million) Forecast By Market Taxonomy, 2023 to 2033

        10.2.1. By Country

            10.2.1.1. Germany

            10.2.1.2. United Kingdom

            10.2.1.3. France

            10.2.1.4. Spain

            10.2.1.5. Italy

            10.2.1.6. Rest of Europe

        10.2.2. By Treatment Type

        10.2.3. By Degree of Burn

    10.3. Market Attractiveness Analysis

        10.3.1. By Country

        10.3.2. By Treatment Type

        10.3.3. By Degree of Burn

    10.4. Key Takeaways

11. South Asia Market Analysis 2018 to 2022 and Forecast 2023 to 2033, By Country

    11.1. Historical Market Size Value (US$ Million) Trend Analysis By Market Taxonomy, 2018 to 2022

    11.2. Market Size Value (US$ Million) Forecast By Market Taxonomy, 2023 to 2033

        11.2.1. By Country

            11.2.1.1. India

            11.2.1.2. Malaysia

            11.2.1.3. Singapore

            11.2.1.4. Thailand

            11.2.1.5. Rest of South Asia

        11.2.2. By Treatment Type

        11.2.3. By Degree of Burn

    11.3. Market Attractiveness Analysis

        11.3.1. By Country

        11.3.2. By Treatment Type

        11.3.3. By Degree of Burn

    11.4. Key Takeaways

12. East Asia Market Analysis 2018 to 2022 and Forecast 2023 to 2033, By Country

    12.1. Historical Market Size Value (US$ Million) Trend Analysis By Market Taxonomy, 2018 to 2022

    12.2. Market Size Value (US$ Million) Forecast By Market Taxonomy, 2023 to 2033

        12.2.1. By Country

            12.2.1.1. China

            12.2.1.2. Japan

            12.2.1.3. South Korea

        12.2.2. By Treatment Type

        12.2.3. By Degree of Burn

    12.3. Market Attractiveness Analysis

        12.3.1. By Country

        12.3.2. By Treatment Type

        12.3.3. By Degree of Burn

    12.4. Key Takeaways

13. Oceania Market Analysis 2018 to 2022 and Forecast 2023 to 2033, By Country

    13.1. Historical Market Size Value (US$ Million) Trend Analysis By Market Taxonomy, 2018 to 2022

    13.2. Market Size Value (US$ Million) Forecast By Market Taxonomy, 2023 to 2033

        13.2.1. By Country

            13.2.1.1. Australia

            13.2.1.2. New Zealand

        13.2.2. By Treatment Type

        13.2.3. By Degree of Burn

    13.3. Market Attractiveness Analysis

        13.3.1. By Country

        13.3.2. By Treatment Type

        13.3.3. By Degree of Burn

    13.4. Key Takeaways

14. MEA Market Analysis 2018 to 2022 and Forecast 2023 to 2033, By Country

    14.1. Historical Market Size Value (US$ Million) Trend Analysis By Market Taxonomy, 2018 to 2022

    14.2. Market Size Value (US$ Million) Forecast By Market Taxonomy, 2023 to 2033

        14.2.1. By Country

            14.2.1.1. GCC Countries

            14.2.1.2. South Africa

            14.2.1.3. Israel

            14.2.1.4. Rest of MEA

        14.2.2. By Treatment Type

        14.2.3. By Degree of Burn

    14.3. Market Attractiveness Analysis

        14.3.1. By Country

        14.3.2. By Treatment Type

        14.3.3. By Degree of Burn

    14.4. Key Takeaways

15. Key Countries Market Analysis

    15.1. USA

        15.1.1. Pricing Analysis

        15.1.2. Market Share Analysis, 2022

            15.1.2.1. By Treatment Type

            15.1.2.2. By Degree of Burn

    15.2. Canada

        15.2.1. Pricing Analysis

        15.2.2. Market Share Analysis, 2022

            15.2.2.1. By Treatment Type

            15.2.2.2. By Degree of Burn

    15.3. Brazil

        15.3.1. Pricing Analysis

        15.3.2. Market Share Analysis, 2022

            15.3.2.1. By Treatment Type

            15.3.2.2. By Degree of Burn

    15.4. Mexico

        15.4.1. Pricing Analysis

        15.4.2. Market Share Analysis, 2022

            15.4.2.1. By Treatment Type

            15.4.2.2. By Degree of Burn

    15.5. Germany

        15.5.1. Pricing Analysis

        15.5.2. Market Share Analysis, 2022

            15.5.2.1. By Treatment Type

            15.5.2.2. By Degree of Burn

    15.6. United Kingdom

        15.6.1. Pricing Analysis

        15.6.2. Market Share Analysis, 2022

            15.6.2.1. By Treatment Type

            15.6.2.2. By Degree of Burn

    15.7. France

        15.7.1. Pricing Analysis

        15.7.2. Market Share Analysis, 2022

            15.7.2.1. By Treatment Type

            15.7.2.2. By Degree of Burn

    15.8. Spain

        15.8.1. Pricing Analysis

        15.8.2. Market Share Analysis, 2022

            15.8.2.1. By Treatment Type

            15.8.2.2. By Degree of Burn

    15.9. Italy

        15.9.1. Pricing Analysis

        15.9.2. Market Share Analysis, 2022

            15.9.2.1. By Treatment Type

            15.9.2.2. By Degree of Burn

    15.10. India

        15.10.1. Pricing Analysis

        15.10.2. Market Share Analysis, 2022

            15.10.2.1. By Treatment Type

            15.10.2.2. By Degree of Burn

    15.11. Malaysia

        15.11.1. Pricing Analysis

        15.11.2. Market Share Analysis, 2022

            15.11.2.1. By Treatment Type

            15.11.2.2. By Degree of Burn

    15.12. Singapore

        15.12.1. Pricing Analysis

        15.12.2. Market Share Analysis, 2022

            15.12.2.1. By Treatment Type

            15.12.2.2. By Degree of Burn

    15.13. Thailand

        15.13.1. Pricing Analysis

        15.13.2. Market Share Analysis, 2022

            15.13.2.1. By Treatment Type

            15.13.2.2. By Degree of Burn

    15.14. China

        15.14.1. Pricing Analysis

        15.14.2. Market Share Analysis, 2022

            15.14.2.1. By Treatment Type

            15.14.2.2. By Degree of Burn

    15.15. Japan

        15.15.1. Pricing Analysis

        15.15.2. Market Share Analysis, 2022

            15.15.2.1. By Treatment Type

            15.15.2.2. By Degree of Burn

    15.16. South Korea

        15.16.1. Pricing Analysis

        15.16.2. Market Share Analysis, 2022

            15.16.2.1. By Treatment Type

            15.16.2.2. By Degree of Burn

    15.17. Australia

        15.17.1. Pricing Analysis

        15.17.2. Market Share Analysis, 2022

            15.17.2.1. By Treatment Type

            15.17.2.2. By Degree of Burn

    15.18. New Zealand

        15.18.1. Pricing Analysis

        15.18.2. Market Share Analysis, 2022

            15.18.2.1. By Treatment Type

            15.18.2.2. By Degree of Burn

    15.19. GCC Countries

        15.19.1. Pricing Analysis

        15.19.2. Market Share Analysis, 2022

            15.19.2.1. By Treatment Type

            15.19.2.2. By Degree of Burn

    15.20. South Africa

        15.20.1. Pricing Analysis

        15.20.2. Market Share Analysis, 2022

            15.20.2.1. By Treatment Type

            15.20.2.2. By Degree of Burn

    15.21. Israel

        15.21.1. Pricing Analysis

        15.21.2. Market Share Analysis, 2022

            15.21.2.1. By Treatment Type

            15.21.2.2. By Degree of Burn

16. Market Structure Analysis

    16.1. Competition Dashboard

    16.2. Competition Benchmarking

    16.3. Market Share Analysis of Top Players

        16.3.1. By Regional

        16.3.2. By Treatment Type

        16.3.3. By Degree of Burn

17. Competition Analysis

    17.1. Competition Deep Dive

        17.1.1. MediWound Germany GmbH

            17.1.1.1. Overview

            17.1.1.2. Product Portfolio

            17.1.1.3. Profitability by Market Segments

            17.1.1.4. Sales Footprint

            17.1.1.5. Strategy Overview

                17.1.1.5.1. Marketing Strategy

        17.1.2. Kaken Pharmaceutical Co., Ltd.

            17.1.2.1. Overview

            17.1.2.2. Product Portfolio

            17.1.2.3. Profitability by Market Segments

            17.1.2.4. Sales Footprint

            17.1.2.5. Strategy Overview

                17.1.2.5.1. Marketing Strategy

        17.1.3. Kerecis

            17.1.3.1. Overview

            17.1.3.2. Product Portfolio

            17.1.3.3. Profitability by Market Segments

            17.1.3.4. Sales Footprint

            17.1.3.5. Strategy Overview

                17.1.3.5.1. Marketing Strategy

        17.1.4. Mallinckrodt Pharmaceuticals

            17.1.4.1. Overview

            17.1.4.2. Product Portfolio

            17.1.4.3. Profitability by Market Segments

            17.1.4.4. Sales Footprint

            17.1.4.5. Strategy Overview

                17.1.4.5.1. Marketing Strategy

        17.1.5. Avita Medical

            17.1.5.1. Overview

            17.1.5.2. Product Portfolio

            17.1.5.3. Profitability by Market Segments

            17.1.5.4. Sales Footprint

            17.1.5.5. Strategy Overview

                17.1.5.5.1. Marketing Strategy

        17.1.6. Vericel Corporation

            17.1.6.1. Overview

            17.1.6.2. Product Portfolio

            17.1.6.3. Profitability by Market Segments

            17.1.6.4. Sales Footprint

            17.1.6.5. Strategy Overview

                17.1.6.5.1. Marketing Strategy

        17.1.7. KeraNetics

            17.1.7.1. Overview

            17.1.7.2. Product Portfolio

            17.1.7.3. Profitability by Market Segments

            17.1.7.4. Sales Footprint

            17.1.7.5. Strategy Overview

                17.1.7.5.1. Marketing Strategy

        17.1.8. Integra LifeSciences Corporation

            17.1.8.1. Overview

            17.1.8.2. Product Portfolio

            17.1.8.3. Profitability by Market Segments

            17.1.8.4. Sales Footprint

            17.1.8.5. Strategy Overview

                17.1.8.5.1. Marketing Strategy

        17.1.9. PolyNovo

            17.1.9.1. Overview

            17.1.9.2. Product Portfolio

            17.1.9.3. Profitability by Market Segments

            17.1.9.4. Sales Footprint

            17.1.9.5. Strategy Overview

                17.1.9.5.1. Marketing Strategy

        17.1.10. Medline Industries

            17.1.10.1. Overview

            17.1.10.2. Product Portfolio

            17.1.10.3. Profitability by Market Segments

            17.1.10.4. Sales Footprint

            17.1.10.5. Strategy Overview

                17.1.10.5.1. Marketing Strategy

        17.1.11. Anika Therapeutics, Inc.

            17.1.11.1. Overview

            17.1.11.2. Product Portfolio

            17.1.11.3. Profitability by Market Segments

            17.1.11.4. Sales Footprint

            17.1.11.5. Strategy Overview

                17.1.11.5.1. Marketing Strategy

        17.1.12. ACell, Inc.

            17.1.12.1. Overview

            17.1.12.2. Product Portfolio

            17.1.12.3. Profitability by Market Segments

            17.1.12.4. Sales Footprint

            17.1.12.5. Strategy Overview

                17.1.12.5.1. Marketing Strategy

        17.1.13. Amryt Pharma

            17.1.13.1. Overview

            17.1.13.2. Product Portfolio

            17.1.13.3. Profitability by Market Segments

            17.1.13.4. Sales Footprint

            17.1.13.5. Strategy Overview

                17.1.13.5.1. Marketing Strategy

        17.1.14. CUTISS AG

            17.1.14.1. Overview

            17.1.14.2. Product Portfolio

            17.1.14.3. Profitability by Market Segments

            17.1.14.4. Sales Footprint

            17.1.14.5. Strategy Overview

                17.1.14.5.1. Marketing Strategy

        17.1.15. Skingenix

            17.1.15.1. Overview

            17.1.15.2. Product Portfolio

            17.1.15.3. Profitability by Market Segments

            17.1.15.4. Sales Footprint

            17.1.15.5. Strategy Overview

                17.1.15.5.1. Marketing Strategy

        17.1.16. RenovaCare

            17.1.16.1. Overview

            17.1.16.2. Product Portfolio

            17.1.16.3. Profitability by Market Segments

            17.1.16.4. Sales Footprint

            17.1.16.5. Strategy Overview

                17.1.16.5.1. Marketing Strategy

18. Assumptions & Acronyms Used

19. Research Methodology

Don't pay for what you don't need

Customize your report by selecting specific countries or regions and save 30%!

List of Tables

Table 1: Global Market Value (US$ Million) Forecast by Region, 2018 to 2033

Table 2: Global Market Value (US$ Million) Forecast by Treatment Type, 2018 to 2033

Table 3: Global Market Value (US$ Million) Forecast by Degree of Burn, 2018 to 2033

Table 4: North America Market Value (US$ Million) Forecast by Country, 2018 to 2033

Table 5: North America Market Value (US$ Million) Forecast by Treatment Type, 2018 to 2033

Table 6: North America Market Value (US$ Million) Forecast by Degree of Burn, 2018 to 2033

Table 7: Latin America Market Value (US$ Million) Forecast by Country, 2018 to 2033

Table 8: Latin America Market Value (US$ Million) Forecast by Treatment Type, 2018 to 2033

Table 9: Latin America Market Value (US$ Million) Forecast by Degree of Burn, 2018 to 2033

Table 10: Europe Market Value (US$ Million) Forecast by Country, 2018 to 2033

Table 11: Europe Market Value (US$ Million) Forecast by Treatment Type, 2018 to 2033

Table 12: Europe Market Value (US$ Million) Forecast by Degree of Burn, 2018 to 2033

Table 13: South Asia Market Value (US$ Million) Forecast by Country, 2018 to 2033

Table 14: South Asia Market Value (US$ Million) Forecast by Treatment Type, 2018 to 2033

Table 15: South Asia Market Value (US$ Million) Forecast by Degree of Burn, 2018 to 2033

Table 16: East Asia Market Value (US$ Million) Forecast by Country, 2018 to 2033

Table 17: East Asia Market Value (US$ Million) Forecast by Treatment Type, 2018 to 2033

Table 18: East Asia Market Value (US$ Million) Forecast by Degree of Burn, 2018 to 2033

Table 19: Oceania Market Value (US$ Million) Forecast by Country, 2018 to 2033

Table 20: Oceania Market Value (US$ Million) Forecast by Treatment Type, 2018 to 2033

Table 21: Oceania Market Value (US$ Million) Forecast by Degree of Burn, 2018 to 2033

Table 22: MEA Market Value (US$ Million) Forecast by Country, 2018 to 2033

Table 23: MEA Market Value (US$ Million) Forecast by Treatment Type, 2018 to 2033

Table 24: MEA Market Value (US$ Million) Forecast by Degree of Burn, 2018 to 2033
Sabyasachi Ghosh
Sabyasachi Ghosh

Principal Consultant

Talk to Analyst

Find your sweet spots for generating winning opportunities in this market.

List of Charts

Figure 1: Global Market Value (US$ Million) by Treatment Type, 2023 to 2033

Figure 2: Global Market Value (US$ Million) by Degree of Burn, 2023 to 2033

Figure 3: Global Market Value (US$ Million) by Region, 2023 to 2033

Figure 4: Global Market Value (US$ Million) Analysis by Region, 2018 to 2033

Figure 5: Global Market Value Share (%) and BPS Analysis by Region, 2023 to 2033

Figure 6: Global Market Y-o-Y Growth (%) Projections by Region, 2023 to 2033

Figure 7: Global Market Value (US$ Million) Analysis by Treatment Type, 2018 to 2033

Figure 8: Global Market Value Share (%) and BPS Analysis by Treatment Type, 2023 to 2033

Figure 9: Global Market Y-o-Y Growth (%) Projections by Treatment Type, 2023 to 2033

Figure 10: Global Market Value (US$ Million) Analysis by Degree of Burn, 2018 to 2033

Figure 11: Global Market Value Share (%) and BPS Analysis by Degree of Burn, 2023 to 2033

Figure 12: Global Market Y-o-Y Growth (%) Projections by Degree of Burn, 2023 to 2033

Figure 13: Global Market Attractiveness by Treatment Type, 2023 to 2033

Figure 14: Global Market Attractiveness by Degree of Burn, 2023 to 2033

Figure 15: Global Market Attractiveness by Region, 2023 to 2033

Figure 16: North America Market Value (US$ Million) by Treatment Type, 2023 to 2033

Figure 17: North America Market Value (US$ Million) by Degree of Burn, 2023 to 2033

Figure 18: North America Market Value (US$ Million) by Country, 2023 to 2033

Figure 19: North America Market Value (US$ Million) Analysis by Country, 2018 to 2033

Figure 20: North America Market Value Share (%) and BPS Analysis by Country, 2023 to 2033

Figure 21: North America Market Y-o-Y Growth (%) Projections by Country, 2023 to 2033

Figure 22: North America Market Value (US$ Million) Analysis by Treatment Type, 2018 to 2033

Figure 23: North America Market Value Share (%) and BPS Analysis by Treatment Type, 2023 to 2033

Figure 24: North America Market Y-o-Y Growth (%) Projections by Treatment Type, 2023 to 2033

Figure 25: North America Market Value (US$ Million) Analysis by Degree of Burn, 2018 to 2033

Figure 26: North America Market Value Share (%) and BPS Analysis by Degree of Burn, 2023 to 2033

Figure 27: North America Market Y-o-Y Growth (%) Projections by Degree of Burn, 2023 to 2033

Figure 28: North America Market Attractiveness by Treatment Type, 2023 to 2033

Figure 29: North America Market Attractiveness by Degree of Burn, 2023 to 2033

Figure 30: North America Market Attractiveness by Country, 2023 to 2033

Figure 31: Latin America Market Value (US$ Million) by Treatment Type, 2023 to 2033

Figure 32: Latin America Market Value (US$ Million) by Degree of Burn, 2023 to 2033

Figure 33: Latin America Market Value (US$ Million) by Country, 2023 to 2033

Figure 34: Latin America Market Value (US$ Million) Analysis by Country, 2018 to 2033

Figure 35: Latin America Market Value Share (%) and BPS Analysis by Country, 2023 to 2033

Figure 36: Latin America Market Y-o-Y Growth (%) Projections by Country, 2023 to 2033

Figure 37: Latin America Market Value (US$ Million) Analysis by Treatment Type, 2018 to 2033

Figure 38: Latin America Market Value Share (%) and BPS Analysis by Treatment Type, 2023 to 2033

Figure 39: Latin America Market Y-o-Y Growth (%) Projections by Treatment Type, 2023 to 2033

Figure 40: Latin America Market Value (US$ Million) Analysis by Degree of Burn, 2018 to 2033

Figure 41: Latin America Market Value Share (%) and BPS Analysis by Degree of Burn, 2023 to 2033

Figure 42: Latin America Market Y-o-Y Growth (%) Projections by Degree of Burn, 2023 to 2033

Figure 43: Latin America Market Attractiveness by Treatment Type, 2023 to 2033

Figure 44: Latin America Market Attractiveness by Degree of Burn, 2023 to 2033

Figure 45: Latin America Market Attractiveness by Country, 2023 to 2033

Figure 46: Europe Market Value (US$ Million) by Treatment Type, 2023 to 2033

Figure 47: Europe Market Value (US$ Million) by Degree of Burn, 2023 to 2033

Figure 48: Europe Market Value (US$ Million) by Country, 2023 to 2033

Figure 49: Europe Market Value (US$ Million) Analysis by Country, 2018 to 2033

Figure 50: Europe Market Value Share (%) and BPS Analysis by Country, 2023 to 2033

Figure 51: Europe Market Y-o-Y Growth (%) Projections by Country, 2023 to 2033

Figure 52: Europe Market Value (US$ Million) Analysis by Treatment Type, 2018 to 2033

Figure 53: Europe Market Value Share (%) and BPS Analysis by Treatment Type, 2023 to 2033

Figure 54: Europe Market Y-o-Y Growth (%) Projections by Treatment Type, 2023 to 2033

Figure 55: Europe Market Value (US$ Million) Analysis by Degree of Burn, 2018 to 2033

Figure 56: Europe Market Value Share (%) and BPS Analysis by Degree of Burn, 2023 to 2033

Figure 57: Europe Market Y-o-Y Growth (%) Projections by Degree of Burn, 2023 to 2033

Figure 58: Europe Market Attractiveness by Treatment Type, 2023 to 2033

Figure 59: Europe Market Attractiveness by Degree of Burn, 2023 to 2033

Figure 60: Europe Market Attractiveness by Country, 2023 to 2033

Figure 61: South Asia Market Value (US$ Million) by Treatment Type, 2023 to 2033

Figure 62: South Asia Market Value (US$ Million) by Degree of Burn, 2023 to 2033

Figure 63: South Asia Market Value (US$ Million) by Country, 2023 to 2033

Figure 64: South Asia Market Value (US$ Million) Analysis by Country, 2018 to 2033

Figure 65: South Asia Market Value Share (%) and BPS Analysis by Country, 2023 to 2033

Figure 66: South Asia Market Y-o-Y Growth (%) Projections by Country, 2023 to 2033

Figure 67: South Asia Market Value (US$ Million) Analysis by Treatment Type, 2018 to 2033

Figure 68: South Asia Market Value Share (%) and BPS Analysis by Treatment Type, 2023 to 2033

Figure 69: South Asia Market Y-o-Y Growth (%) Projections by Treatment Type, 2023 to 2033

Figure 70: South Asia Market Value (US$ Million) Analysis by Degree of Burn, 2018 to 2033

Figure 71: South Asia Market Value Share (%) and BPS Analysis by Degree of Burn, 2023 to 2033

Figure 72: South Asia Market Y-o-Y Growth (%) Projections by Degree of Burn, 2023 to 2033

Figure 73: South Asia Market Attractiveness by Treatment Type, 2023 to 2033

Figure 74: South Asia Market Attractiveness by Degree of Burn, 2023 to 2033

Figure 75: South Asia Market Attractiveness by Country, 2023 to 2033

Figure 76: East Asia Market Value (US$ Million) by Treatment Type, 2023 to 2033

Figure 77: East Asia Market Value (US$ Million) by Degree of Burn, 2023 to 2033

Figure 78: East Asia Market Value (US$ Million) by Country, 2023 to 2033

Figure 79: East Asia Market Value (US$ Million) Analysis by Country, 2018 to 2033

Figure 80: East Asia Market Value Share (%) and BPS Analysis by Country, 2023 to 2033

Figure 81: East Asia Market Y-o-Y Growth (%) Projections by Country, 2023 to 2033

Figure 82: East Asia Market Value (US$ Million) Analysis by Treatment Type, 2018 to 2033

Figure 83: East Asia Market Value Share (%) and BPS Analysis by Treatment Type, 2023 to 2033

Figure 84: East Asia Market Y-o-Y Growth (%) Projections by Treatment Type, 2023 to 2033

Figure 85: East Asia Market Value (US$ Million) Analysis by Degree of Burn, 2018 to 2033

Figure 86: East Asia Market Value Share (%) and BPS Analysis by Degree of Burn, 2023 to 2033

Figure 87: East Asia Market Y-o-Y Growth (%) Projections by Degree of Burn, 2023 to 2033

Figure 88: East Asia Market Attractiveness by Treatment Type, 2023 to 2033

Figure 89: East Asia Market Attractiveness by Degree of Burn, 2023 to 2033

Figure 90: East Asia Market Attractiveness by Country, 2023 to 2033

Figure 91: Oceania Market Value (US$ Million) by Treatment Type, 2023 to 2033

Figure 92: Oceania Market Value (US$ Million) by Degree of Burn, 2023 to 2033

Figure 93: Oceania Market Value (US$ Million) by Country, 2023 to 2033

Figure 94: Oceania Market Value (US$ Million) Analysis by Country, 2018 to 2033

Figure 95: Oceania Market Value Share (%) and BPS Analysis by Country, 2023 to 2033

Figure 96: Oceania Market Y-o-Y Growth (%) Projections by Country, 2023 to 2033

Figure 97: Oceania Market Value (US$ Million) Analysis by Treatment Type, 2018 to 2033

Figure 98: Oceania Market Value Share (%) and BPS Analysis by Treatment Type, 2023 to 2033

Figure 99: Oceania Market Y-o-Y Growth (%) Projections by Treatment Type, 2023 to 2033

Figure 100: Oceania Market Value (US$ Million) Analysis by Degree of Burn, 2018 to 2033

Figure 101: Oceania Market Value Share (%) and BPS Analysis by Degree of Burn, 2023 to 2033

Figure 102: Oceania Market Y-o-Y Growth (%) Projections by Degree of Burn, 2023 to 2033

Figure 103: Oceania Market Attractiveness by Treatment Type, 2023 to 2033

Figure 104: Oceania Market Attractiveness by Degree of Burn, 2023 to 2033

Figure 105: Oceania Market Attractiveness by Country, 2023 to 2033

Figure 106: MEA Market Value (US$ Million) by Treatment Type, 2023 to 2033

Figure 107: MEA Market Value (US$ Million) by Degree of Burn, 2023 to 2033

Figure 108: MEA Market Value (US$ Million) by Country, 2023 to 2033

Figure 109: MEA Market Value (US$ Million) Analysis by Country, 2018 to 2033

Figure 110: MEA Market Value Share (%) and BPS Analysis by Country, 2023 to 2033

Figure 111: MEA Market Y-o-Y Growth (%) Projections by Country, 2023 to 2033

Figure 112: MEA Market Value (US$ Million) Analysis by Treatment Type, 2018 to 2033

Figure 113: MEA Market Value Share (%) and BPS Analysis by Treatment Type, 2023 to 2033

Figure 114: MEA Market Y-o-Y Growth (%) Projections by Treatment Type, 2023 to 2033

Figure 115: MEA Market Value (US$ Million) Analysis by Degree of Burn, 2018 to 2033

Figure 116: MEA Market Value Share (%) and BPS Analysis by Degree of Burn, 2023 to 2033

Figure 117: MEA Market Y-o-Y Growth (%) Projections by Degree of Burn, 2023 to 2033

Figure 118: MEA Market Attractiveness by Treatment Type, 2023 to 2033

Figure 119: MEA Market Attractiveness by Degree of Burn, 2023 to 2033

Figure 120: MEA Market Attractiveness by Country, 2023 to 2033

Recommendations

Healthcare

Advance Wound Care Market

Published : December 2023

Healthcare

Wound Skin Care Market

Published : April 2023

Consumer Product

Burn Care Market

Published : February 2023

Testing Equipment

Wound Measurement Devices Market

Published : March 2022

Explore Healthcare Insights

View Reports