Acne Treatment Solutions Market Size and Share Forecast Outlook 2025 to 2035

The Acne Treatment Solutions Market is expected to record a valuation of USD 12,803.4 million in 2025 and USD 29,501.5 million in 2035, with an increase of USD 16,698.1 million, which equals a growth of 130% over the decade. The overall expansion represents a CAGR of 8.7% and more than a 2X increase in market size.
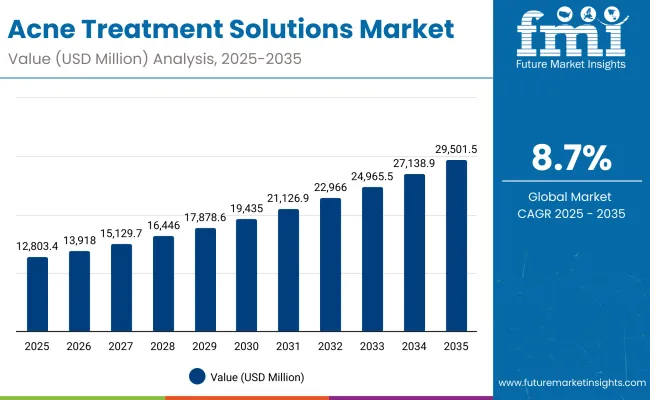
Quick Stats for Acne Treatment Solutions Market

  • Acne Treatment Solutions Market Value (2025): USD 12,803.4 million
  • Acne Treatment Solutions Market Forecast Value (2035): USD 29,501.5 million
  • Acne Treatment Solutions Market Forecast CAGR: 8.7%
  • Leading Segment in Acne Treatment Solutions Market in 2025: OTC topical treatments (49.1%)
  • Key Growth Regions in the Acne Treatment Solutions Market: Asia-Pacific, North America, Europe
  • Top Key Players in Acne Treatment Solutions Market: La Roche-Posay, Neutrogena, CeraVe, Paula’s Choice, The Ordinary, Differin, Proactiv, Murad, Bioderma, COSRX

Acne Treatment Solution Market

Acne Treatment Solutions Market Key Takeaways

Metric Value
Acne Treatment Solutions Market Estimated Value in (2025E) USD 12,803.4 million
Acne Treatment Solutions Market Forecast Value in (2035F) USD 29,501.5 million
Forecast CAGR (2025 to 2035) 8.7%

During the first five-year period from 2025 to 2030, the market increases from USD 12,803.4 million to USD 19,435.0 million, adding USD 6,631.6 million, which accounts for 40% of the total decade growth. This phase records steady adoption of OTC topicals such as cleansers and gels, driven by consumer preference for accessible and preventive skincare solutions. Benzoyl peroxide and salicylic acid–based products dominate this period due to proven clinical efficacy and broad availability.

The second half from 2030 to 2035 contributes USD 10,066.5 million, equal to 60% of total growth, as the market jumps from USD 19,435.0 million to USD 29,501.5 million. This acceleration is powered by prescription topicals, systemic therapies, and device-based treatments such as LED/blue light gaining wider acceptance. Increased dermatologist-led recommendations, coupled with digital health and tele-dermatology platforms, support this phase. Advanced formulations combining retinoids, niacinamide, and anti-inflammatory blends further expand consumer reach, strengthening growth momentum in premium dermocosmetics.

From 2020 to 2024, the Acne Treatment Solutions Market grew steadily, driven by the expansion of dermocosmetic brands and rising consumer preference for preventative skincare routines. During this period, OTC topical solutions captured the bulk of revenues, with benzoyl peroxide and salicylic acid maintaining dominance as frontline treatments. Prescription products contributed significant growth, supported by dermatologist adoption, while systemic and device-based therapies had limited but rising presence. Service-based dermatology models also began gaining traction through telehealth and online pharmacy platforms.

Demand for Acne Treatment Solutions will expand further to USD 12,803.4 million in 2025, with the revenue mix gradually shifting as e-commerce and digital dermatology platforms enhance accessibility. Traditional skincare leaders face growing competition from digital-first entrants that emphasize personalization, subscription models, and AI-driven skin diagnostics. The competitive advantage is moving from single-ingredient topicals to hybrid portfolios combining actives, data integration, and consumer-focused digital ecosystems.

Why the Acne Treatment Solutions Market is growing?

The surge in acne cases among teenagers and young adults is a key growth driver, with this group representing over 50% of end-user demand in 2025. Accessibility of OTC topicals such as gels, cleansers, and spot treatments, combined with social media-driven beauty consciousness, is expanding product adoption. The popularity of fast-acting benzoyl peroxide and salicylic acid products is reinforced by influencers, online tutorials, and brand campaigns, pushing early intervention trends in acne care.

Rapid expansion of tele-dermatology services and e-pharmacy platforms is significantly boosting prescription topical adoption, particularly retinoids and antibiotic formulations. Patients increasingly prefer digital consultations for skin issues, allowing prescriptions to be delivered seamlessly through online pharmacies. This shift improves accessibility in both developed and emerging markets while reducing reliance on in-person visits. Combined with growing dermatologist collaboration with skincare brands, these channels accelerate prescription-based acne care penetration and are reshaping traditional distribution models.

Segmental Analysis

The Acne Treatment Solutions Market is segmented by treatment type, active ingredient, form, channel, end user, and region. Treatment types include OTC topicals (cleansers, gels), prescription topicals (retinoids, antibiotics), systemic therapies (oral antibiotics, isotretinoin), and device-based solutions (LED/blue light). Active ingredients comprise benzoyl peroxide, salicylic acid, topical retinoids, azelaic acid, and niacinamide blends, each addressing specific acne severity levels. By form, the market covers gels/gel-creams, serums, cleansers, spot treatments, and patches. Distribution channels include e-commerce, pharmacies/drugstores, dermatology clinics, and mass retail. End-user categories span teens/young adults, adult acne, men’s grooming, and sensitive skin. Regionally, the scope includes North America, Europe, Asia-Pacific, Latin America, and the Middle East & Africa, with China and India driving the fastest growth.
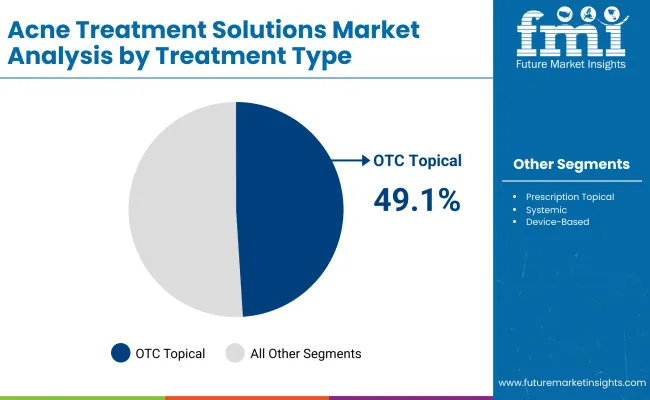
Insights into the Treatment Type Segment with OTC Topicals Leading in Market Share

Acne Treatment Solution Market By Treatment Type

Treatment Type Value Share% 2025
OTC topical 49.1%
Others 50.9%

The OTC topical segment is projected to contribute 49.1% of the Acne Treatment Solutions Market revenue in 2025, maintaining its lead as the dominant treatment category. Growth is driven by consumer preference for easily accessible, non-prescription products such as cleansers, gels, and spot treatments. These products are widely available across retail and online platforms, making them the first line of defense for mild to moderate acne. Their affordability, convenience, and strong brand visibility through dermocosmetic players further reinforce demand. The segment is expected to remain the backbone of acne treatment solutions, supported by continuous innovations in fast-acting actives and combination formulations.
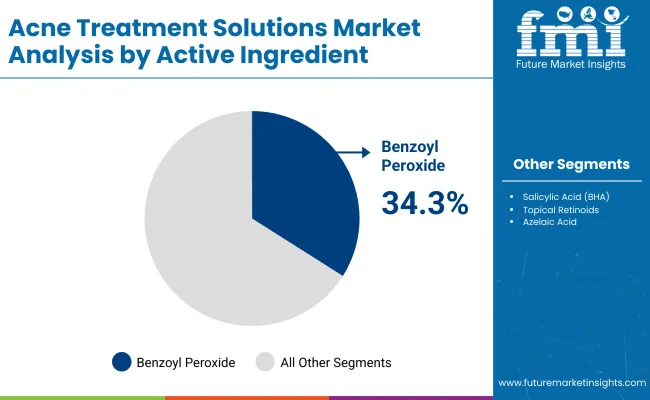
Insights into the Active Ingredient Segment with Benzoyl Peroxide Leading in Market Share

Acne Treatment Solution Market By Active Ingredient

Active Ingredient Value Share% 2025
Benzoyl peroxide 34.3%
Others 65.7%

The benzoyl peroxide segment is forecasted to hold 34.3% of the market share in 2025, driven by its role as one of the most effective and widely used active ingredients in acne treatment solutions. Known for its antibacterial properties and ability to reduce excess oil, benzoyl peroxide remains a first-line treatment for mild to moderate acne. Its affordability, over-the-counter availability, and inclusion across cleansers, gels, and spot treatments continue to reinforce adoption. The segment’s growth is further supported by clinical validation, brand-backed education campaigns, and integration into combination therapies with retinoids and salicylic acid, ensuring it maintains dominance in acne treatment formulations.
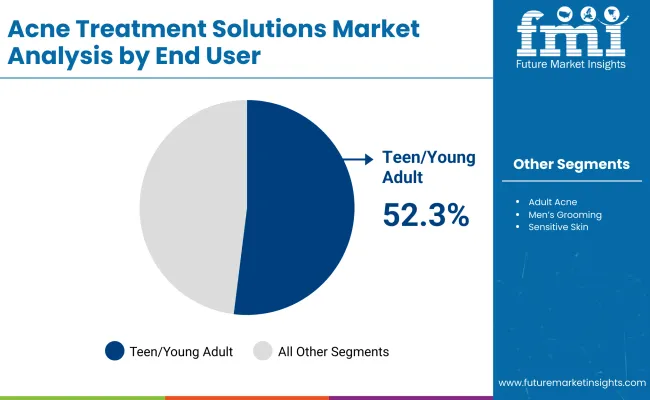
Insights into the End User Segment with Teen/Young Adult Leading in Market Share

Acne Treatment Solution Market By End User

End User Value Share% 2025
Teen/young adult 52.3%
Others 47.7%

The teen and young adult segment is projected to account for 52.3% of the Acne Treatment Solutions Market revenue in 2025, establishing it as the leading end-user group. This dominance reflects the high prevalence of acne during adolescence, where hormonal fluctuations significantly drive skin concerns. Teens and young adults are also more inclined toward preventive skincare routines, fueled by social media influence and brand marketing campaigns. The growing availability of OTC topicals, spot treatments, and patches tailored to younger skin types, combined with rising awareness around early intervention, ensures this segment remains at the forefront of market demand throughout the forecast period.

What are the Drivers, Restraints, and Key Trends of the Acne Treatment Solutions Market?

Rising prevalence of adult acne

While acne has traditionally been associated with teenagers, rising adult acne casesparticularly among womenare fueling market expansion. Stress, hormonal imbalances, pollution exposure, and lifestyle-related dietary factors are driving demand for long-term acne management solutions. This has led to higher adoption of prescription retinoids, systemic therapies, and dermocosmetic lines marketed specifically for adult skin. Brands are increasingly targeting adults with anti-acne formulations that also address concerns like aging, pigmentation, and dryness, ensuring continued growth beyond the adolescent population.

E-commerce and tele-dermatology integration

The surge in e-commerce platforms and digital health solutions is transforming acne treatment accessibility. Online pharmacies, brand-owned D2C websites, and tele-dermatology apps allow consumers to access both OTC and prescription products seamlessly. Personalized regimens, AI-driven skin analysis, and subscription-based models are driving consumer engagement and repeat purchases. This convenience particularly benefits teens and young adults, who prefer digital channels for skincare. As digital ecosystems expand globally, they are accelerating product penetration and supporting both established players and new entrants.

Antibiotic resistance in acne care

The increasing reliance on topical and oral antibiotics for acne treatment is raising concerns about antibiotic resistance, limiting long-term use. Dermatologists are becoming cautious with prescriptions, especially for systemic therapies like oral antibiotics. Regulatory bodies are also imposing stricter guidelines on antibiotic usage in dermatology. This restraint creates challenges for sustained prescription sales, pushing brands to diversify portfolios with safer alternatives such as retinoids, azelaic acid, and device-based therapies. Addressing antibiotic resistance remains a critical barrier for market growth.

Growing demand for multifunctional formulations

Consumers are increasingly seeking acne treatments that offer multifunctional benefits beyond clearing breakouts. Formulations combining acne-fighting actives like benzoyl peroxide or retinoids with niacinamide, ceramides, or hyaluronic acid are gaining traction, as they target both acne and secondary concerns such as redness, dryness, and post-inflammatory marks. The clean-label and sensitive-skin movement further fuels demand for gentler yet effective blends. This trend is reshaping product development, with leading brands positioning hybrid solutions that balance efficacy with skincare wellness, appealing to a broader consumer base.
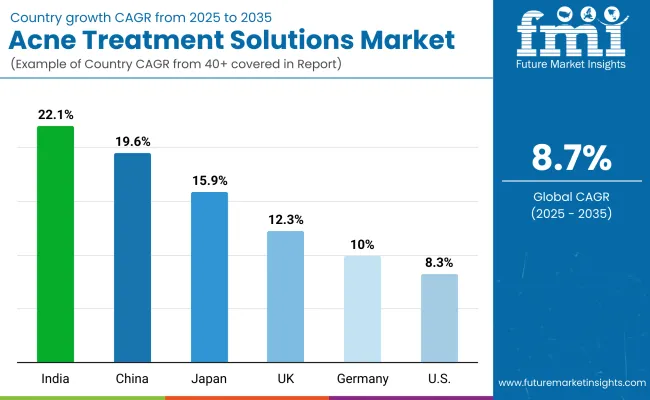
Analysis of Acne Treatment Solutions Market By Key Countries

Country Wise Analysis Acne Treatment Solution Market

Country Estimated CAGR (2025 to 2035)
China 19.6%
USA 8.3%
India 22.1%
UK 12.3%
Germany 10.0%
Japan 15.9%

The global Acne Treatment Solutions Market shows clear regional disparities in growth, shaped by demographics, healthcare access, and consumer skincare preferences. Asia-Pacific is the fastest-growing region, led by India at 22.1% CAGR and China at 19.6%, fueled by a large youth population, rising disposable incomes, and the popularity of K-beauty and J-beauty-inspired acne care. Digital platforms and affordable dermocosmetic launches further accelerate adoption.

Europe maintains strong performance, with the UK at 12.3% and Germany at 10.0%, supported by premium dermocosmetic brands, dermatologist-backed OTC lines, and rising demand for clean-label solutions. Japan, at 15.9% CAGR, benefits from innovation in mild formulations and multifunctional serums designed for sensitive skin, alongside strong integration of device-based acne therapies. North America, led by the USA at 8.3% CAGR, shows steady growth supported by established dermatology networks, high consumer spend on premium acne regimens, and strong brand loyalty, though the market is more mature compared to Asia-Pacific.
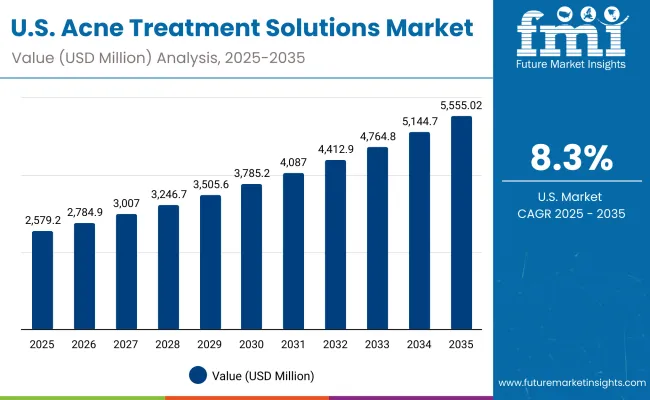
Sales Outlook for Acne Treatment Solutions in the United States

United States Acne Treatment Solution Market

Year USA Acne Treatment Solutions Market (USD Million)
2025 2,579.26
2026 2,784.93
2027 3,007.00
2028 3,246.77
2029 3,505.67
2030 3,785.21
2031 4,087.04
2032 4,412.94
2033 4,764.83
2034 5,144.77
2035 5,555.02

The Acne Treatment Solutions Market in the United States is projected to grow at a CAGR of 8.3%, supported by a strong base of dermatology practices, high consumer awareness, and consistent adoption of dermocosmetic brands. OTC topicals remain the largest contributor, particularly cleansers and gels, while prescription retinoids and antibiotics continue to drive dermatologist-led treatments. Tele-dermatology expansion and e-pharmacy integration are enhancing prescription adherence. Meanwhile, growing acceptance of device-based therapies such as blue light and LED treatments is expanding options for consumers seeking non-invasive solutions.

  • OTC topicals like cleansers and gels dominate as first-line treatments.
  • Prescription retinoids see steady uptake via dermatology networks and telehealth.
  • LED/blue light devices are gaining traction as alternative non-invasive therapies.

Growth and Expansion Outlook for Acne Treatment Solutions Market in the United Kingdom

The Acne Treatment Solutions Market in the United Kingdom is expected to grow at a CAGR of 12.3%, supported by rising demand for dermocosmetic brands and dermatologist-driven prescriptions. OTC topicals, particularly cleansers and gels, remain highly popular, while prescription retinoids and combination therapies are gaining traction through the NHS and private dermatology clinics. Clean-label and sensitive-skin-focused formulations are in strong demand, aligning with consumer preferences for gentler acne care. E-commerce platforms and pharmacy chains are expanding access, while premium brands drive growth through marketing campaigns.

  • OTC cleansers and gels continue to dominate first-line treatments.
  • Prescription retinoids are expanding through NHS and private clinics.
  • Clean-label and sensitive-skin formulations gain popularity among consumers.

Growth and Expansion Outlook for Acne Treatment Solutions Market in India

India is witnessing rapid growth in the Acne Treatment Solutions Market, projected to expand at a CAGR of 22.1% through 2035. Rising disposable incomes, increased skincare awareness, and the influence of social media are accelerating adoption across both metro and tier-2 cities. OTC topicals such as benzoyl peroxide and salicylic acid products are widely favored, while prescription retinoids are gaining popularity via dermatologists and telehealth platforms. Growing investments from global brands in affordable, India-specific formulations further fuel market expansion.

  • OTC benzoyl peroxide and salicylic acid products dominate early-stage treatment.
  • Prescription retinoids expand through dermatology clinics and telehealth platforms.
  • Tier-2 cities see rising adoption with affordable, localized product launches.

Sales Outlook for Acne Treatment Solutions in China

The Acne Treatment Solutions Market in China is expected to grow at a CAGR of 19.6%, the highest among leading economies. Growth is fueled by a large youth population, increasing skincare wareness, and rising affordability of dermocosmetic brands. OTC topicals dominate demand, particularly benzoyl peroxide and salicylic acid formulations, while tele-dermatology and e-commerce platforms are driving wider access to prescription treatments. Domestic players are offering competitively priced solutions, while global brands expand premium lines targeted at urban consumers, creating a balanced mix of mass and premium acne solutions.
  • OTC benzoyl peroxide and salicylic acid products drive mass-market adoption.
  • Tele-dermatology and e-commerce platforms boost prescription treatment uptake.
  • Domestic affordability and premium brand expansion fuel urban consumer demand.

In-depth Analysis of Acne Treatment Solutions in Germany

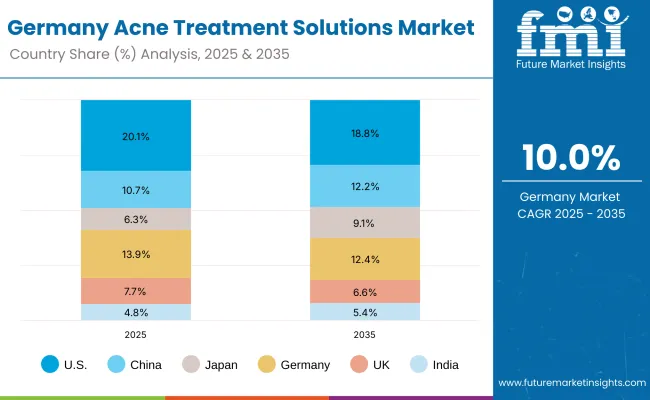
Germany Acne Treatment Solution Market

Country 2025 Share (%)
USA 20.1%
China 10.7%
Japan 6.3%
Germany 13.9%
UK 7.7%
India 4.8%
Country 2035 Share (%)
USA 18.8%
China 12.2%
Japan 9.1%
Germany 12.4%
UK 6.6%
India 5.4%

The Acne Treatment Solutions Market in Germany is projected to grow at a CAGR of 10.0%, supported by the country’s advanced dermatology infrastructure and strong consumer preference for dermocosmetic brands. Pharmacy-driven distribution dominates, with La Roche-Posay, Bioderma, and CeraVe leading sales of OTC topicals. Prescription treatments, especially retinoids and antibiotic combinations, are increasingly prescribed in both private and public clinics. Clean-label and sensitive-skin-focused solutions are gaining ground, reflecting Germany’s regulatory push for safer cosmetic formulations. Growing demand for premium serums and clinic-grade device-based acne treatments further supports long-term market expansion.

  • Pharmacies remain the primary distribution channel for dermocosmetic OTC topicals.
  • Retinoids and combination therapies are steadily prescribed by dermatologists.
  • Clean-label, sensitive-skin formulations and premium serums drive consumer adoption.

Growth Outlook for Acne Treatment Solutions Market in USA

USA by Treatment Type Value Share% 2025
OTC topical 51.8%
Others 48.2%

The Acne Treatment Solutions Market in the United States is projected at USD 2,579 million in 2025, reaching USD 5,555 million by 2035, at a CAGR of 8.3%. OTC topicals such as benzoyl peroxide cleansers and salicylic acid formulations dominate due to strong retail penetration across pharmacies and mass-market outlets. Prescription retinoids and antibiotic topicals remain critical in dermatology practices, especially for moderate to severe acne cases. The rise of clean-label and dermatologist-tested claims is shaping consumer demand, while tele-dermatology and DTC brands are increasing accessibility. Device-based acne treatments like LED therapy are emerging but remain a niche.

  • Market in the USA is projected at USD 2,579 Mn in 2025, expanding to USD 5,555 Mn by 2035.
  • OTC topicals lead with 51.8% share, supported by retail and pharmacy distribution.
  • Digital health platforms and clean-label trends are reshaping consumer preferences.

Opportunity Analysis of China Acne Treatment Solutions Market

China by End User Value Share% 2025
Teen/young adult 54.2%
Others 45.8%

The Acne Treatment Solutions Market in China is valued at USD 1,376 million in 2025, expanding at a CAGR of 19.6% through 2035, one of the fastest globally. Teen and young adult consumers represent the largest segment at 54.2%, driven by rising urbanization, pollution-linked acne prevalence, and strong K-beauty and C-beauty influence. Affordable OTC topicals such as benzoyl peroxide and niacinamide blends dominate, while prescription retinoids are gaining traction in dermatology clinics. E-commerce platforms and social commerce channels such as Tmall and Douyin amplify accessibility, especially in lower-tier cities. Emerging opportunities lie in device-based LED treatments and clean-label serums, with strong uptake among middle-class youth.
  • Market size for China in 2025: USD 1,376 Mn
  • CAGR (2025-2035): 19.6%
  • Teen/young adult segment leads at 54.2% share

Competitive Landscape of Acne Treatment Solutions Market

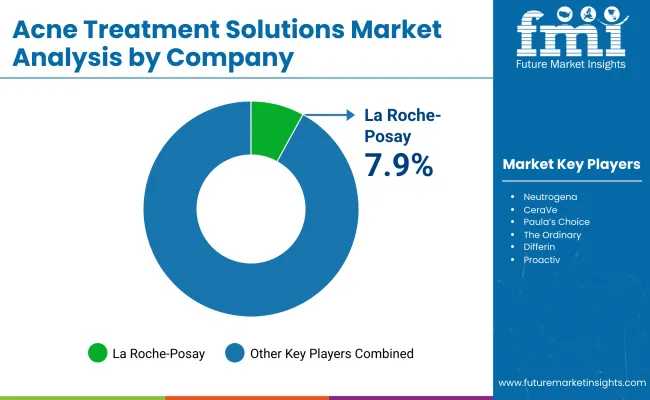
Treatment Solution Market By Company

Company Global Value Share 2025
La Roche- Posay 7.9%
Others 92.1%

The Acne Treatment Solutions Market is moderately fragmented, led by multinational dermatology and skincare brands alongside niche innovators in OTC formulations and device-based therapies. La Roche-Posay, holding 7.9% share, maintains leadership through prescription-grade efficacy in dermocosmetic OTC topicals, bolstered by strong dermatologist endorsements and pharmacy distribution networks. Other key global players such as Neutrogena, CeraVe, Paula’s Choice, and The Ordinary leverage diversified acne portfolios spanning benzoyl peroxide cleansers, salicylic acid serums, and retinoid-based solutions.

Mid-tier specialists including Differin, Proactiv, and Murad focus on targeted acne treatment regimens, subscription-based skincare routines, and premium clean-label claims. Rising challengers like COSRX and Bioderma emphasize K-beauty and gentle formulations, appealing to sensitive skin consumers across Asia and Europe. Competitive differentiation is shifting away from single-ingredient OTC products toward holistic solutions integrating multifunctional actives, microbiome-supporting blends, and device-enhanced regimens. The growing traction of LED/blue light therapies, AI-powered skin diagnostics, and direct-to-consumer platforms is reshaping competitive positioning.

Key Developments in Acne Treatment Solutions Market

  • On February 12, 2025, La Roche-Posay expanded its acne treatment portfolio by launching a next-generation benzoyl peroxide gel with micro-dosing technology in Europe. The innovation improves skin tolerance while maintaining efficacy, addressing consumer demand for gentler solutions suitable for sensitive and teen skin.
  • On July 7, 2025, Neutrogena partnered with FitSkin AI to roll out an AI-powered acne diagnostic and personalized regimen tool via its e-commerce platforms in North America. The initiative integrates digital skin mapping with product recommendations, bridging OTC topicals with customized treatment pathways.

Scope of the Report

Item Value
Quantitative Units USD 12,803.4 Million
Treatment Type OTC topical (cleansers, gels), Prescription topical (retinoids, antibiotics), Systemic (oral antibiotics, isotretinoin), Device-based (LED/blue light)
Active Ingredient Benzoyl peroxide, Salicylic acid (BHA), Topical retinoids, Azelaic acid, Niacinamide blends
Form Gel/gel-cream, Serum, Cleanser, Spot treatment, Patch
Channel E-commerce, Pharmacies/drugstores, Dermatology clinics, Mass retail
End User Teen/young adult, Adult acne, Men’s grooming, Sensitive skin
Regions Covered North America, Europe, Asia-Pacific, Latin America, Middle East & Africa
Country Covered United States, Canada, Germany, France, United Kingdom, China, Japan, India, Brazil, South Africa
Key Companies Profiled La Roche- Posay, Neutrogena, CeraVe, Paula’s Choice, The Ordinary, Differin, Proactiv, Murad, Bioderma, COSRX,
Additional Attributes Dollar sales by treatment type and active ingredient, adoption trends in OTC topicals and prescription retinoids, rising demand for LED/blue light device-based acne therapies, sector-specific growth in dermatology clinics, pharmacies, and e-commerce, software and services integration through AI-powered skin diagnostics and personalized regimens, regional trends influenced by consumer preference for natural/clean-label products, and innovations in formulations such as micro-dosed retinoids, niacinamide blends, and advanced benzoyl peroxide delivery systems.

Key Segments

By Treatment Type:

  • OTC topical (cleansers, gels)
  • Prescription topical (retinoids, antibiotics)
  • Systemic (oral antibiotics, isotretinoin)
  • Device-based (LED/blue light)

By Active Ingredient:

  • Benzoyl peroxide
  • Salicylic acid (BHA)
  • Topical retinoids
  • Azelaic acid
  • Niacinamide blends

By Form:

  • Gel/gel-cream
  • Serum
  • Cleanser
  • Spot treatment
  • Patch

By Channel:

  • E-commerce
  • Pharmacies/drugstores
  • Dermatology clinics
  • Mass retail

By End User:

  • Teen/young adult
  • Adult acne
  • Men’s grooming
  • Sensitive skin

By Region:

  • North America
  • Latin America
  • Europe
  • East Asia
  • South Asia & Pacific
  • Middle East and Africa

Table of Content

  1. Executive Summary
    • Global Market Outlook
    • Demand-side Trends
    • Supply-side Trends
    • Technology Roadmap Analysis
    • Analysis and Recommendations
  2. Market Overview
    • Market Coverage / Taxonomy
    • Market Definition / Scope / Limitations
  3. Market Background
    • Market Dynamics
      • Drivers
      • Restraints
      • Opportunity
      • Trends
    • Scenario Forecast
      • Demand in Optimistic Scenario
      • Demand in Likely Scenario
      • Demand in Conservative Scenario
    • Opportunity Map Analysis
    • Product Life Cycle Analysis
    • Supply Chain Analysis
      • Supply Side Participants and their Roles
        • Producers
        • Mid-Level Participants (Traders/ Agents/ Brokers)
        • Wholesalers and Distributors
      • Value Added and Value Created at Node in the Supply Chain
      • List of Raw Material Suppliers
      • List of Existing and Potential Buyer’s
    • Investment Feasibility Matrix
    • Value Chain Analysis
      • Profit Margin Analysis
      • Wholesalers and Distributors
      • Retailers
    • PESTLE and Porter’s Analysis
    • Regulatory Landscape
      • By Key Regions
      • By Key Countries
    • Regional Parent Market Outlook
    • Production and Consumption Statistics
    • Import and Export Statistics
  4. Global Market Analysis 2020 to 2024 and Forecast, 2025 to 2035
    • Historical Market Size Value (USD Million) & Volume (Units) Analysis, 2020 to 2024
    • Current and Future Market Size Value (USD Million) & Volume (Units) Projections, 2025 to 2035
      • Y-o-Y Growth Trend Analysis
      • Absolute $ Opportunity Analysis
  5. Global Market Analysis 2020 to 2024 and Forecast 2025 to 2035, By Treatment Type
    • Introduction / Key Findings
    • Historical Market Size Value (USD Million) & Volume (Units) Analysis By Treatment Type, 2020 to 2024
    • Current and Future Market Size Value (USD Million) & Volume (Units) Analysis and Forecast By Treatment Type, 2025 to 2035
      • OTC topical (cleansers, gels)
      • Prescription topical (retinoids, antibiotics)
      • Systemic (oral antibiotics, isotretinoin)
      • Device-based (LED/blue light)
    • Y-o-Y Growth Trend Analysis By Treatment Type, 2020 to 2024
    • Absolute $ Opportunity Analysis By Treatment Type, 2025 to 2035
  6. Global Market Analysis 2020 to 2024 and Forecast 2025 to 2035, By Active Ingredient
    • Introduction / Key Findings
    • Historical Market Size Value (USD Million) & Volume (Units) Analysis By Active Ingredient, 2020 to 2024
    • Current and Future Market Size Value (USD Million) & Volume (Units) Analysis and Forecast By Active Ingredient, 2025 to 2035
      • Benzoyl peroxide
      • Salicylic acid (BHA)
      • Topical retinoids
      • Azelaic acid
      • Niacinamide blends
    • Y-o-Y Growth Trend Analysis By Active Ingredient, 2020 to 2024
    • Absolute $ Opportunity Analysis By Active Ingredient, 2025 to 2035
  7. Global Market Analysis 2020 to 2024 and Forecast 2025 to 2035, By Form
    • Introduction / Key Findings
    • Historical Market Size Value (USD Million) & Volume (Units) Analysis By Form, 2020 to 2024
    • Current and Future Market Size Value (USD Million) & Volume (Units) Analysis and Forecast By Form, 2025 to 2035
      • Gel/gel-cream
      • Serum
      • Cleanser
      • Spot treatment
      • Patch
    • Y-o-Y Growth Trend Analysis By Form, 2020 to 2024
    • Absolute $ Opportunity Analysis By Form, 2025 to 2035
  8. Global Market Analysis 2020 to 2024 and Forecast 2025 to 2035, By Channel
    • Introduction / Key Findings
    • Historical Market Size Value (USD Million) & Volume (Units) Analysis By Channel, 2020 to 2024
    • Current and Future Market Size Value (USD Million) & Volume (Units) Analysis and Forecast By Channel, 2025 to 2035
      • E-commerce
      • Pharmacies/drugstores
      • Dermatology clinics
      • Mass retail
    • Y-o-Y Growth Trend Analysis By Channel, 2020 to 2024
    • Absolute $ Opportunity Analysis By Channel, 2025 to 2035
  9. Global Market Analysis 2020 to 2024 and Forecast 2025 to 2035, By End User
    • Introduction / Key Findings
    • Historical Market Size Value (USD Million) & Volume (Units) Analysis By End User, 2020 to 2024
    • Current and Future Market Size Value (USD Million) & Volume (Units) Analysis and Forecast By End User, 2025 to 2035
      • Teen/young adult
      • Adult acne
      • Men’s grooming
      • Sensitive skin
    • Y-o-Y Growth Trend Analysis By End User, 2020 to 2024
    • Absolute $ Opportunity Analysis By End User, 2025 to 2035
  10. Global Market Analysis 2020 to 2024 and Forecast 2025 to 2035, By Region
    • Introduction
    • Historical Market Size Value (USD Million) & Volume (Units) Analysis By Region, 2020 to 2024
    • Current Market Size Value (USD Million) & Volume (Units) Analysis and Forecast By Region, 2025 to 2035
      • North America
      • Latin America
      • Europe
      • East Asia
      • South Asia & Pacific
      • Middle East and Africa
    • Market Attractiveness Analysis By Region
  11. North America Market Analysis 2020 to 2024 and Forecast 2025 to 2035, By Country
    • Historical Market Size Value (USD Million) & Volume (Units) Trend Analysis By Market Taxonomy, 2020 to 2024
    • Market Size Value (USD Million) & Volume (Units) Forecast By Market Taxonomy, 2025 to 2035
      • By Country
        • U.S.
        • Canada
      • By Treatment Type
      • By Active Ingredient
      • By Form
      • By Channel
      • By End User
    • Market Attractiveness Analysis
      • By Country
      • By Treatment Type
      • By Active Ingredient
      • By Form
      • By Channel
      • By End User
    • Key Takeaways
  12. Latin America Market Analysis 2020 to 2024 and Forecast 2025 to 2035, By Country
    • Historical Market Size Value (USD Million) & Volume (Units) Trend Analysis By Market Taxonomy, 2020 to 2024
    • Market Size Value (USD Million) & Volume (Units) Forecast By Market Taxonomy, 2025 to 2035
      • By Country
        • Brazil
        • Mexico
        • Colombia
        • Rest of Latin America
      • By Treatment Type
      • By Active Ingredient
      • By Form
      • By Channel
      • By End User
    • Market Attractiveness Analysis
      • By Country
      • By Treatment Type
      • By Active Ingredient
      • By Form
      • By Channel
      • By End User
    • Key Takeaways
  13. Europe Market Analysis 2020 to 2024 and Forecast 2025 to 2035, By Country
    • Historical Market Size Value (USD Million) & Volume (Units) Trend Analysis By Market Taxonomy, 2020 to 2024
    • Market Size Value (USD Million) & Volume (Units) Forecast By Market Taxonomy, 2025 to 2035
      • By Country
        • Germany
        • U.K.
        • France
        • Italy
        • Spain
        • Belgium
        • Netherlands
        • Nordic
        • Switzerland
        • Russia
        • Poland
        • Rest of Europe
      • By Treatment Type
      • By Active Ingredient
      • By Form
      • By Channel
      • By End User
    • Market Attractiveness Analysis
      • By Country
      • By Treatment Type
      • By Active Ingredient
      • By Form
      • By Channel
      • By End User
    • Key Takeaways
  14. East Asia Market Analysis 2020 to 2024 and Forecast 2025 to 2035, By Country
    • Historical Market Size Value (USD Million) & Volume (Units) Trend Analysis By Market Taxonomy, 2020 to 2024
    • Market Size Value (USD Million) & Volume (Units) Forecast By Market Taxonomy, 2025 to 2035
      • By Country
        • China
        • Japan
        • South Korea
      • By Treatment Type
      • By Active Ingredient
      • By Form
      • By Channel
      • By End User
    • Market Attractiveness Analysis
      • By Country
      • By Treatment Type
      • By Active Ingredient
      • By Form
      • By Channel
      • By End User
    • Key Takeaways
  15. South Asia & Pacific Market Analysis 2020 to 2024 and Forecast 2025 to 2035, By Country
    • Historical Market Size Value (USD Million) & Volume (Units) Trend Analysis By Market Taxonomy, 2020 to 2024
    • Market Size Value (USD Million) & Volume (Units) Forecast By Market Taxonomy, 2025 to 2035
      • By Country
        • India
        • Thailand
        • Malaysia
        • Indonesia
        • Singapore
        • Vietnam
        • Australia
        • New Zealand
        • Rest of South Asia
      • By Treatment Type
      • By Active Ingredient
      • By Form
      • By Channel
      • By End User
    • Market Attractiveness Analysis
      • By Country
      • By Treatment Type
      • By Active Ingredient
      • By Form
      • By Channel
      • By End User
    • Key Takeaways
  16. Middle East and Africa Market Analysis 2020 to 2024 and Forecast 2025 to 2035, By Country
    • Historical Market Size Value (USD Million) & Volume (Units) Trend Analysis By Market Taxonomy, 2020 to 2024
    • Market Size Value (USD Million) & Volume (Units) Forecast By Market Taxonomy, 2025 to 2035
      • By Country
        • Turkey
        • UAE
        • Saudi Arabia
        • Israel
        • Other GCC Countries
        • North Africa
        • South Africa
      • By Treatment Type
      • By Active Ingredient
      • By Form
      • By Channel
      • By End User
    • Market Attractiveness Analysis
      • By Country
      • By Treatment Type
      • By Active Ingredient
      • By Form
      • By Channel
      • By End User
    • Key Takeaways
  17. Key Countries Market Analysis
    • U.S.
      • Pricing Analysis
      • Market Share Analysis, 2024
        • By Treatment Type
        • By Active Ingredient
        • By Form
        • By Channel
        • By End User
    • Canada
      • Pricing Analysis
      • Market Share Analysis, 2024
        • By Treatment Type
        • By Active Ingredient
        • By Form
        • By Channel
        • By End User
    • Brazil
      • Pricing Analysis
      • Market Share Analysis, 2024
        • By Treatment Type
        • By Active Ingredient
        • By Form
        • By Channel
        • By End User
    • Mexico
      • Pricing Analysis
      • Market Share Analysis, 2024
        • By Treatment Type
        • By Active Ingredient
        • By Form
        • By Channel
        • By End User
    • Colombia
      • Pricing Analysis
      • Market Share Analysis, 2024
        • By Treatment Type
        • By Active Ingredient
        • By Form
        • By Channel
        • By End User
    • Germany
      • Pricing Analysis
      • Market Share Analysis, 2024
        • By Treatment Type
        • By Active Ingredient
        • By Form
        • By Channel
        • By End User
    • U.K.
      • Pricing Analysis
      • Market Share Analysis, 2024
        • By Treatment Type
        • By Active Ingredient
        • By Form
        • By Channel
        • By End User
    • France
      • Pricing Analysis
      • Market Share Analysis, 2024
        • By Treatment Type
        • By Active Ingredient
        • By Form
        • By Channel
        • By End User
    • Italy
      • Pricing Analysis
      • Market Share Analysis, 2024
        • By Treatment Type
        • By Active Ingredient
        • By Form
        • By Channel
        • By End User
    • Spain
      • Pricing Analysis
      • Market Share Analysis, 2024
        • By Treatment Type
        • By Active Ingredient
        • By Form
        • By Channel
        • By End User
    • Belgium
      • Pricing Analysis
      • Market Share Analysis, 2024
        • By Treatment Type
        • By Active Ingredient
        • By Form
        • By Channel
        • By End User
    • Netherlands
      • Pricing Analysis
      • Market Share Analysis, 2024
        • By Treatment Type
        • By Active Ingredient
        • By Form
        • By Channel
        • By End User
    • Nordic
      • Pricing Analysis
      • Market Share Analysis, 2024
        • By Treatment Type
        • By Active Ingredient
        • By Form
        • By Channel
        • By End User
    • Switzerland
      • Pricing Analysis
      • Market Share Analysis, 2024
        • By Treatment Type
        • By Active Ingredient
        • By Form
        • By Channel
        • By End User
    • Russia
      • Pricing Analysis
      • Market Share Analysis, 2024
        • By Treatment Type
        • By Active Ingredient
        • By Form
        • By Channel
        • By End User
    • Poland
      • Pricing Analysis
      • Market Share Analysis, 2024
        • By Treatment Type
        • By Active Ingredient
        • By Form
        • By Channel
        • By End User
    • China
      • Pricing Analysis
      • Market Share Analysis, 2024
        • By Treatment Type
        • By Active Ingredient
        • By Form
        • By Channel
        • By End User
    • Japan
      • Pricing Analysis
      • Market Share Analysis, 2024
        • By Treatment Type
        • By Active Ingredient
        • By Form
        • By Channel
        • By End User
    • South Korea
      • Pricing Analysis
      • Market Share Analysis, 2024
        • By Treatment Type
        • By Active Ingredient
        • By Form
        • By Channel
        • By End User
    • India
      • Pricing Analysis
      • Market Share Analysis, 2024
        • By Treatment Type
        • By Active Ingredient
        • By Form
        • By Channel
        • By End User
    • Thailand
      • Pricing Analysis
      • Market Share Analysis, 2024
        • By Treatment Type
        • By Active Ingredient
        • By Form
        • By Channel
        • By End User
    • Indonesia
      • Pricing Analysis
      • Market Share Analysis, 2024
        • By Treatment Type
        • By Active Ingredient
        • By Form
        • By Channel
        • By End User
    • Australia
      • Pricing Analysis
      • Market Share Analysis, 2024
        • By Treatment Type
        • By Active Ingredient
        • By Form
        • By Channel
        • By End User
    • New Zealand
      • Pricing Analysis
      • Market Share Analysis, 2024
        • By Treatment Type
        • By Active Ingredient
        • By Form
        • By Channel
        • By End User
    • Turkey
      • Pricing Analysis
      • Market Share Analysis, 2024
        • By Treatment Type
        • By Active Ingredient
        • By Form
        • By Channel
        • By End User
    • UAE
      • Pricing Analysis
      • Market Share Analysis, 2024
        • By Treatment Type
        • By Active Ingredient
        • By Form
        • By Channel
        • By End User
    • Saudi Arabia
      • Pricing Analysis
      • Market Share Analysis, 2024
        • By Treatment Type
        • By Active Ingredient
        • By Form
        • By Channel
        • By End User
    • Israel
      • Pricing Analysis
      • Market Share Analysis, 2024
        • By Treatment Type
        • By Active Ingredient
        • By Form
        • By Channel
        • By End User
    • North Africa
      • Pricing Analysis
      • Market Share Analysis, 2024
        • By Treatment Type
        • By Active Ingredient
        • By Form
        • By Channel
        • By End User
    • South Africa
      • Pricing Analysis
      • Market Share Analysis, 2024
        • By Treatment Type
        • By Active Ingredient
        • By Form
        • By Channel
        • By End User
  18. Market Structure Analysis
    • Competition Dashboard
    • Competition Benchmarking
    • Market Share Analysis of Top Players
      • By Regional
      • By Treatment Type
      • By Active Ingredient
      • By Form
      • By Channel
      • By End User
  19. Competition Analysis
    • Competition Deep Dive
      • La Roche-Posay
        • Overview
        • Product Portfolio
        • Profitability by Market Segments (Product/Age /Sales Channel/Region)
        • Sales Footprint
        • Strategy Overview
          • Marketing Strategy
          • Product Strategy
          • Channel Strategy
      • Neutrogena
        • Overview
        • Product Portfolio
        • Profitability by Market Segments (Product/Age /Sales Channel/Region)
        • Sales Footprint
        • Strategy Overview
          • Marketing Strategy
          • Product Strategy
          • Channel Strategy
      • CeraVe
        • Overview
        • Product Portfolio
        • Profitability by Market Segments (Product/Age /Sales Channel/Region)
        • Sales Footprint
        • Strategy Overview
          • Marketing Strategy
          • Product Strategy
          • Channel Strategy
      • Paula’s Choice
        • Overview
        • Product Portfolio
        • Profitability by Market Segments (Product/Age /Sales Channel/Region)
        • Sales Footprint
        • Strategy Overview
          • Marketing Strategy
          • Product Strategy
          • Channel Strategy
      • The Ordinary
        • Overview
        • Product Portfolio
        • Profitability by Market Segments (Product/Age /Sales Channel/Region)
        • Sales Footprint
        • Strategy Overview
          • Marketing Strategy
          • Product Strategy
          • Channel Strategy
      • Differin
        • Overview
        • Product Portfolio
        • Profitability by Market Segments (Product/Age /Sales Channel/Region)
        • Sales Footprint
        • Strategy Overview
          • Marketing Strategy
          • Product Strategy
          • Channel Strategy
      • Proactiv
        • Overview
        • Product Portfolio
        • Profitability by Market Segments (Product/Age /Sales Channel/Region)
        • Sales Footprint
        • Strategy Overview
          • Marketing Strategy
          • Product Strategy
          • Channel Strategy
      • Murad
        • Overview
        • Product Portfolio
        • Profitability by Market Segments (Product/Age /Sales Channel/Region)
        • Sales Footprint
        • Strategy Overview
          • Marketing Strategy
          • Product Strategy
          • Channel Strategy
      • Bioderma
        • Overview
        • Product Portfolio
        • Profitability by Market Segments (Product/Age /Sales Channel/Region)
        • Sales Footprint
        • Strategy Overview
          • Marketing Strategy
          • Product Strategy
          • Channel Strategy
      • COSRX
        • Overview
        • Product Portfolio
        • Profitability by Market Segments (Product/Age /Sales Channel/Region)
        • Sales Footprint
        • Strategy Overview
          • Marketing Strategy
          • Product Strategy
          • Channel Strategy
      • Others
        • Overview
        • Product Portfolio
        • Profitability by Market Segments (Product/Age /Sales Channel/Region)
        • Sales Footprint
        • Strategy Overview
          • Marketing Strategy
          • Product Strategy
          • Channel Strategy
  20. Assumptions & Acronyms Used
  21. Research Methodology

List of Tables

  • Table 1: Global Market Value (USD Million) Forecast by Region, 2020-2035
  • Table 2: Global Market Volume (Units) Forecast by Region, 2020-2035
  • Table 3: Global Market Value (USD Million) Forecast by Treatment Type, 2020-2035
  • Table 4: Global Market Volume (Units) Forecast by Treatment Type, 2020-2035
  • Table 5: Global Market Value (USD Million) Forecast by Active Ingredient, 2020-2035
  • Table 6: Global Market Volume (Units) Forecast by Active Ingredient, 2020-2035
  • Table 7: Global Market Value (USD Million) Forecast by Form, 2020-2035
  • Table 8: Global Market Volume (Units) Forecast by Form, 2020-2035
  • Table 9: Global Market Value (USD Million) Forecast by Channel, 2020-2035
  • Table 10: Global Market Volume (Units) Forecast by Channel, 2020-2035
  • Table 11: Global Market Value (USD Million) Forecast by End User, 2020-2035
  • Table 12: Global Market Volume (Units) Forecast by End User, 2020-2035
  • Table 13: North America Market Value (USD Million) Forecast by Country, 2020-2035
  • Table 14: North America Market Volume (Units) Forecast by Country, 2020-2035
  • Table 15: North America Market Value (USD Million) Forecast by Treatment Type, 2020-2035
  • Table 16: North America Market Volume (Units) Forecast by Treatment Type, 2020-2035
  • Table 17: North America Market Value (USD Million) Forecast by Active Ingredient, 2020-2035
  • Table 18: North America Market Volume (Units) Forecast by Active Ingredient, 2020-2035
  • Table 19: North America Market Value (USD Million) Forecast by Form, 2020-2035
  • Table 20: North America Market Volume (Units) Forecast by Form, 2020-2035
  • Table 21: North America Market Value (USD Million) Forecast by Channel, 2020-2035
  • Table 22: North America Market Volume (Units) Forecast by Channel, 2020-2035
  • Table 23: North America Market Value (USD Million) Forecast by End User, 2020-2035
  • Table 24: North America Market Volume (Units) Forecast by End User, 2020-2035
  • Table 25: Latin America Market Value (USD Million) Forecast by Country, 2020-2035
  • Table 26: Latin America Market Volume (Units) Forecast by Country, 2020-2035
  • Table 27: Latin America Market Value (USD Million) Forecast by Treatment Type, 2020-2035
  • Table 28: Latin America Market Volume (Units) Forecast by Treatment Type, 2020-2035
  • Table 29: Latin America Market Value (USD Million) Forecast by Active Ingredient, 2020-2035
  • Table 30: Latin America Market Volume (Units) Forecast by Active Ingredient, 2020-2035
  • Table 31: Latin America Market Value (USD Million) Forecast by Form, 2020-2035
  • Table 32: Latin America Market Volume (Units) Forecast by Form, 2020-2035
  • Table 33: Latin America Market Value (USD Million) Forecast by Channel, 2020-2035
  • Table 34: Latin America Market Volume (Units) Forecast by Channel, 2020-2035
  • Table 35: Latin America Market Value (USD Million) Forecast by End User, 2020-2035
  • Table 36: Latin America Market Volume (Units) Forecast by End User, 2020-2035
  • Table 37: Europe Market Value (USD Million) Forecast by Country, 2020-2035
  • Table 38: Europe Market Volume (Units) Forecast by Country, 2020-2035
  • Table 39: Europe Market Value (USD Million) Forecast by Treatment Type, 2020-2035
  • Table 40: Europe Market Volume (Units) Forecast by Treatment Type, 2020-2035
  • Table 41: Europe Market Value (USD Million) Forecast by Active Ingredient, 2020-2035
  • Table 42: Europe Market Volume (Units) Forecast by Active Ingredient, 2020-2035
  • Table 43: Europe Market Value (USD Million) Forecast by Form, 2020-2035
  • Table 44: Europe Market Volume (Units) Forecast by Form, 2020-2035
  • Table 45: Europe Market Value (USD Million) Forecast by Channel, 2020-2035
  • Table 46: Europe Market Volume (Units) Forecast by Channel, 2020-2035
  • Table 47: Europe Market Value (USD Million) Forecast by End User, 2020-2035
  • Table 48: Europe Market Volume (Units) Forecast by End User, 2020-2035
  • Table 49: East Asia Market Value (USD Million) Forecast by Country, 2020-2035
  • Table 50: East Asia Market Volume (Units) Forecast by Country, 2020-2035
  • Table 51: East Asia Market Value (USD Million) Forecast by Treatment Type, 2020-2035
  • Table 52: East Asia Market Volume (Units) Forecast by Treatment Type, 2020-2035
  • Table 53: East Asia Market Value (USD Million) Forecast by Active Ingredient, 2020-2035
  • Table 54: East Asia Market Volume (Units) Forecast by Active Ingredient, 2020-2035
  • Table 55: East Asia Market Value (USD Million) Forecast by Form, 2020-2035
  • Table 56: East Asia Market Volume (Units) Forecast by Form, 2020-2035
  • Table 57: East Asia Market Value (USD Million) Forecast by Channel, 2020-2035
  • Table 58: East Asia Market Volume (Units) Forecast by Channel, 2020-2035
  • Table 59: East Asia Market Value (USD Million) Forecast by End User, 2020-2035
  • Table 60: East Asia Market Volume (Units) Forecast by End User, 2020-2035
  • Table 61: South Asia & Pacific Market Value (USD Million) Forecast by Country, 2020-2035
  • Table 62: South Asia & Pacific Market Volume (Units) Forecast by Country, 2020-2035
  • Table 63: South Asia & Pacific Market Value (USD Million) Forecast by Treatment Type, 2020-2035
  • Table 64: South Asia & Pacific Market Volume (Units) Forecast by Treatment Type, 2020-2035
  • Table 65: South Asia & Pacific Market Value (USD Million) Forecast by Active Ingredient, 2020-2035
  • Table 66: South Asia & Pacific Market Volume (Units) Forecast by Active Ingredient, 2020-2035
  • Table 67: South Asia & Pacific Market Value (USD Million) Forecast by Form, 2020-2035
  • Table 68: South Asia & Pacific Market Volume (Units) Forecast by Form, 2020-2035
  • Table 69: South Asia & Pacific Market Value (USD Million) Forecast by Channel, 2020-2035
  • Table 70: South Asia & Pacific Market Volume (Units) Forecast by Channel, 2020-2035
  • Table 71: South Asia & Pacific Market Value (USD Million) Forecast by End User, 2020-2035
  • Table 72: South Asia & Pacific Market Volume (Units) Forecast by End User, 2020-2035
  • Table 73: Middle East and Africa Market Value (USD Million) Forecast by Country, 2020-2035
  • Table 74: Middle East and Africa Market Volume (Units) Forecast by Country, 2020-2035
  • Table 75: Middle East and Africa Market Value (USD Million) Forecast by Treatment Type, 2020-2035
  • Table 76: Middle East and Africa Market Volume (Units) Forecast by Treatment Type, 2020-2035
  • Table 77: Middle East and Africa Market Value (USD Million) Forecast by Active Ingredient, 2020-2035
  • Table 78: Middle East and Africa Market Volume (Units) Forecast by Active Ingredient, 2020-2035
  • Table 79: Middle East and Africa Market Value (USD Million) Forecast by Form, 2020-2035
  • Table 80: Middle East and Africa Market Volume (Units) Forecast by Form, 2020-2035
  • Table 81: Middle East and Africa Market Value (USD Million) Forecast by Channel, 2020-2035
  • Table 82: Middle East and Africa Market Volume (Units) Forecast by Channel, 2020-2035
  • Table 83: Middle East and Africa Market Value (USD Million) Forecast by End User, 2020-2035
  • Table 84: Middle East and Africa Market Volume (Units) Forecast by End User, 2020-2035

List of Figures

  • Figure 1: Global Market Value (USD Million) by Treatment Type, 2025-2035
  • Figure 2: Global Market Value (USD Million) by Active Ingredient, 2025-2035
  • Figure 3: Global Market Value (USD Million) by Form, 2025-2035
  • Figure 4: Global Market Value (USD Million) by Channel, 2025-2035
  • Figure 5: Global Market Value (USD Million) by End User, 2025-2035
  • Figure 6: Global Market Value (USD Million) by Region, 2025-2035
  • Figure 7: Global Market Value (USD Million) Analysis by Region, 2020-2035
  • Figure 8: Global Market Volume (Units) Analysis by Region, 2020-2035
  • Figure 9: Global Market Value Share (%) and BPS Analysis by Region, 2025-2035
  • Figure 10: Global Market Y-o-Y Growth (%) Projections by Region, 2025-2035
  • Figure 11: Global Market Value (USD Million) Analysis by Treatment Type, 2020-2035
  • Figure 12: Global Market Volume (Units) Analysis by Treatment Type, 2020-2035
  • Figure 13: Global Market Value Share (%) and BPS Analysis by Treatment Type, 2025-2035
  • Figure 14: Global Market Y-o-Y Growth (%) Projections by Treatment Type, 2025-2035
  • Figure 15: Global Market Value (USD Million) Analysis by Active Ingredient, 2020-2035
  • Figure 16: Global Market Volume (Units) Analysis by Active Ingredient, 2020-2035
  • Figure 17: Global Market Value Share (%) and BPS Analysis by Active Ingredient, 2025-2035
  • Figure 18: Global Market Y-o-Y Growth (%) Projections by Active Ingredient, 2025-2035
  • Figure 19: Global Market Value (USD Million) Analysis by Form, 2020-2035
  • Figure 20: Global Market Volume (Units) Analysis by Form, 2020-2035
  • Figure 21: Global Market Value Share (%) and BPS Analysis by Form, 2025-2035
  • Figure 22: Global Market Y-o-Y Growth (%) Projections by Form, 2025-2035
  • Figure 23: Global Market Value (USD Million) Analysis by Channel, 2020-2035
  • Figure 24: Global Market Volume (Units) Analysis by Channel, 2020-2035
  • Figure 25: Global Market Value Share (%) and BPS Analysis by Channel, 2025-2035
  • Figure 26: Global Market Y-o-Y Growth (%) Projections by Channel, 2025-2035
  • Figure 27: Global Market Value (USD Million) Analysis by End User, 2020-2035
  • Figure 28: Global Market Volume (Units) Analysis by End User, 2020-2035
  • Figure 29: Global Market Value Share (%) and BPS Analysis by End User, 2025-2035
  • Figure 30: Global Market Y-o-Y Growth (%) Projections by End User, 2025-2035
  • Figure 31: Global Market Attractiveness by Treatment Type, 2025-2035
  • Figure 32: Global Market Attractiveness by Active Ingredient, 2025-2035
  • Figure 33: Global Market Attractiveness by Form, 2025-2035
  • Figure 34: Global Market Attractiveness by Channel, 2025-2035
  • Figure 35: Global Market Attractiveness by End User, 2025-2035
  • Figure 36: Global Market Attractiveness by Region, 2025-2035
  • Figure 37: North America Market Value (USD Million) by Treatment Type, 2025-2035
  • Figure 38: North America Market Value (USD Million) by Active Ingredient, 2025-2035
  • Figure 39: North America Market Value (USD Million) by Form, 2025-2035
  • Figure 40: North America Market Value (USD Million) by Channel, 2025-2035
  • Figure 41: North America Market Value (USD Million) by End User, 2025-2035
  • Figure 42: North America Market Value (USD Million) by Country, 2025-2035
  • Figure 43: North America Market Value (USD Million) Analysis by Country, 2020-2035
  • Figure 44: North America Market Volume (Units) Analysis by Country, 2020-2035
  • Figure 45: North America Market Value Share (%) and BPS Analysis by Country, 2025-2035
  • Figure 46: North America Market Y-o-Y Growth (%) Projections by Country, 2025-2035
  • Figure 47: North America Market Value (USD Million) Analysis by Treatment Type, 2020-2035
  • Figure 48: North America Market Volume (Units) Analysis by Treatment Type, 2020-2035
  • Figure 49: North America Market Value Share (%) and BPS Analysis by Treatment Type, 2025-2035
  • Figure 50: North America Market Y-o-Y Growth (%) Projections by Treatment Type, 2025-2035
  • Figure 51: North America Market Value (USD Million) Analysis by Active Ingredient, 2020-2035
  • Figure 52: North America Market Volume (Units) Analysis by Active Ingredient, 2020-2035
  • Figure 53: North America Market Value Share (%) and BPS Analysis by Active Ingredient, 2025-2035
  • Figure 54: North America Market Y-o-Y Growth (%) Projections by Active Ingredient, 2025-2035
  • Figure 55: North America Market Value (USD Million) Analysis by Form, 2020-2035
  • Figure 56: North America Market Volume (Units) Analysis by Form, 2020-2035
  • Figure 57: North America Market Value Share (%) and BPS Analysis by Form, 2025-2035
  • Figure 58: North America Market Y-o-Y Growth (%) Projections by Form, 2025-2035
  • Figure 59: North America Market Value (USD Million) Analysis by Channel, 2020-2035
  • Figure 60: North America Market Volume (Units) Analysis by Channel, 2020-2035
  • Figure 61: North America Market Value Share (%) and BPS Analysis by Channel, 2025-2035
  • Figure 62: North America Market Y-o-Y Growth (%) Projections by Channel, 2025-2035
  • Figure 63: North America Market Value (USD Million) Analysis by End User, 2020-2035
  • Figure 64: North America Market Volume (Units) Analysis by End User, 2020-2035
  • Figure 65: North America Market Value Share (%) and BPS Analysis by End User, 2025-2035
  • Figure 66: North America Market Y-o-Y Growth (%) Projections by End User, 2025-2035
  • Figure 67: North America Market Attractiveness by Treatment Type, 2025-2035
  • Figure 68: North America Market Attractiveness by Active Ingredient, 2025-2035
  • Figure 69: North America Market Attractiveness by Form, 2025-2035
  • Figure 70: North America Market Attractiveness by Channel, 2025-2035
  • Figure 71: North America Market Attractiveness by End User, 2025-2035
  • Figure 72: North America Market Attractiveness by Country, 2025-2035
  • Figure 73: Latin America Market Value (USD Million) by Treatment Type, 2025-2035
  • Figure 74: Latin America Market Value (USD Million) by Active Ingredient, 2025-2035
  • Figure 75: Latin America Market Value (USD Million) by Form, 2025-2035
  • Figure 76: Latin America Market Value (USD Million) by Channel, 2025-2035
  • Figure 77: Latin America Market Value (USD Million) by End User, 2025-2035
  • Figure 78: Latin America Market Value (USD Million) by Country, 2025-2035
  • Figure 79: Latin America Market Value (USD Million) Analysis by Country, 2020-2035
  • Figure 80: Latin America Market Volume (Units) Analysis by Country, 2020-2035
  • Figure 81: Latin America Market Value Share (%) and BPS Analysis by Country, 2025-2035
  • Figure 82: Latin America Market Y-o-Y Growth (%) Projections by Country, 2025-2035
  • Figure 83: Latin America Market Value (USD Million) Analysis by Treatment Type, 2020-2035
  • Figure 84: Latin America Market Volume (Units) Analysis by Treatment Type, 2020-2035
  • Figure 85: Latin America Market Value Share (%) and BPS Analysis by Treatment Type, 2025-2035
  • Figure 86: Latin America Market Y-o-Y Growth (%) Projections by Treatment Type, 2025-2035
  • Figure 87: Latin America Market Value (USD Million) Analysis by Active Ingredient, 2020-2035
  • Figure 88: Latin America Market Volume (Units) Analysis by Active Ingredient, 2020-2035
  • Figure 89: Latin America Market Value Share (%) and BPS Analysis by Active Ingredient, 2025-2035
  • Figure 90: Latin America Market Y-o-Y Growth (%) Projections by Active Ingredient, 2025-2035
  • Figure 91: Latin America Market Value (USD Million) Analysis by Form, 2020-2035
  • Figure 92: Latin America Market Volume (Units) Analysis by Form, 2020-2035
  • Figure 93: Latin America Market Value Share (%) and BPS Analysis by Form, 2025-2035
  • Figure 94: Latin America Market Y-o-Y Growth (%) Projections by Form, 2025-2035
  • Figure 95: Latin America Market Value (USD Million) Analysis by Channel, 2020-2035
  • Figure 96: Latin America Market Volume (Units) Analysis by Channel, 2020-2035
  • Figure 97: Latin America Market Value Share (%) and BPS Analysis by Channel, 2025-2035
  • Figure 98: Latin America Market Y-o-Y Growth (%) Projections by Channel, 2025-2035
  • Figure 99: Latin America Market Value (USD Million) Analysis by End User, 2020-2035
  • Figure 100: Latin America Market Volume (Units) Analysis by End User, 2020-2035
  • Figure 101: Latin America Market Value Share (%) and BPS Analysis by End User, 2025-2035
  • Figure 102: Latin America Market Y-o-Y Growth (%) Projections by End User, 2025-2035
  • Figure 103: Latin America Market Attractiveness by Treatment Type, 2025-2035
  • Figure 104: Latin America Market Attractiveness by Active Ingredient, 2025-2035
  • Figure 105: Latin America Market Attractiveness by Form, 2025-2035
  • Figure 106: Latin America Market Attractiveness by Channel, 2025-2035
  • Figure 107: Latin America Market Attractiveness by End User, 2025-2035
  • Figure 108: Latin America Market Attractiveness by Country, 2025-2035
  • Figure 109: Europe Market Value (USD Million) by Treatment Type, 2025-2035
  • Figure 110: Europe Market Value (USD Million) by Active Ingredient, 2025-2035
  • Figure 111: Europe Market Value (USD Million) by Form, 2025-2035
  • Figure 112: Europe Market Value (USD Million) by Channel, 2025-2035
  • Figure 113: Europe Market Value (USD Million) by End User, 2025-2035
  • Figure 114: Europe Market Value (USD Million) by Country, 2025-2035
  • Figure 115: Europe Market Value (USD Million) Analysis by Country, 2020-2035
  • Figure 116: Europe Market Volume (Units) Analysis by Country, 2020-2035
  • Figure 117: Europe Market Value Share (%) and BPS Analysis by Country, 2025-2035
  • Figure 118: Europe Market Y-o-Y Growth (%) Projections by Country, 2025-2035
  • Figure 119: Europe Market Value (USD Million) Analysis by Treatment Type, 2020-2035
  • Figure 120: Europe Market Volume (Units) Analysis by Treatment Type, 2020-2035
  • Figure 121: Europe Market Value Share (%) and BPS Analysis by Treatment Type, 2025-2035
  • Figure 122: Europe Market Y-o-Y Growth (%) Projections by Treatment Type, 2025-2035
  • Figure 123: Europe Market Value (USD Million) Analysis by Active Ingredient, 2020-2035
  • Figure 124: Europe Market Volume (Units) Analysis by Active Ingredient, 2020-2035
  • Figure 125: Europe Market Value Share (%) and BPS Analysis by Active Ingredient, 2025-2035
  • Figure 126: Europe Market Y-o-Y Growth (%) Projections by Active Ingredient, 2025-2035
  • Figure 127: Europe Market Value (USD Million) Analysis by Form, 2020-2035
  • Figure 128: Europe Market Volume (Units) Analysis by Form, 2020-2035
  • Figure 129: Europe Market Value Share (%) and BPS Analysis by Form, 2025-2035
  • Figure 130: Europe Market Y-o-Y Growth (%) Projections by Form, 2025-2035
  • Figure 131: Europe Market Value (USD Million) Analysis by Channel, 2020-2035
  • Figure 132: Europe Market Volume (Units) Analysis by Channel, 2020-2035
  • Figure 133: Europe Market Value Share (%) and BPS Analysis by Channel, 2025-2035
  • Figure 134: Europe Market Y-o-Y Growth (%) Projections by Channel, 2025-2035
  • Figure 135: Europe Market Value (USD Million) Analysis by End User, 2020-2035
  • Figure 136: Europe Market Volume (Units) Analysis by End User, 2020-2035
  • Figure 137: Europe Market Value Share (%) and BPS Analysis by End User, 2025-2035
  • Figure 138: Europe Market Y-o-Y Growth (%) Projections by End User, 2025-2035
  • Figure 139: Europe Market Attractiveness by Treatment Type, 2025-2035
  • Figure 140: Europe Market Attractiveness by Active Ingredient, 2025-2035
  • Figure 141: Europe Market Attractiveness by Form, 2025-2035
  • Figure 142: Europe Market Attractiveness by Channel, 2025-2035
  • Figure 143: Europe Market Attractiveness by End User, 2025-2035
  • Figure 144: Europe Market Attractiveness by Country, 2025-2035
  • Figure 145: East Asia Market Value (USD Million) by Treatment Type, 2025-2035
  • Figure 146: East Asia Market Value (USD Million) by Active Ingredient, 2025-2035
  • Figure 147: East Asia Market Value (USD Million) by Form, 2025-2035
  • Figure 148: East Asia Market Value (USD Million) by Channel, 2025-2035
  • Figure 149: East Asia Market Value (USD Million) by End User, 2025-2035
  • Figure 150: East Asia Market Value (USD Million) by Country, 2025-2035
  • Figure 151: East Asia Market Value (USD Million) Analysis by Country, 2020-2035
  • Figure 152: East Asia Market Volume (Units) Analysis by Country, 2020-2035
  • Figure 153: East Asia Market Value Share (%) and BPS Analysis by Country, 2025-2035
  • Figure 154: East Asia Market Y-o-Y Growth (%) Projections by Country, 2025-2035
  • Figure 155: East Asia Market Value (USD Million) Analysis by Treatment Type, 2020-2035
  • Figure 156: East Asia Market Volume (Units) Analysis by Treatment Type, 2020-2035
  • Figure 157: East Asia Market Value Share (%) and BPS Analysis by Treatment Type, 2025-2035
  • Figure 158: East Asia Market Y-o-Y Growth (%) Projections by Treatment Type, 2025-2035
  • Figure 159: East Asia Market Value (USD Million) Analysis by Active Ingredient, 2020-2035
  • Figure 160: East Asia Market Volume (Units) Analysis by Active Ingredient, 2020-2035
  • Figure 161: East Asia Market Value Share (%) and BPS Analysis by Active Ingredient, 2025-2035
  • Figure 162: East Asia Market Y-o-Y Growth (%) Projections by Active Ingredient, 2025-2035
  • Figure 163: East Asia Market Value (USD Million) Analysis by Form, 2020-2035
  • Figure 164: East Asia Market Volume (Units) Analysis by Form, 2020-2035
  • Figure 165: East Asia Market Value Share (%) and BPS Analysis by Form, 2025-2035
  • Figure 166: East Asia Market Y-o-Y Growth (%) Projections by Form, 2025-2035
  • Figure 167: East Asia Market Value (USD Million) Analysis by Channel, 2020-2035
  • Figure 168: East Asia Market Volume (Units) Analysis by Channel, 2020-2035
  • Figure 169: East Asia Market Value Share (%) and BPS Analysis by Channel, 2025-2035
  • Figure 170: East Asia Market Y-o-Y Growth (%) Projections by Channel, 2025-2035
  • Figure 171: East Asia Market Value (USD Million) Analysis by End User, 2020-2035
  • Figure 172: East Asia Market Volume (Units) Analysis by End User, 2020-2035
  • Figure 173: East Asia Market Value Share (%) and BPS Analysis by End User, 2025-2035
  • Figure 174: East Asia Market Y-o-Y Growth (%) Projections by End User, 2025-2035
  • Figure 175: East Asia Market Attractiveness by Treatment Type, 2025-2035
  • Figure 176: East Asia Market Attractiveness by Active Ingredient, 2025-2035
  • Figure 177: East Asia Market Attractiveness by Form, 2025-2035
  • Figure 178: East Asia Market Attractiveness by Channel, 2025-2035
  • Figure 179: East Asia Market Attractiveness by End User, 2025-2035
  • Figure 180: East Asia Market Attractiveness by Country, 2025-2035
  • Figure 181: South Asia & Pacific Market Value (USD Million) by Treatment Type, 2025-2035
  • Figure 182: South Asia & Pacific Market Value (USD Million) by Active Ingredient, 2025-2035
  • Figure 183: South Asia & Pacific Market Value (USD Million) by Form, 2025-2035
  • Figure 184: South Asia & Pacific Market Value (USD Million) by Channel, 2025-2035
  • Figure 185: South Asia & Pacific Market Value (USD Million) by End User, 2025-2035
  • Figure 186: South Asia & Pacific Market Value (USD Million) by Country, 2025-2035
  • Figure 187: South Asia & Pacific Market Value (USD Million) Analysis by Country, 2020-2035
  • Figure 188: South Asia & Pacific Market Volume (Units) Analysis by Country, 2020-2035
  • Figure 189: South Asia & Pacific Market Value Share (%) and BPS Analysis by Country, 2025-2035
  • Figure 190: South Asia & Pacific Market Y-o-Y Growth (%) Projections by Country, 2025-2035
  • Figure 191: South Asia & Pacific Market Value (USD Million) Analysis by Treatment Type, 2020-2035
  • Figure 192: South Asia & Pacific Market Volume (Units) Analysis by Treatment Type, 2020-2035
  • Figure 193: South Asia & Pacific Market Value Share (%) and BPS Analysis by Treatment Type, 2025-2035
  • Figure 194: South Asia & Pacific Market Y-o-Y Growth (%) Projections by Treatment Type, 2025-2035
  • Figure 195: South Asia & Pacific Market Value (USD Million) Analysis by Active Ingredient, 2020-2035
  • Figure 196: South Asia & Pacific Market Volume (Units) Analysis by Active Ingredient, 2020-2035
  • Figure 197: South Asia & Pacific Market Value Share (%) and BPS Analysis by Active Ingredient, 2025-2035
  • Figure 198: South Asia & Pacific Market Y-o-Y Growth (%) Projections by Active Ingredient, 2025-2035
  • Figure 199: South Asia & Pacific Market Value (USD Million) Analysis by Form, 2020-2035
  • Figure 200: South Asia & Pacific Market Volume (Units) Analysis by Form, 2020-2035
  • Figure 201: South Asia & Pacific Market Value Share (%) and BPS Analysis by Form, 2025-2035
  • Figure 202: South Asia & Pacific Market Y-o-Y Growth (%) Projections by Form, 2025-2035
  • Figure 203: South Asia & Pacific Market Value (USD Million) Analysis by Channel, 2020-2035
  • Figure 204: South Asia & Pacific Market Volume (Units) Analysis by Channel, 2020-2035
  • Figure 205: South Asia & Pacific Market Value Share (%) and BPS Analysis by Channel, 2025-2035
  • Figure 206: South Asia & Pacific Market Y-o-Y Growth (%) Projections by Channel, 2025-2035
  • Figure 207: South Asia & Pacific Market Value (USD Million) Analysis by End User, 2020-2035
  • Figure 208: South Asia & Pacific Market Volume (Units) Analysis by End User, 2020-2035
  • Figure 209: South Asia & Pacific Market Value Share (%) and BPS Analysis by End User, 2025-2035
  • Figure 210: South Asia & Pacific Market Y-o-Y Growth (%) Projections by End User, 2025-2035
  • Figure 211: South Asia & Pacific Market Attractiveness by Treatment Type, 2025-2035
  • Figure 212: South Asia & Pacific Market Attractiveness by Active Ingredient, 2025-2035
  • Figure 213: South Asia & Pacific Market Attractiveness by Form, 2025-2035
  • Figure 214: South Asia & Pacific Market Attractiveness by Channel, 2025-2035
  • Figure 215: South Asia & Pacific Market Attractiveness by End User, 2025-2035
  • Figure 216: South Asia & Pacific Market Attractiveness by Country, 2025-2035
  • Figure 217: Middle East and Africa Market Value (USD Million) by Treatment Type, 2025-2035
  • Figure 218: Middle East and Africa Market Value (USD Million) by Active Ingredient, 2025-2035
  • Figure 219: Middle East and Africa Market Value (USD Million) by Form, 2025-2035
  • Figure 220: Middle East and Africa Market Value (USD Million) by Channel, 2025-2035
  • Figure 221: Middle East and Africa Market Value (USD Million) by End User, 2025-2035
  • Figure 222: Middle East and Africa Market Value (USD Million) by Country, 2025-2035
  • Figure 223: Middle East and Africa Market Value (USD Million) Analysis by Country, 2020-2035
  • Figure 224: Middle East and Africa Market Volume (Units) Analysis by Country, 2020-2035
  • Figure 225: Middle East and Africa Market Value Share (%) and BPS Analysis by Country, 2025-2035
  • Figure 226: Middle East and Africa Market Y-o-Y Growth (%) Projections by Country, 2025-2035
  • Figure 227: Middle East and Africa Market Value (USD Million) Analysis by Treatment Type, 2020-2035
  • Figure 228: Middle East and Africa Market Volume (Units) Analysis by Treatment Type, 2020-2035
  • Figure 229: Middle East and Africa Market Value Share (%) and BPS Analysis by Treatment Type, 2025-2035
  • Figure 230: Middle East and Africa Market Y-o-Y Growth (%) Projections by Treatment Type, 2025-2035
  • Figure 231: Middle East and Africa Market Value (USD Million) Analysis by Active Ingredient, 2020-2035
  • Figure 232: Middle East and Africa Market Volume (Units) Analysis by Active Ingredient, 2020-2035
  • Figure 233: Middle East and Africa Market Value Share (%) and BPS Analysis by Active Ingredient, 2025-2035
  • Figure 234: Middle East and Africa Market Y-o-Y Growth (%) Projections by Active Ingredient, 2025-2035
  • Figure 235: Middle East and Africa Market Value (USD Million) Analysis by Form, 2020-2035
  • Figure 236: Middle East and Africa Market Volume (Units) Analysis by Form, 2020-2035
  • Figure 237: Middle East and Africa Market Value Share (%) and BPS Analysis by Form, 2025-2035
  • Figure 238: Middle East and Africa Market Y-o-Y Growth (%) Projections by Form, 2025-2035
  • Figure 239: Middle East and Africa Market Value (USD Million) Analysis by Channel, 2020-2035
  • Figure 240: Middle East and Africa Market Volume (Units) Analysis by Channel, 2020-2035
  • Figure 241: Middle East and Africa Market Value Share (%) and BPS Analysis by Channel, 2025-2035
  • Figure 242: Middle East and Africa Market Y-o-Y Growth (%) Projections by Channel, 2025-2035
  • Figure 243: Middle East and Africa Market Value (USD Million) Analysis by End User, 2020-2035
  • Figure 244: Middle East and Africa Market Volume (Units) Analysis by End User, 2020-2035
  • Figure 245: Middle East and Africa Market Value Share (%) and BPS Analysis by End User, 2025-2035
  • Figure 246: Middle East and Africa Market Y-o-Y Growth (%) Projections by End User, 2025-2035
  • Figure 247: Middle East and Africa Market Attractiveness by Treatment Type, 2025-2035
  • Figure 248: Middle East and Africa Market Attractiveness by Active Ingredient, 2025-2035
  • Figure 249: Middle East and Africa Market Attractiveness by Form, 2025-2035
  • Figure 250: Middle East and Africa Market Attractiveness by Channel, 2025-2035
  • Figure 251: Middle East and Africa Market Attractiveness by End User, 2025-2035
  • Figure 252: Middle East and Africa Market Attractiveness by Country, 2025-2035

Frequently Asked Questions

How big is the Acne Treatment Solutions Market in 2025?

The global Acne Treatment Solutions Market is estimated to be valued at USD 12,803.4 million in 2025.

What will be the size of Acne Treatment Solutions Market in 2035?

The market size for the Acne Treatment Solutions Market is projected to reach USD 29,501.5 million by 2035.

How much will be the Acne Treatment Solutions Market growth between 2025 and 2035?

The Acne Treatment Solutions Market is expected to grow at a 8.9% CAGR between 2025 and 2035.

What are the key Treatment types in the Acne Treatment Solutions Market?

The key treatment types in the Acne Treatment Solutions Market are OTC topicals (cleansers, gels), prescription topicals (retinoids, antibiotics), systemic therapies (oral antibiotics, isotretinoin), and device-based treatments (LED/blue light).

Which range segment to contribute significant share in the Acne Treatment Solutions Market in 2025?

In terms of treatment type, OTC topicals are projected to command 51.8% share in the Acne Treatment Solutions Market in 2025,

Explore Similar Insights

Future Market Insights

Acne Treatment Solutions Market

Chat With

MaRIA

Hi There, I am MaRIA, Your Market Research Intelligence Assistant. How may I help you?