Anti-Acne Products Market Size and Share Forecast Outlook 2025 to 2035

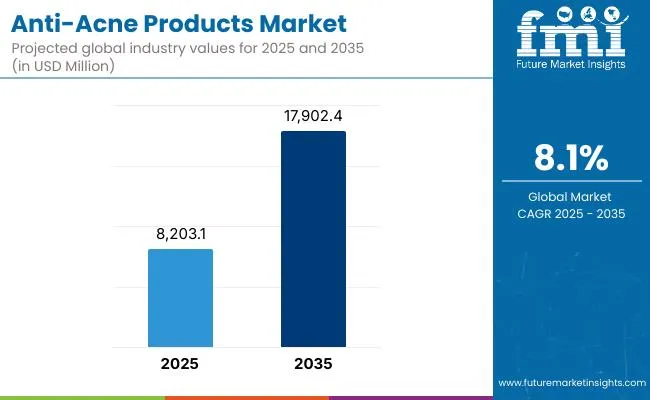
The global Anti-Acne Products Market is expected to record a valuation of USD 8,203.1 million in 2025 and USD 17,902.4 million in 2035, with an increase of USD 9,699.3 million, which equals a growth of more than 118% over the decade. The overall expansion represents a CAGR of 8.1% and demonstrates more than a 2X increase in market size.
Quick Stats for Global Anti-Acne Products Market

  • Global Anti-Acne Products Market Value (2025): USD 8,203.1 million
  • Global Anti-Acne Products Market Forecast Value (2035): USD 17,902.4 million
  • Global Anti-Acne Products Market Forecast CAGR: 8.1%
  • Leading Segment in Global Anti-Acne Products Market in 2025: Topical creams & gels (39.2%)
  • Key Growth Regions in the Global Anti-Acne Products Market: East Asia, South Asia & Pacific, North America
  • Top Key Players in Global Anti-Acne Products Market: Neutrogena, La Roche-Posay, Paula’s Choice, CeraVe, Proactiv, Murad, The Ordinary, Clean & Clear, Differin, Clinique
Anti Acne Products Market

Global Anti-Acne Products Market Key Takeaways

Metric Value
Global Anti-Acne Products Market Estimated Value in (2025E) USD 8,203.1 million
Global Anti-Acne Products Market Forecast Value in (2035F) USD 17,902.4 million
Forecast CAGR (2025 to 2035) 8.1%

During the first five-year period from 2025 to 2030, the market increases from USD 8,203.1 million to USD 12,118.4 million, adding USD 3,915.3 million, which accounts for around 40% of the total decade growth. This phase records steady adoption in the U.S. and Europe, where consumer awareness of dermatologist-tested and over-the-counter (OTC) formulations is strong.

Topical creams & gels dominate this period as they cater to over 39% of market demand, particularly among teenagers and young adults who require accessible, pharmacy-grade solutions. The U.S. alone adds more than USD 689 million during this five-year period, driven by strong pharmacy and e-commerce sales.

The second half from 2030 to 2035 contributes USD 5,784.0 million, equal to nearly 60% of total growth, as the market jumps from USD 12,118.4 million to USD 17,902.4 million. This acceleration is powered by widespread adoption of advanced actives like retinoids and niacinamide, alongside botanical formulations such as tea tree oil that appeal to the clean-label consumer base.

China and India drive much of this growth, with CAGRs of 14.6% and 16.4% respectively, reflecting rising disposable incomes, growing beauty consciousness, and higher dermatology clinic penetration. By the end of the decade, East Asia and South Asia collectively outpace North America in absolute incremental growth. E-commerce-led platforms and subscription-based OTC oral supplements increase recurring revenue, lifting digital channel contribution well beyond traditional pharmacies.

From 2020 to 2024, the global Anti-Acne Products Market grew from less than USD 7,000 million to over USD 8,000 million, driven by topical and cleanser-based adoption. During this period, the competitive landscape was dominated by pharmacy-oriented global brands controlling nearly 70% of revenue, with leaders such as Neutrogena, La Roche-Posay, and CeraVe focusing on clinically validated formulations for teens and adults.

Competitive differentiation relied on active ingredient choice (salicylic acid, benzoyl peroxide, and retinoids), dermatologist endorsements, and safety claims such as fragrance-free and sensitive-skin safe. Oral supplements and patches had limited traction, contributing less than 15% of the total market value.

Demand for anti-acne products expands to USD 8,203.1 million in 2025, and the revenue mix shifts as digital-first and clean-label players grow to over 25% share. Traditional global leaders face rising competition from niche entrants offering personalized formulations, vegan claims, and AI-driven skincare routines. Major multinational brands are pivoting to hybrid models, integrating subscription-based direct-to-consumer sales, influencer-led engagement, and dermatologist-linked e-commerce strategies to retain relevance.

Emerging entrants in China and India specializing in niacinamide- and botanical-driven formulations are gaining share. The competitive advantage is moving away from mass OTC products alone to ecosystem strength, omnichannel scalability, and recurring consumer engagement.

Why the Global Anti-Acne Products Market is growing?

Advances in dermatology science and ingredient innovation have improved efficacy and tolerability, allowing for more efficient acne management across diverse skin types. Topical creams & gels have gained popularity due to their suitability for first-line treatment and convenience for teens and young adults.

The rise of salicylic acid and benzoyl peroxide combinations has contributed to faster relief, while niacinamide and retinoids have enabled long-term acne and scar control. Oily and acne-prone skin categories are driving adoption, commanding nearly half the global market, while the sensitive skin category is seeing higher growth as consumers demand dermatologist-tested and fragrance-free formulations.

Expansion of e-commerce and digital dermatology consultations has fueled market growth. Innovations in spot treatments and patches, combined with oral supplements positioned for hormonal and adult acne, are expected to open new application areas.

Segment growth is expected to be led by topical formulations, oily-skin-oriented products, and active ingredients such as salicylic acid due to their clinical effectiveness and global consumer familiarity. Asia-Pacific will continue to outpace other regions with double-digit CAGRs, driven by demand from China, India, and Japan.

Segmental Analysis

The market is segmented by product type, active ingredient, skin type, channel, end user, and geography. Product types include topical creams & gels, medicated cleansers & face washes, spot treatments & patches, and oral supplements, highlighting the breadth of OTC adoption. Active ingredient segmentation covers salicylic acid, benzoyl peroxide, niacinamide, retinoids, and tea tree oil to cater to varying levels of severity and consumer preference.

Based on skin type, the segmentation includes oily/acne-prone, combination, sensitive, and dry, reflecting dermatology-driven targeting. Channels span pharmacies & drugstores, e-commerce, dermatology clinics, and mass retail/supermarkets, ensuring both clinical and consumer accessibility.

End users include teens, adults, men, and women, indicating demographic-specific buying trends. Regionally, the scope spans North America, Europe, East Asia, South Asia & Pacific, Latin America, and the Middle East & Africa.
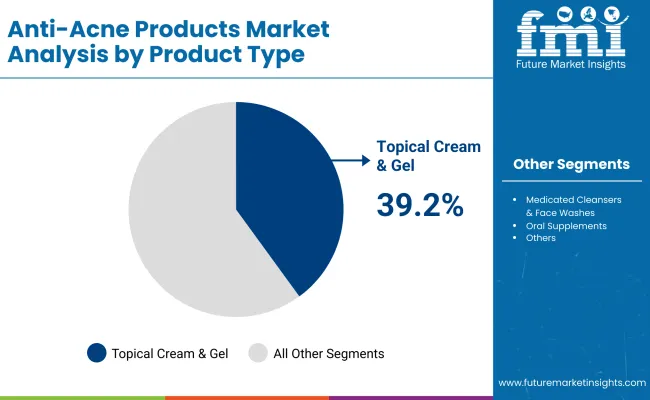
Insights into the Product Type Segment with Topical Creams & Gels Leading in Market Share

Anti Acne Products Market By Product Type

Product Type Value Share % 2025
Topical creams & gels 39.2%
Others 60.8%

The topical creams & gels segment is projected to contribute 39.2% of the global Anti-Acne Products Market revenue in 2025, maintaining its lead as the dominant product category. This growth is driven by continued consumer reliance on over-the-counter topical solutions as the first line of treatment for acne across both teenage and adult populations. Formulations enriched with actives such as benzoyl peroxide, salicylic acid, and niacinamide have been widely adopted due to their proven efficacy and dermatologist endorsements.

The segment’s growth is also supported by the innovation of lightweight gel-based formulations and non-comedogenic creams that improve consumer compliance and broaden accessibility across oily, combination, and sensitive skin types. As clean-label trends rise, creams & gels featuring botanical blends and fragrance-free claims are gaining traction. The topical category is expected to retain its position as the backbone of the anti-acne market, with consistent demand across pharmacies, dermatology clinics, and online platforms.
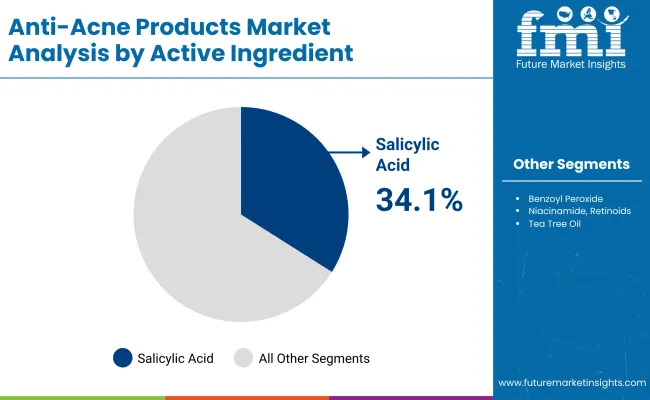
Insights into the Active Ingredient Segment with Salicylic Acid Dominating the Demand

Anti Acne Products Market By Ective Ingredient

Active Ingredient Value Share % 2025
Salicylic acid 34.1%
Others 65.9%

The salicylic acid segment is forecasted to hold 34.1% of the global Anti-Acne Products Market share in 2025, led by its extensive application in exfoliation, pore cleansing, and acne lesion reduction. Salicylic acid remains a dermatologist-preferred ingredient and is especially favored in topical gels, face washes, and spot treatments due to its keratolytic properties. Its ability to penetrate deeply into pores and regulate sebum makes it indispensable for oily and acne-prone skin types.

This segment benefits from salicylic acid’s established consumer trust and strong presence across both mass-market and premium product lines. The introduction of encapsulated and slow-release formulations has enhanced tolerability, reducing irritation risks and broadening adoption among sensitive-skin consumers. With consistent clinical validation and versatility across multiple product types, salicylic acid is expected to remain the cornerstone active in the anti-acne products category.
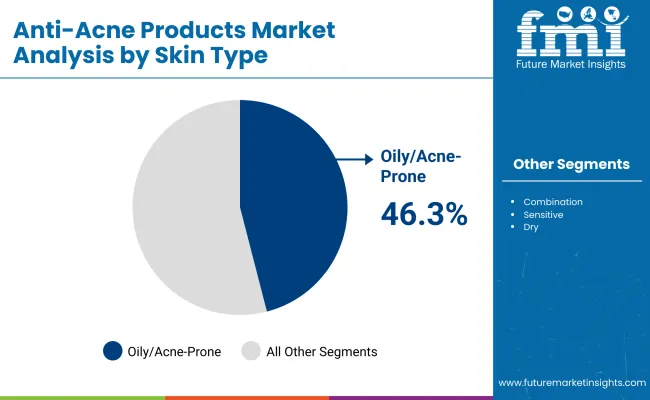
Insights into the Skin Type Segment with Oily/Acne-Prone Products Leading in Market Share

Anti Acne Products Market By Skin Type

Skin Type Value Share % 2025
Oily/acne-prone 46.3%
Others 53.7%

The oily/acne-prone skin segment is projected to account for 46.3% of the global Anti-Acne Products Market revenue in 2025, establishing it as the leading skin type category. The dominance of this segment is driven by the high global prevalence of oily and acne-prone conditions, particularly among teenagers and young adults. Consumers with oily skin seek products designed to reduce sebum, unclog pores, and prevent breakouts, fueling demand across cleansers, gels, and leave-on treatments.

The segment’s growth is further supported by the expansion of oil-control formulations that combine salicylic acid, niacinamide, and tea tree oil for multi-functional benefits. E-commerce platforms have amplified accessibility, enabling targeted product recommendations for oily skin regimes. With continued awareness of preventative skincare and the role of acne in overall skin health, oily/acne-prone products are expected to maintain their dominant market position.

What are the Drivers, Restraints, and Key Trends of the Global Anti-Acne Products Market?

Drivers

Rising Dermatology-Backed OTC Adoption in Developed Markets

One of the strongest growth drivers for the global Anti-Acne Products Market is the rising consumer trust in dermatologist-recommended OTC products, especially in North America and Europe. Brands like CeraVe, La Roche-Posay, and Differin are backed by clinical evidence and dermatology endorsements, which help bridge the gap between prescription-only treatments and consumer-available solutions.

The USA market demonstrates this shift clearly, where FDA-approved adapalene gels transitioned from prescription to OTC, immediately boosting consumer accessibility. This trend is expanding as dermatology clinics and online telehealth platforms increasingly recommend OTC topical creams, gels, and cleansers, giving consumers professional-grade assurance at affordable price points. The driver is particularly powerful in mature markets where health literacy and product transparency are high, supporting consistent long-term adoption.

Explosive Growth in Asia-Pacific Due to Beauty-Conscious Youth Demographics

Asia-Pacific, particularly China, India, and Japan, is driving incremental market expansion due to its vast youth population with rising disposable incomes and growing concern over skin health. India’s CAGR of 16.4% (2025-2035) and China’s 14.6% highlight the rapid uptake of anti-acne solutions, supported by beauty influencers, social media-driven awareness, and e-commerce penetration.

Unlike Western markets, where adult acne is a significant driver, the Asia-Pacific surge is youth-dominated, with teenagers and young adults seeking quick solutions such as spot patches, medicated cleansers, and affordable topical gels. Additionally, localized formulations with herbal actives like tea tree oil resonate strongly with cultural preferences. This regional driver ensures that Asia-Pacific outpaces global averages, contributing more than 35% of new revenue between 2025 and 2035.

Restraints

Growing Consumer Sensitivity and Product-Related Side Effects

A key restraint is the rising concern around irritation, dryness, and long-term side effects caused by common acne actives such as benzoyl peroxide and retinoids. Consumers with sensitive skin often experience redness, flaking, or post-inflammatory hyperpigmentation, discouraging continued use. This has led to negative reviews on digital platforms, reducing brand loyalty and raising product skepticism.

In Western Europe, for instance, nearly 22% of surveyed consumers reported discontinuing anti-acne formulations due to intolerance. As sensitive-skin claims and dermatologist-tested assurances grow in demand, traditional benzoyl peroxide-heavy formulations face scrutiny. Brands unable to adapt formulations for tolerability risk losing consumer trust, limiting category growth in mature, discerning markets.

Regulatory and Compliance Challenges Across Geographies

The fragmented regulatory frameworks across geographies act as another major restraint. While the USA FDA enforces stringent OTC monograph requirements for acne drugs, Europe often regulates them under cosmetic directives, and Asia-Pacific countries like China have additional import and safety testing requirements.

This lack of harmonization increases costs for multinational players and slows down product launches across borders. For instance, retinoid-based products face stricter approval timelines in Europe compared to the USA, delaying expansion strategies. Compliance with claims like “dermatologist-tested,” “clean-label,” and “vegan-certified” also varies widely, forcing companies to adapt product messaging per market, which raises costs and creates inconsistencies.

Key Trends

Shift Toward Multi-Functional and Preventive Anti-Acne Solutions

A major trend shaping the market is the consumer preference for multi-functional formulations that not only treat active acne but also prevent recurrence and address secondary concerns like acne scars, pigmentation, and hydration. For example, niacinamide has risen sharply in prominence due to its dual role in sebum regulation and barrier repair, while retinoids are used for both acne management and anti-aging.

This shift is visible in product innovations where a single cream may combine salicylic acid for exfoliation, niacinamide for calming, and hyaluronic acid for hydration. Preventive solutions targeting early signs of acne in teenagers and hormonal acne in adults are driving this multi-functional positioning, aligning with consumer demand for comprehensive skincare rather than one-dimensional treatments.

Digital-First Consumer Engagement and E-Commerce Acceleration

The global Anti-Acne Products Market is witnessing rapid digital transformation, with e-commerce platforms and teledermatology services reshaping distribution and engagement. Influencer-driven marketing on TikTok, Instagram, and YouTube has made niche brands like The Ordinary and Paula’s Choice household names, particularly among Gen Z. Subscription-based e-commerce models offering acne kits with cleansers, gels, and supplements are driving recurring revenue streams.

In China, platforms like Tmall and Douyin account for over 60% of skincare sales in certain categories, with acne products among the top searches. This trend is expanding globally, making digital-first engagement a critical growth engine, as consumers increasingly trust peer reviews, dermatologist influencers, and online-exclusive formulations over traditional retail recommendations.
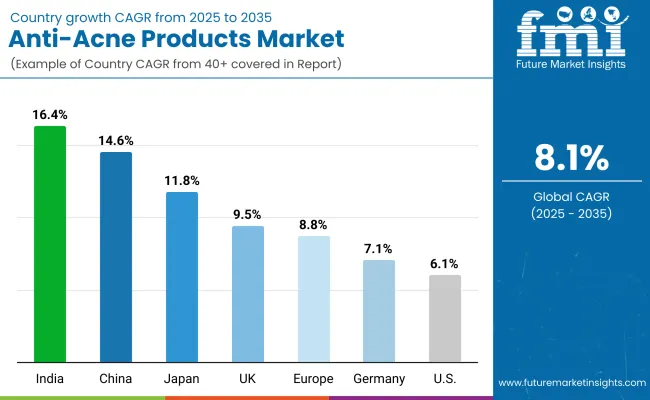
Analysis of Global Anti-Acne Products Market By Key Countries

Anti Acne Products Market By Country

Country Estimated CAGR (2025 to 2035)
China 14.6%
USA 6.1%
India 16.4%
UK 9.5%
Germany 7.1%
Japan 11.8%
Europe 8.8%

The global Anti-Acne Products Market shows distinct growth patterns across key geographies, with emerging economies in Asia-Pacific outpacing mature Western markets. India leads with an estimated CAGR of 16.4% from 2025 to 2035, reflecting rapid urbanization, a large youth demographic, and increasing disposable income.

Awareness campaigns driven by dermatologists, influencers, and expanding e-commerce penetration have further accelerated adoption in urban and semi-urban areas. China follows with a 14.6% CAGR, driven by a digitally savvy consumer base that actively engages with skincare products through platforms like Tmall and Douyin.

Clean-label and herbal-based anti-acne formulations resonate strongly in this market, where younger consumers are highly experimental and responsive to influencer-led recommendations. Japan, with a 11.8% CAGR, also represents a key growth hub, propelled by its beauty-conscious population and high trust in clinical-grade products that combine acne care with anti-aging benefits.

In contrast, growth in developed Western markets is comparatively moderate but stable, anchored by established OTC adoption and high consumer trust in dermatologist-backed brands. The USA is projected to expand at a 6.1% CAGR, supported by strong pharmacy and e-commerce channels, though rising competition from generic OTCs may cap acceleration.

The U.K. at 9.5% and Germany at 7.1% reflect the steady expansion of premium dermocosmetics, with European consumers increasingly drawn to sensitive-skin-safe and fragrance-free solutions. Broader Europe is expected to post an 8.8% CAGR, highlighting a balanced growth trajectory supported by both clinical dermatology and digital-first skincare adoption. Collectively, these trends underscore a two-speed market: rapid expansion in Asia-Pacific markets driven by youth demographics and digital adoption, and steady, premium-led growth in North America and Europe.
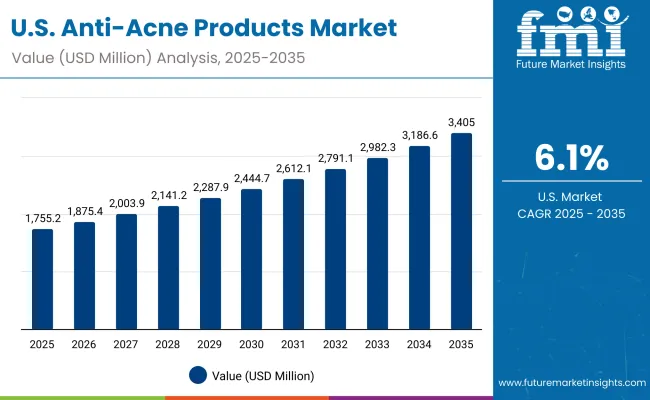
Sales Outlook for Anti-Acne Products in the United States

Usa Anti Acne Products Market

Year USA Anti-Acne Products Market (USD Million)
2025 1755.24
2026 1875.49
2027 2003.98
2028 2141.27
2029 2287.96
2030 2444.71
2031 2612.19
2032 2791.15
2033 2982.37
2034 3186.69
2035 3405.00

The Anti-Acne Products Market in the United States is projected to grow at a CAGR of 6.1%, led by steady demand across pharmacies, drugstores, and rapidly expanding e-commerce channels. Topical creams & gels account for more than one-third of sales, underpinned by dermatologist endorsements and OTC approvals such as adapalene gel.

The rise of teledermatology and digital pharmacy platforms is boosting accessibility and driving repeat purchases, particularly among young adults seeking affordable OTC options. The market is also benefiting from growing awareness of adult acne, with women in their 20s and 30s showing rising adoption of niacinamide- and retinoid-based products.

  • OTC approvals of retinoid-based formulations are expanding consumer access.
  • Pharmacy and e-commerce remain dominant distribution channels, supported by telehealth.
  • Adult acne, especially among women, is emerging as a key demand driver.

Growth and Expansion Outlook for Anti-Acne Products in the United Kingdom

The Anti-Acne Products Market in the United Kingdom is expected to grow at a CAGR of 9.5%, supported by strong adoption of dermocosmetic products and premium pharmacy-led sales. Brands such as La Roche-Posay and CeraVe have solidified their market presence through NHS dermatologist endorsements and pharmacy distribution partnerships.

Increasing demand for fragrance-free and sensitive-skin-safe claims has pushed formulators to innovate with niacinamide and salicylic acid blends. In addition, younger consumers in the U.K. are turning to e-commerce platforms for subscription-based spot treatments and acne patches.

  • Dermocosmetic brands are gaining share through strong pharmacy networks.
  • Sensitive-skin claims and fragrance-free labels drive product innovation.
  • Acne patches and digital-first subscriptions are popular among Gen Z consumers.

Growth and Expansion Outlook for Anti-Acne Products in India

India is witnessing rapid growth in the Anti-Acne Products Market, which is forecast to expand at a CAGR of 16.4% through 2035, the highest globally. Demand is rising sharply in tier-2 and tier-3 cities due to affordable OTC launches and awareness campaigns led by dermatologists and influencers.

Domestic companies are strengthening their portfolios with herbal and botanical blends such as neem and tea tree oil, which resonate strongly with local consumer preferences. The integration of acne products into mass retail chains, coupled with strong uptake on e-commerce platforms like Nykaa and Flipkart, is accelerating penetration.

  • Tier-2 and tier-3 cities are key growth drivers due to affordability and awareness.
  • Botanical actives such as neem and tea tree oil boost adoption among herbal-oriented consumers.
  • E-commerce platforms are expanding market access to youth-dominated segments.

Sales Outlook for Anti-Acne Products in China

The Anti-Acne Products Market in China is expected to grow at a CAGR of 14.6%, one of the fastest among major economies. Rising disposable incomes, a beauty-conscious youth demographic, and heavy reliance on e-commerce platforms like Tmall and Douyin are propelling growth.

Local brands are competitively priced, offering niacinamide- and salicylic acid-based formulations that appeal to Gen Z consumers. At the same time, dermocosmetic imports from Japan and Korea are popular among urban consumers seeking higher-end solutions. Social media influencers and key opinion leaders (KOLs) continue to play a critical role in driving awareness and trust.

  • E-commerce platforms dominate sales, with Douyin and Tmall leading adoption.
  • Local brands are capturing share with affordable formulations and fast innovation cycles.
  • Imported dermocosmetic products from Korea and Japan attract premium urban consumers.
Country 2025 Share (%)
USA 21.4%
China 10.9%
Japan 6.4%
Germany 14.1%
UK 7.4%
India 4.5%
Europe 20.2%
Country 2035 Share (%)
USA 19.0%
China 11.8%
Japan 7.7%
Germany 12.3%
UK 6.7%
India 5.4%
Europe 18.4%

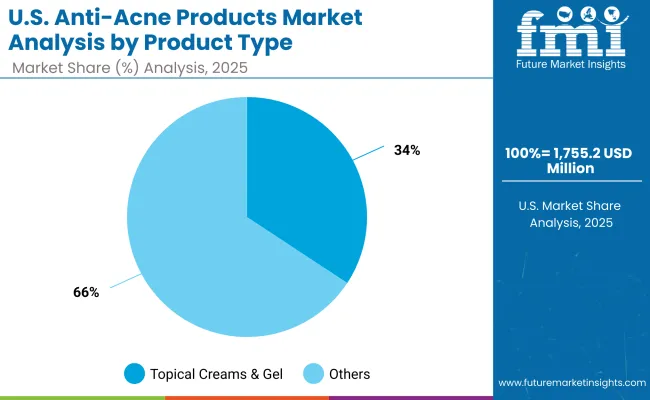
Growth Outlook for Anti-Acne Products Market in the USA

United States Anti Acne Products Market

USA By Product Type Value Share % 2025
Topical creams & gels 34.3%
Others 65.7%

The Anti-Acne Products Market in the United States is valued at USD 1,755.24 million in 2025 and is projected to expand steadily at a CAGR of 6.1% through 2035. Topical creams & gels dominate the market with a 34.3% share, reflecting their strong role as the first line of treatment for teenagers and adults.

This dominance is fueled by FDA-approved OTC products such as adapalene gel, which has transitioned from prescription-only to mass adoption. The USA market also reflects a maturing pattern where OTC and dermocosmetic products coexist, supported by growing demand for multi-functional formulations that address acne, scars, and pigmentation simultaneously.

E-commerce channels and teledermatology platforms are shaping consumer access, while pharmacies and drugstores remain critical for over-the-counter purchases. The adult acne segment, especially among women in their 20s and 30s, is growing faster than the teen category, driven by hormonal changes and lifestyle stressors. As brands integrate niacinamide, retinoids, and benzoyl peroxide into innovative formulations, the USA market demonstrates strong potential for hybrid OTC-digital care ecosystems.
  • The USA Anti-Acne Products Market accounts for 21.4% of the global market in 2025.
  • Topical creams & gels hold a 34.3% share of product type sales.
  • Growth is supported by teledermatology, adult acne adoption, and FDA-approved OTC formulations.

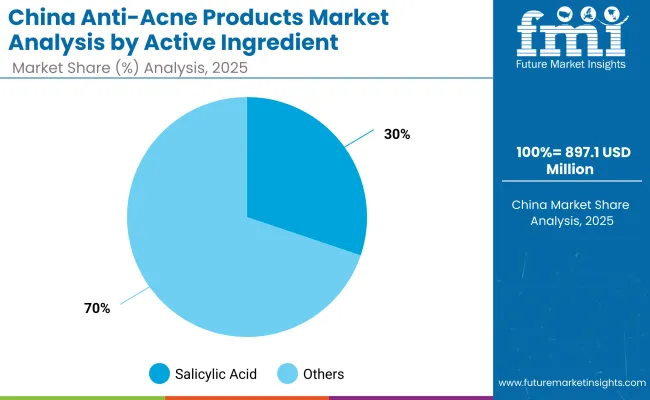
Opportunity Analysis of China Anti-Acne Products Market

China Anti Acne Products Market

China By Source Value Share % 2025
Salicylic acid 30.2%
Others 69.8%

The Anti-Acne Products Market in China is valued at nearly USD 897.12 million in 2025, with salicylic acid-based products contributing 30.2% of revenue. The Chinese market is forecasted to grow at a CAGR of 14.6%, among the highest globally, driven by rising disposable income, rapid e-commerce penetration, and beauty-conscious Gen Z and millennial consumers. Salicylic acid continues to dominate as a trusted exfoliating and pore-clearing ingredient, but niacinamide and tea tree oil-based formulations are seeing rapid growth due to demand for gentler, clean-label alternatives.

China’s digital-first beauty ecosystem is a defining factor, with platforms such as Tmall and Douyin capturing the majority of sales. Local players are disrupting the market with affordable yet effective products, while international dermocosmetic brands from Korea, Japan, and Europe target the premium segment. Influencer and KOL (Key Opinion Leader) engagement plays a crucial role in brand awareness, while social commerce accelerates adoption in tier-2 and tier-3 cities.
  • The Chinese Anti-Acne Products Market holds 10.9% of the global share in 2025.
  • Salicylic acid-based products lead at 30.2% of active ingredient sales.
  • Growth is supported by e-commerce dominance, KOL-driven influence, and rising premium imports.

Competitive Landscape of the Global Anti-Acne Products Market

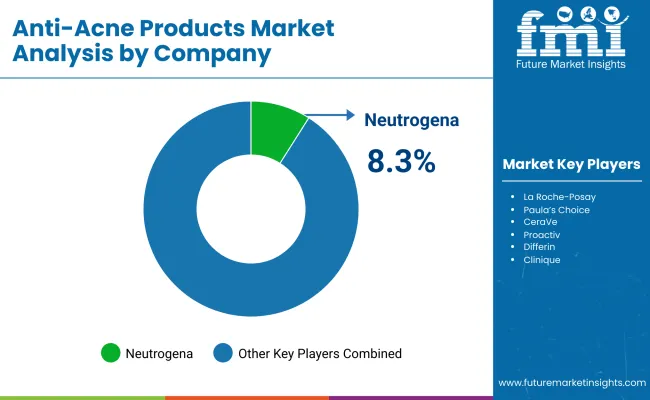
Anti Acne Products Market By Company

Company Global Value Share 2025
Neutrogena 8.3%
Others 91.7%

The global Anti-Acne Products Market is moderately consolidated, with a few multinational leaders dominating while mid-sized and niche players capture growth in specialized categories. Neutrogena leads with an 8.3% share in 2025, supported by its broad OTC portfolio distributed across pharmacies, supermarkets, and e-commerce platforms worldwide.

Other global leaders, including La Roche-Posay, CeraVe, and Paula’s Choice, focus on dermatologist-tested formulations, sensitive-skin claims, and clean-label positioning that resonate strongly in North America and Europe. Their strategies emphasize clinical validation, broad retail availability, and omni-channel marketing. Mid-sized brands such as The Ordinary, Murad, and Proactiv cater to niche segments like minimal-ingredient formulations, premium subscription kits, and targeted adult acne solutions.

They differentiate through influencer engagement, digital-first campaigns, and recurring D2C models. Mass-market players like Clean & Clear and Differin remain popular in the teen segment, leveraging affordability and strong retail footprints. Clinique positions itself as a premium dermocosmetic option, appealing to consumers seeking hybrid anti-acne and skincare benefits.

Competitive differentiation is shifting away from single-ingredient hero products toward ecosystem-driven solutions that combine multi-functional actives, subscription models, teledermatology integration, and consumer trust built on safety claims. With rising demand from Asia-Pacific, companies are increasingly localizing portfolios with herbal actives and region-specific claims to capture the high-growth youth segment.

Key Developments in Global Anti-Acne Products Market

  • On February 7, 2024, Neutrogena partnered with Nourished to launch 3D-printed personalized skin supplements targeting acne-prone consumers. The collaboration aimed to combine topical regimens with ingestible solutions for holistic acne management.
  • On May 14, 2024, La Roche-Posay expanded its Effaclar line with AI-powered skin analysis tools in European pharmacies, enabling dermatologists and consumers to identify acne severity and customize treatment kits on-site.

Scope of the Report

Item Value
Quantitative Units USD Million
Product Type Topical creams & gels, Medicated cleansers & face washes, Spot treatments & patches, Oral supplements (OTC)
Active Ingredient Salicylic acid, Benzoyl peroxide, Niacinamide , Retinoids , Tea tree oil
Skin Type Oily/acne-prone, Combination, Sensitive, Dry
Channel Pharmacies & drugstores, E-commerce, Dermatology clinics, Mass retail/supermarkets
End User Teens, Adults, Men, Women
Regions Covered North America, Europe, East Asia, South Asia & Pacific, Latin America, Middle East & Africa
Country Covered United States, Canada, Germany, France, United Kingdom, China, Japan, India, Brazil, South Africa
Key Companies Profiled Neutrogena, La Roche- Posay , Paula’s Choice, CeraVe , Proactiv , Murad, The Ordinary, Clean & Clear, Differin , Clinique
Additional Attributes Dollar sales by product type, active ingredient, skin type, and channel; adoption trends in OTC and dermocosmetics ; rising demand for e-commerce, subscription kits, and acne patches; sector-specific growth among teens and adult acne segments; ingredient-level revenue segmentation; integration of AI/ teledermatology with skincare; regional trends influenced by digital-first consumer adoption; and innovations in salicylic acid delivery, niacinamide -based formulations, and botanical actives.

Key Segments

By Product Type:

  • Topical creams & gels
  • Medicated cleansers & face washes
  • Spot treatments & patches
  • Oral supplements (OTC)

By Active Ingredient:

  • Salicylic acid
  • Benzoyl peroxide
  • Niacinamide
  • Retinoids
  • Tea tree oil

By Channel:

  • E-commerce
  • Pharmacies & drugstores
  • Mass retail/supermarkets
  • Dermatology clinics

By Skin Type:

  • Oily/acne-prone
  • Combination
  • Sensitive
  • Dry

By End User:

  • Teens
  • Adults
  • Men
  • Women

By Region:

  • North America
  • Latin America
  • Europe
  • East Asia
  • South Asia & Pacific
  • Middle East and Africa

Table of Content

  1. Executive Summary
    • Global Market Outlook
    • Demand-side Trends
    • Supply-side Trends
    • Technology Roadmap Analysis
    • Analysis and Recommendations
  2. Market Overview
    • Market Coverage / Taxonomy
    • Market Definition / Scope / Limitations
  3. Market Background
    • Market Dynamics
      • Drivers
      • Restraints
      • Opportunity
      • Trends
    • Scenario Forecast
      • Demand in Optimistic Scenario
      • Demand in Likely Scenario
      • Demand in Conservative Scenario
    • Opportunity Map Analysis
    • Product Life Cycle Analysis
    • Supply Chain Analysis
      • Supply Side Participants and their Roles
        • Producers
        • Mid-Level Participants (Traders/ Agents/ Brokers)
        • Wholesalers and Distributors
      • Value Added and Value Created at Node in the Supply Chain
      • List of Raw Material Suppliers
      • List of Existing and Potential Buyer’s
    • Investment Feasibility Matrix
    • Value Chain Analysis
      • Profit Margin Analysis
      • Wholesalers and Distributors
      • Retailers
    • PESTLE and Porter’s Analysis
    • Regulatory Landscape
      • By Key Regions
      • By Key Countries
    • Regional Parent Market Outlook
    • Production and Consumption Statistics
    • Import and Export Statistics
  4. Global Market Analysis 2020 to 2024 and Forecast, 2025 to 2035
    • Historical Market Size Value (USD Million) & Volume (Units) Analysis, 2020 to 2024
    • Current and Future Market Size Value (USD Million) & Volume (Units) Projections, 2025 to 2035
      • Y-o-Y Growth Trend Analysis
      • Absolute $ Opportunity Analysis
  5. Global Market Analysis 2020 to 2024 and Forecast 2025 to 2035, By Product Type
    • Introduction / Key Findings
    • Historical Market Size Value (USD Million) & Volume (Units) Analysis By Product Type, 2020 to 2024
    • Current and Future Market Size Value (USD Million) & Volume (Units) Analysis and Forecast By Product Type, 2025 to 2035
      • Topical creams & gels
      • Medicated cleansers & face washes
      • Spot treatments & patches
      • Oral supplements (OTC)
    • Y-o-Y Growth Trend Analysis By Product Type, 2020 to 2024
    • Absolute $ Opportunity Analysis By Product Type, 2025 to 2035
  6. Global Market Analysis 2020 to 2024 and Forecast 2025 to 2035, By Active Ingredient
    • Introduction / Key Findings
    • Historical Market Size Value (USD Million) & Volume (Units) Analysis By Active Ingredient, 2020 to 2024
    • Current and Future Market Size Value (USD Million) & Volume (Units) Analysis and Forecast By Active Ingredient, 2025 to 2035
      • Salicylic acid
      • Benzoyl peroxide
      • Niacinamide
      • Retinoids
      • Tea tree oil
    • Y-o-Y Growth Trend Analysis By Active Ingredient, 2020 to 2024
    • Absolute $ Opportunity Analysis By Active Ingredient, 2025 to 2035
  7. Global Market Analysis 2020 to 2024 and Forecast 2025 to 2035, By Channel
    • Introduction / Key Findings
    • Historical Market Size Value (USD Million) & Volume (Units) Analysis By Channel, 2020 to 2024
    • Current and Future Market Size Value (USD Million) & Volume (Units) Analysis and Forecast By Channel, 2025 to 2035
      • E-commerce
      • Pharmacies & drugstores
      • Mass retail/supermarkets
      • Dermatology clinics
    • Y-o-Y Growth Trend Analysis By Channel, 2020 to 2024
    • Absolute $ Opportunity Analysis By Channel, 2025 to 2035
  8. Global Market Analysis 2020 to 2024 and Forecast 2025 to 2035, By Skin Type
    • Introduction / Key Findings
    • Historical Market Size Value (USD Million) & Volume (Units) Analysis By Skin Type, 2020 to 2024
    • Current and Future Market Size Value (USD Million) & Volume (Units) Analysis and Forecast By Skin Type, 2025 to 2035
      • Oily/acne-prone
      • Combination
      • Sensitive
      • Dry
    • Y-o-Y Growth Trend Analysis By Skin Type, 2020 to 2024
    • Absolute $ Opportunity Analysis By Skin Type, 2025 to 2035
  9. Global Market Analysis 2020 to 2024 and Forecast 2025 to 2035, By End User
    • Introduction / Key Findings
    • Historical Market Size Value (USD Million) & Volume (Units) Analysis By End User, 2020 to 2024
    • Current and Future Market Size Value (USD Million) & Volume (Units) Analysis and Forecast By End User, 2025 to 2035
      • Teens
      • Adults
      • Men
      • Women
    • Y-o-Y Growth Trend Analysis By End User, 2020 to 2024
    • Absolute $ Opportunity Analysis By End User, 2025 to 2035
  10. Global Market Analysis 2020 to 2024 and Forecast 2025 to 2035, By Region
    • Introduction
    • Historical Market Size Value (USD Million) & Volume (Units) Analysis By Region, 2020 to 2024
    • Current Market Size Value (USD Million) & Volume (Units) Analysis and Forecast By Region, 2025 to 2035
      • North America
      • Latin America
      • Europe
      • East Asia
      • South Asia & Pacific
      • Middle East and Africa
    • Market Attractiveness Analysis By Region
  11. North America Market Analysis 2020 to 2024 and Forecast 2025 to 2035, By Country
    • Historical Market Size Value (USD Million) & Volume (Units) Trend Analysis By Market Taxonomy, 2020 to 2024
    • Market Size Value (USD Million) & Volume (Units) Forecast By Market Taxonomy, 2025 to 2035
      • By Country
        • USA
        • Canada
      • By Product Type
      • By Active Ingredient
      • By Channel
      • By Skin Type
      • By End User
    • Market Attractiveness Analysis
      • By Country
      • By Product Type
      • By Active Ingredient
      • By Channel
      • By Skin Type
      • By End User
    • Key Takeaways
  12. Latin America Market Analysis 2020 to 2024 and Forecast 2025 to 2035, By Country
    • Historical Market Size Value (USD Million) & Volume (Units) Trend Analysis By Market Taxonomy, 2020 to 2024
    • Market Size Value (USD Million) & Volume (Units) Forecast By Market Taxonomy, 2025 to 2035
      • By Country
        • Brazil
        • Mexico
        • Colombia
        • Rest of Latin America
      • By Product Type
      • By Active Ingredient
      • By Channel
      • By Skin Type
      • By End User
    • Market Attractiveness Analysis
      • By Country
      • By Product Type
      • By Active Ingredient
      • By Channel
      • By Skin Type
      • By End User
    • Key Takeaways
  13. Europe Market Analysis 2020 to 2024 and Forecast 2025 to 2035, By Country
    • Historical Market Size Value (USD Million) & Volume (Units) Trend Analysis By Market Taxonomy, 2020 to 2024
    • Market Size Value (USD Million) & Volume (Units) Forecast By Market Taxonomy, 2025 to 2035
      • By Country
        • Germany
        • UK
        • France
        • Italy
        • Spain
        • Belgium
        • Netherlands
        • Nordic
        • Switzerland
        • Russia
        • Poland
        • Rest of Europe
      • By Product Type
      • By Active Ingredient
      • By Channel
      • By Skin Type
      • By End User
    • Market Attractiveness Analysis
      • By Country
      • By Product Type
      • By Active Ingredient
      • By Channel
      • By Skin Type
      • By End User
    • Key Takeaways
  14. East Asia Market Analysis 2020 to 2024 and Forecast 2025 to 2035, By Country
    • Historical Market Size Value (USD Million) & Volume (Units) Trend Analysis By Market Taxonomy, 2020 to 2024
    • Market Size Value (USD Million) & Volume (Units) Forecast By Market Taxonomy, 2025 to 2035
      • By Country
        • China
        • Japan
        • South Korea
      • By Product Type
      • By Active Ingredient
      • By Channel
      • By Skin Type
      • By End User
    • Market Attractiveness Analysis
      • By Country
      • By Product Type
      • By Active Ingredient
      • By Channel
      • By Skin Type
      • By End User
    • Key Takeaways
  15. South Asia & Pacific Market Analysis 2020 to 2024 and Forecast 2025 to 2035, By Country
    • Historical Market Size Value (USD Million) & Volume (Units) Trend Analysis By Market Taxonomy, 2020 to 2024
    • Market Size Value (USD Million) & Volume (Units) Forecast By Market Taxonomy, 2025 to 2035
      • By Country
        • India
        • Thailand
        • Malaysia
        • Indonesia
        • Singapore
        • Vietnam
        • Australia
        • New Zealand
        • Rest of South Asia
      • By Product Type
      • By Active Ingredient
      • By Channel
      • By Skin Type
      • By End User
    • Market Attractiveness Analysis
      • By Country
      • By Product Type
      • By Active Ingredient
      • By Channel
      • By Skin Type
      • By End User
    • Key Takeaways
  16. Middle East and Africa Market Analysis 2020 to 2024 and Forecast 2025 to 2035, By Country
    • Historical Market Size Value (USD Million) & Volume (Units) Trend Analysis By Market Taxonomy, 2020 to 2024
    • Market Size Value (USD Million) & Volume (Units) Forecast By Market Taxonomy, 2025 to 2035
      • By Country
        • Turkey
        • UAE
        • Saudi Arabia
        • Israel
        • Other GCC Countries
        • North Africa
        • South Africa
      • By Product Type
      • By Active Ingredient
      • By Channel
      • By Skin Type
      • By End User
    • Market Attractiveness Analysis
      • By Country
      • By Product Type
      • By Active Ingredient
      • By Channel
      • By Skin Type
      • By End User
    • Key Takeaways
  17. Key Countries Market Analysis
    • USA
      • Pricing Analysis
      • Market Share Analysis, 2024
        • By Product Type
        • By Active Ingredient
        • By Channel
        • By Skin Type
        • By End User
    • Canada
      • Pricing Analysis
      • Market Share Analysis, 2024
        • By Product Type
        • By Active Ingredient
        • By Channel
        • By Skin Type
        • By End User
    • Brazil
      • Pricing Analysis
      • Market Share Analysis, 2024
        • By Product Type
        • By Active Ingredient
        • By Channel
        • By Skin Type
        • By End User
    • Mexico
      • Pricing Analysis
      • Market Share Analysis, 2024
        • By Product Type
        • By Active Ingredient
        • By Channel
        • By Skin Type
        • By End User
    • Colombia
      • Pricing Analysis
      • Market Share Analysis, 2024
        • By Product Type
        • By Active Ingredient
        • By Channel
        • By Skin Type
        • By End User
    • Germany
      • Pricing Analysis
      • Market Share Analysis, 2024
        • By Product Type
        • By Active Ingredient
        • By Channel
        • By Skin Type
        • By End User
    • UK
      • Pricing Analysis
      • Market Share Analysis, 2024
        • By Product Type
        • By Active Ingredient
        • By Channel
        • By Skin Type
        • By End User
    • France
      • Pricing Analysis
      • Market Share Analysis, 2024
        • By Product Type
        • By Active Ingredient
        • By Channel
        • By Skin Type
        • By End User
    • Italy
      • Pricing Analysis
      • Market Share Analysis, 2024
        • By Product Type
        • By Active Ingredient
        • By Channel
        • By Skin Type
        • By End User
    • Spain
      • Pricing Analysis
      • Market Share Analysis, 2024
        • By Product Type
        • By Active Ingredient
        • By Channel
        • By Skin Type
        • By End User
    • Belgium
      • Pricing Analysis
      • Market Share Analysis, 2024
        • By Product Type
        • By Active Ingredient
        • By Channel
        • By Skin Type
        • By End User
    • Netherlands
      • Pricing Analysis
      • Market Share Analysis, 2024
        • By Product Type
        • By Active Ingredient
        • By Channel
        • By Skin Type
        • By End User
    • Nordic
      • Pricing Analysis
      • Market Share Analysis, 2024
        • By Product Type
        • By Active Ingredient
        • By Channel
        • By Skin Type
        • By End User
    • Switzerland
      • Pricing Analysis
      • Market Share Analysis, 2024
        • By Product Type
        • By Active Ingredient
        • By Channel
        • By Skin Type
        • By End User
    • Russia
      • Pricing Analysis
      • Market Share Analysis, 2024
        • By Product Type
        • By Active Ingredient
        • By Channel
        • By Skin Type
        • By End User
    • Poland
      • Pricing Analysis
      • Market Share Analysis, 2024
        • By Product Type
        • By Active Ingredient
        • By Channel
        • By Skin Type
        • By End User
    • China
      • Pricing Analysis
      • Market Share Analysis, 2024
        • By Product Type
        • By Active Ingredient
        • By Channel
        • By Skin Type
        • By End User
    • Japan
      • Pricing Analysis
      • Market Share Analysis, 2024
        • By Product Type
        • By Active Ingredient
        • By Channel
        • By Skin Type
        • By End User
    • South Korea
      • Pricing Analysis
      • Market Share Analysis, 2024
        • By Product Type
        • By Active Ingredient
        • By Channel
        • By Skin Type
        • By End User
    • India
      • Pricing Analysis
      • Market Share Analysis, 2024
        • By Product Type
        • By Active Ingredient
        • By Channel
        • By Skin Type
        • By End User
    • Thailand
      • Pricing Analysis
      • Market Share Analysis, 2024
        • By Product Type
        • By Active Ingredient
        • By Channel
        • By Skin Type
        • By End User
    • Indonesia
      • Pricing Analysis
      • Market Share Analysis, 2024
        • By Product Type
        • By Active Ingredient
        • By Channel
        • By Skin Type
        • By End User
    • Australia
      • Pricing Analysis
      • Market Share Analysis, 2024
        • By Product Type
        • By Active Ingredient
        • By Channel
        • By Skin Type
        • By End User
    • New Zealand
      • Pricing Analysis
      • Market Share Analysis, 2024
        • By Product Type
        • By Active Ingredient
        • By Channel
        • By Skin Type
        • By End User
    • Turkey
      • Pricing Analysis
      • Market Share Analysis, 2024
        • By Product Type
        • By Active Ingredient
        • By Channel
        • By Skin Type
        • By End User
    • UAE
      • Pricing Analysis
      • Market Share Analysis, 2024
        • By Product Type
        • By Active Ingredient
        • By Channel
        • By Skin Type
        • By End User
    • Saudi Arabia
      • Pricing Analysis
      • Market Share Analysis, 2024
        • By Product Type
        • By Active Ingredient
        • By Channel
        • By Skin Type
        • By End User
    • Israel
      • Pricing Analysis
      • Market Share Analysis, 2024
        • By Product Type
        • By Active Ingredient
        • By Channel
        • By Skin Type
        • By End User
    • North Africa
      • Pricing Analysis
      • Market Share Analysis, 2024
        • By Product Type
        • By Active Ingredient
        • By Channel
        • By Skin Type
        • By End User
    • South Africa
      • Pricing Analysis
      • Market Share Analysis, 2024
        • By Product Type
        • By Active Ingredient
        • By Channel
        • By Skin Type
        • By End User
  18. Market Structure Analysis
    • Competition Dashboard
    • Competition Benchmarking
    • Market Share Analysis of Top Players
      • By Regional
      • By Product Type
      • By Active Ingredient
      • By Channel
      • By Skin Type
      • By End User
  19. Competition Analysis
    • Competition Deep Dive
      • Neutrogena
        • Overview
        • Product Portfolio
        • Profitability by Market Segments (Product/Age /Sales Channel/Region)
        • Sales Footprint
        • Strategy Overview
          • Marketing Strategy
          • Product Strategy
          • Channel Strategy
      • La Roche-Posay
        • Overview
        • Product Portfolio
        • Profitability by Market Segments (Product/Age /Sales Channel/Region)
        • Sales Footprint
        • Strategy Overview
          • Marketing Strategy
          • Product Strategy
          • Channel Strategy
      • Paula’s Choice
        • Overview
        • Product Portfolio
        • Profitability by Market Segments (Product/Age /Sales Channel/Region)
        • Sales Footprint
        • Strategy Overview
          • Marketing Strategy
          • Product Strategy
          • Channel Strategy
      • CeraVe
        • Overview
        • Product Portfolio
        • Profitability by Market Segments (Product/Age /Sales Channel/Region)
        • Sales Footprint
        • Strategy Overview
          • Marketing Strategy
          • Product Strategy
          • Channel Strategy
      • Proactiv
        • Overview
        • Product Portfolio
        • Profitability by Market Segments (Product/Age /Sales Channel/Region)
        • Sales Footprint
        • Strategy Overview
          • Marketing Strategy
          • Product Strategy
          • Channel Strategy
      • Murad
        • Overview
        • Product Portfolio
        • Profitability by Market Segments (Product/Age /Sales Channel/Region)
        • Sales Footprint
        • Strategy Overview
          • Marketing Strategy
          • Product Strategy
          • Channel Strategy
      • The Ordinary
        • Overview
        • Product Portfolio
        • Profitability by Market Segments (Product/Age /Sales Channel/Region)
        • Sales Footprint
        • Strategy Overview
          • Marketing Strategy
          • Product Strategy
          • Channel Strategy
      • Clean & Clear
        • Overview
        • Product Portfolio
        • Profitability by Market Segments (Product/Age /Sales Channel/Region)
        • Sales Footprint
        • Strategy Overview
          • Marketing Strategy
          • Product Strategy
          • Channel Strategy
      • Differin
        • Overview
        • Product Portfolio
        • Profitability by Market Segments (Product/Age /Sales Channel/Region)
        • Sales Footprint
        • Strategy Overview
          • Marketing Strategy
          • Product Strategy
          • Channel Strategy
      • Clinique
        • Overview
        • Product Portfolio
        • Profitability by Market Segments (Product/Age /Sales Channel/Region)
        • Sales Footprint
        • Strategy Overview
          • Marketing Strategy
          • Product Strategy
          • Channel Strategy
  20. Assumptions & Acronyms Used
  21. Research Methodology

List of Tables

  • Table 1: Global Market Value (USD Million) Forecast by Region, 2020-2035
  • Table 2: Global Market Volume (Units) Forecast by Region, 2020-2035
  • Table 3: Global Market Value (USD Million) Forecast by Product Type, 2020-2035
  • Table 4: Global Market Volume (Units) Forecast by Product Type, 2020-2035
  • Table 5: Global Market Value (USD Million) Forecast by Active Ingredient, 2020-2035
  • Table 6: Global Market Volume (Units) Forecast by Active Ingredient, 2020-2035
  • Table 7: Global Market Value (USD Million) Forecast by Channel, 2020-2035
  • Table 8: Global Market Volume (Units) Forecast by Channel, 2020-2035
  • Table 9: Global Market Value (USD Million) Forecast by Skin Type, 2020-2035
  • Table 10: Global Market Volume (Units) Forecast by Skin Type, 2020-2035
  • Table 11: Global Market Value (USD Million) Forecast by End User, 2020-2035
  • Table 12: Global Market Volume (Units) Forecast by End User, 2020-2035
  • Table 13: North America Market Value (USD Million) Forecast by Country, 2020-2035
  • Table 14: North America Market Volume (Units) Forecast by Country, 2020-2035
  • Table 15: North America Market Value (USD Million) Forecast by Product Type, 2020-2035
  • Table 16: North America Market Volume (Units) Forecast by Product Type, 2020-2035
  • Table 17: North America Market Value (USD Million) Forecast by Active Ingredient, 2020-2035
  • Table 18: North America Market Volume (Units) Forecast by Active Ingredient, 2020-2035
  • Table 19: North America Market Value (USD Million) Forecast by Channel, 2020-2035
  • Table 20: North America Market Volume (Units) Forecast by Channel, 2020-2035
  • Table 21: North America Market Value (USD Million) Forecast by Skin Type, 2020-2035
  • Table 22: North America Market Volume (Units) Forecast by Skin Type, 2020-2035
  • Table 23: North America Market Value (USD Million) Forecast by End User, 2020-2035
  • Table 24: North America Market Volume (Units) Forecast by End User, 2020-2035
  • Table 25: Latin America Market Value (USD Million) Forecast by Country, 2020-2035
  • Table 26: Latin America Market Volume (Units) Forecast by Country, 2020-2035
  • Table 27: Latin America Market Value (USD Million) Forecast by Product Type, 2020-2035
  • Table 28: Latin America Market Volume (Units) Forecast by Product Type, 2020-2035
  • Table 29: Latin America Market Value (USD Million) Forecast by Active Ingredient, 2020-2035
  • Table 30: Latin America Market Volume (Units) Forecast by Active Ingredient, 2020-2035
  • Table 31: Latin America Market Value (USD Million) Forecast by Channel, 2020-2035
  • Table 32: Latin America Market Volume (Units) Forecast by Channel, 2020-2035
  • Table 33: Latin America Market Value (USD Million) Forecast by Skin Type, 2020-2035
  • Table 34: Latin America Market Volume (Units) Forecast by Skin Type, 2020-2035
  • Table 35: Latin America Market Value (USD Million) Forecast by End User, 2020-2035
  • Table 36: Latin America Market Volume (Units) Forecast by End User, 2020-2035
  • Table 37: Europe Market Value (USD Million) Forecast by Country, 2020-2035
  • Table 38: Europe Market Volume (Units) Forecast by Country, 2020-2035
  • Table 39: Europe Market Value (USD Million) Forecast by Product Type, 2020-2035
  • Table 40: Europe Market Volume (Units) Forecast by Product Type, 2020-2035
  • Table 41: Europe Market Value (USD Million) Forecast by Active Ingredient, 2020-2035
  • Table 42: Europe Market Volume (Units) Forecast by Active Ingredient, 2020-2035
  • Table 43: Europe Market Value (USD Million) Forecast by Channel, 2020-2035
  • Table 44: Europe Market Volume (Units) Forecast by Channel, 2020-2035
  • Table 45: Europe Market Value (USD Million) Forecast by Skin Type, 2020-2035
  • Table 46: Europe Market Volume (Units) Forecast by Skin Type, 2020-2035
  • Table 47: Europe Market Value (USD Million) Forecast by End User, 2020-2035
  • Table 48: Europe Market Volume (Units) Forecast by End User, 2020-2035
  • Table 49: East Asia Market Value (USD Million) Forecast by Country, 2020-2035
  • Table 50: East Asia Market Volume (Units) Forecast by Country, 2020-2035
  • Table 51: East Asia Market Value (USD Million) Forecast by Product Type, 2020-2035
  • Table 52: East Asia Market Volume (Units) Forecast by Product Type, 2020-2035
  • Table 53: East Asia Market Value (USD Million) Forecast by Active Ingredient, 2020-2035
  • Table 54: East Asia Market Volume (Units) Forecast by Active Ingredient, 2020-2035
  • Table 55: East Asia Market Value (USD Million) Forecast by Channel, 2020-2035
  • Table 56: East Asia Market Volume (Units) Forecast by Channel, 2020-2035
  • Table 57: East Asia Market Value (USD Million) Forecast by Skin Type, 2020-2035
  • Table 58: East Asia Market Volume (Units) Forecast by Skin Type, 2020-2035
  • Table 59: East Asia Market Value (USD Million) Forecast by End User, 2020-2035
  • Table 60: East Asia Market Volume (Units) Forecast by End User, 2020-2035
  • Table 61: South Asia & Pacific Market Value (USD Million) Forecast by Country, 2020-2035
  • Table 62: South Asia & Pacific Market Volume (Units) Forecast by Country, 2020-2035
  • Table 63: South Asia & Pacific Market Value (USD Million) Forecast by Product Type, 2020-2035
  • Table 64: South Asia & Pacific Market Volume (Units) Forecast by Product Type, 2020-2035
  • Table 65: South Asia & Pacific Market Value (USD Million) Forecast by Active Ingredient, 2020-2035
  • Table 66: South Asia & Pacific Market Volume (Units) Forecast by Active Ingredient, 2020-2035
  • Table 67: South Asia & Pacific Market Value (USD Million) Forecast by Channel, 2020-2035
  • Table 68: South Asia & Pacific Market Volume (Units) Forecast by Channel, 2020-2035
  • Table 69: South Asia & Pacific Market Value (USD Million) Forecast by Skin Type, 2020-2035
  • Table 70: South Asia & Pacific Market Volume (Units) Forecast by Skin Type, 2020-2035
  • Table 71: South Asia & Pacific Market Value (USD Million) Forecast by End User, 2020-2035
  • Table 72: South Asia & Pacific Market Volume (Units) Forecast by End User, 2020-2035
  • Table 73: Middle East and Africa Market Value (USD Million) Forecast by Country, 2020-2035
  • Table 74: Middle East and Africa Market Volume (Units) Forecast by Country, 2020-2035
  • Table 75: Middle East and Africa Market Value (USD Million) Forecast by Product Type, 2020-2035
  • Table 76: Middle East and Africa Market Volume (Units) Forecast by Product Type, 2020-2035
  • Table 77: Middle East and Africa Market Value (USD Million) Forecast by Active Ingredient, 2020-2035
  • Table 78: Middle East and Africa Market Volume (Units) Forecast by Active Ingredient, 2020-2035
  • Table 79: Middle East and Africa Market Value (USD Million) Forecast by Channel, 2020-2035
  • Table 80: Middle East and Africa Market Volume (Units) Forecast by Channel, 2020-2035
  • Table 81: Middle East and Africa Market Value (USD Million) Forecast by Skin Type, 2020-2035
  • Table 82: Middle East and Africa Market Volume (Units) Forecast by Skin Type, 2020-2035
  • Table 83: Middle East and Africa Market Value (USD Million) Forecast by End User, 2020-2035
  • Table 84: Middle East and Africa Market Volume (Units) Forecast by End User, 2020-2035

List of Figures

  • Figure 1: Global Market Value (USD Million) by Product Type, 2025-2035
  • Figure 2: Global Market Value (USD Million) by Active Ingredient, 2025-2035
  • Figure 3: Global Market Value (USD Million) by Channel, 2025-2035
  • Figure 4: Global Market Value (USD Million) by Skin Type, 2025-2035
  • Figure 5: Global Market Value (USD Million) by End User, 2025-2035
  • Figure 6: Global Market Value (USD Million) by Region, 2025-2035
  • Figure 7: Global Market Value (USD Million) Analysis by Region, 2020-2035
  • Figure 8: Global Market Volume (Units) Analysis by Region, 2020-2035
  • Figure 9: Global Market Value Share (%) and BPS Analysis by Region, 2025-2035
  • Figure 10: Global Market Y-o-Y Growth (%) Projections by Region, 2025-2035
  • Figure 11: Global Market Value (USD Million) Analysis by Product Type, 2020-2035
  • Figure 12: Global Market Volume (Units) Analysis by Product Type, 2020-2035
  • Figure 13: Global Market Value Share (%) and BPS Analysis by Product Type, 2025-2035
  • Figure 14: Global Market Y-o-Y Growth (%) Projections by Product Type, 2025-2035
  • Figure 15: Global Market Value (USD Million) Analysis by Active Ingredient, 2020-2035
  • Figure 16: Global Market Volume (Units) Analysis by Active Ingredient, 2020-2035
  • Figure 17: Global Market Value Share (%) and BPS Analysis by Active Ingredient, 2025-2035
  • Figure 18: Global Market Y-o-Y Growth (%) Projections by Active Ingredient, 2025-2035
  • Figure 19: Global Market Value (USD Million) Analysis by Channel, 2020-2035
  • Figure 20: Global Market Volume (Units) Analysis by Channel, 2020-2035
  • Figure 21: Global Market Value Share (%) and BPS Analysis by Channel, 2025-2035
  • Figure 22: Global Market Y-o-Y Growth (%) Projections by Channel, 2025-2035
  • Figure 23: Global Market Value (USD Million) Analysis by Skin Type, 2020-2035
  • Figure 24: Global Market Volume (Units) Analysis by Skin Type, 2020-2035
  • Figure 25: Global Market Value Share (%) and BPS Analysis by Skin Type, 2025-2035
  • Figure 26: Global Market Y-o-Y Growth (%) Projections by Skin Type, 2025-2035
  • Figure 27: Global Market Value (USD Million) Analysis by End User, 2020-2035
  • Figure 28: Global Market Volume (Units) Analysis by End User, 2020-2035
  • Figure 29: Global Market Value Share (%) and BPS Analysis by End User, 2025-2035
  • Figure 30: Global Market Y-o-Y Growth (%) Projections by End User, 2025-2035
  • Figure 31: Global Market Attractiveness by Product Type, 2025-2035
  • Figure 32: Global Market Attractiveness by Active Ingredient, 2025-2035
  • Figure 33: Global Market Attractiveness by Channel, 2025-2035
  • Figure 34: Global Market Attractiveness by Skin Type, 2025-2035
  • Figure 35: Global Market Attractiveness by End User, 2025-2035
  • Figure 36: Global Market Attractiveness by Region, 2025-2035
  • Figure 37: North America Market Value (USD Million) by Product Type, 2025-2035
  • Figure 38: North America Market Value (USD Million) by Active Ingredient, 2025-2035
  • Figure 39: North America Market Value (USD Million) by Channel, 2025-2035
  • Figure 40: North America Market Value (USD Million) by Skin Type, 2025-2035
  • Figure 41: North America Market Value (USD Million) by End User, 2025-2035
  • Figure 42: North America Market Value (USD Million) by Country, 2025-2035
  • Figure 43: North America Market Value (USD Million) Analysis by Country, 2020-2035
  • Figure 44: North America Market Volume (Units) Analysis by Country, 2020-2035
  • Figure 45: North America Market Value Share (%) and BPS Analysis by Country, 2025-2035
  • Figure 46: North America Market Y-o-Y Growth (%) Projections by Country, 2025-2035
  • Figure 47: North America Market Value (USD Million) Analysis by Product Type, 2020-2035
  • Figure 48: North America Market Volume (Units) Analysis by Product Type, 2020-2035
  • Figure 49: North America Market Value Share (%) and BPS Analysis by Product Type, 2025-2035
  • Figure 50: North America Market Y-o-Y Growth (%) Projections by Product Type, 2025-2035
  • Figure 51: North America Market Value (USD Million) Analysis by Active Ingredient, 2020-2035
  • Figure 52: North America Market Volume (Units) Analysis by Active Ingredient, 2020-2035
  • Figure 53: North America Market Value Share (%) and BPS Analysis by Active Ingredient, 2025-2035
  • Figure 54: North America Market Y-o-Y Growth (%) Projections by Active Ingredient, 2025-2035
  • Figure 55: North America Market Value (USD Million) Analysis by Channel, 2020-2035
  • Figure 56: North America Market Volume (Units) Analysis by Channel, 2020-2035
  • Figure 57: North America Market Value Share (%) and BPS Analysis by Channel, 2025-2035
  • Figure 58: North America Market Y-o-Y Growth (%) Projections by Channel, 2025-2035
  • Figure 59: North America Market Value (USD Million) Analysis by Skin Type, 2020-2035
  • Figure 60: North America Market Volume (Units) Analysis by Skin Type, 2020-2035
  • Figure 61: North America Market Value Share (%) and BPS Analysis by Skin Type, 2025-2035
  • Figure 62: North America Market Y-o-Y Growth (%) Projections by Skin Type, 2025-2035
  • Figure 63: North America Market Value (USD Million) Analysis by End User, 2020-2035
  • Figure 64: North America Market Volume (Units) Analysis by End User, 2020-2035
  • Figure 65: North America Market Value Share (%) and BPS Analysis by End User, 2025-2035
  • Figure 66: North America Market Y-o-Y Growth (%) Projections by End User, 2025-2035
  • Figure 67: North America Market Attractiveness by Product Type, 2025-2035
  • Figure 68: North America Market Attractiveness by Active Ingredient, 2025-2035
  • Figure 69: North America Market Attractiveness by Channel, 2025-2035
  • Figure 70: North America Market Attractiveness by Skin Type, 2025-2035
  • Figure 71: North America Market Attractiveness by End User, 2025-2035
  • Figure 72: North America Market Attractiveness by Country, 2025-2035
  • Figure 73: Latin America Market Value (USD Million) by Product Type, 2025-2035
  • Figure 74: Latin America Market Value (USD Million) by Active Ingredient, 2025-2035
  • Figure 75: Latin America Market Value (USD Million) by Channel, 2025-2035
  • Figure 76: Latin America Market Value (USD Million) by Skin Type, 2025-2035
  • Figure 77: Latin America Market Value (USD Million) by End User, 2025-2035
  • Figure 78: Latin America Market Value (USD Million) by Country, 2025-2035
  • Figure 79: Latin America Market Value (USD Million) Analysis by Country, 2020-2035
  • Figure 80: Latin America Market Volume (Units) Analysis by Country, 2020-2035
  • Figure 81: Latin America Market Value Share (%) and BPS Analysis by Country, 2025-2035
  • Figure 82: Latin America Market Y-o-Y Growth (%) Projections by Country, 2025-2035
  • Figure 83: Latin America Market Value (USD Million) Analysis by Product Type, 2020-2035
  • Figure 84: Latin America Market Volume (Units) Analysis by Product Type, 2020-2035
  • Figure 85: Latin America Market Value Share (%) and BPS Analysis by Product Type, 2025-2035
  • Figure 86: Latin America Market Y-o-Y Growth (%) Projections by Product Type, 2025-2035
  • Figure 87: Latin America Market Value (USD Million) Analysis by Active Ingredient, 2020-2035
  • Figure 88: Latin America Market Volume (Units) Analysis by Active Ingredient, 2020-2035
  • Figure 89: Latin America Market Value Share (%) and BPS Analysis by Active Ingredient, 2025-2035
  • Figure 90: Latin America Market Y-o-Y Growth (%) Projections by Active Ingredient, 2025-2035
  • Figure 91: Latin America Market Value (USD Million) Analysis by Channel, 2020-2035
  • Figure 92: Latin America Market Volume (Units) Analysis by Channel, 2020-2035
  • Figure 93: Latin America Market Value Share (%) and BPS Analysis by Channel, 2025-2035
  • Figure 94: Latin America Market Y-o-Y Growth (%) Projections by Channel, 2025-2035
  • Figure 95: Latin America Market Value (USD Million) Analysis by Skin Type, 2020-2035
  • Figure 96: Latin America Market Volume (Units) Analysis by Skin Type, 2020-2035
  • Figure 97: Latin America Market Value Share (%) and BPS Analysis by Skin Type, 2025-2035
  • Figure 98: Latin America Market Y-o-Y Growth (%) Projections by Skin Type, 2025-2035
  • Figure 99: Latin America Market Value (USD Million) Analysis by End User, 2020-2035
  • Figure 100: Latin America Market Volume (Units) Analysis by End User, 2020-2035
  • Figure 101: Latin America Market Value Share (%) and BPS Analysis by End User, 2025-2035
  • Figure 102: Latin America Market Y-o-Y Growth (%) Projections by End User, 2025-2035
  • Figure 103: Latin America Market Attractiveness by Product Type, 2025-2035
  • Figure 104: Latin America Market Attractiveness by Active Ingredient, 2025-2035
  • Figure 105: Latin America Market Attractiveness by Channel, 2025-2035
  • Figure 106: Latin America Market Attractiveness by Skin Type, 2025-2035
  • Figure 107: Latin America Market Attractiveness by End User, 2025-2035
  • Figure 108: Latin America Market Attractiveness by Country, 2025-2035
  • Figure 109: Europe Market Value (USD Million) by Product Type, 2025-2035
  • Figure 110: Europe Market Value (USD Million) by Active Ingredient, 2025-2035
  • Figure 111: Europe Market Value (USD Million) by Channel, 2025-2035
  • Figure 112: Europe Market Value (USD Million) by Skin Type, 2025-2035
  • Figure 113: Europe Market Value (USD Million) by End User, 2025-2035
  • Figure 114: Europe Market Value (USD Million) by Country, 2025-2035
  • Figure 115: Europe Market Value (USD Million) Analysis by Country, 2020-2035
  • Figure 116: Europe Market Volume (Units) Analysis by Country, 2020-2035
  • Figure 117: Europe Market Value Share (%) and BPS Analysis by Country, 2025-2035
  • Figure 118: Europe Market Y-o-Y Growth (%) Projections by Country, 2025-2035
  • Figure 119: Europe Market Value (USD Million) Analysis by Product Type, 2020-2035
  • Figure 120: Europe Market Volume (Units) Analysis by Product Type, 2020-2035
  • Figure 121: Europe Market Value Share (%) and BPS Analysis by Product Type, 2025-2035
  • Figure 122: Europe Market Y-o-Y Growth (%) Projections by Product Type, 2025-2035
  • Figure 123: Europe Market Value (USD Million) Analysis by Active Ingredient, 2020-2035
  • Figure 124: Europe Market Volume (Units) Analysis by Active Ingredient, 2020-2035
  • Figure 125: Europe Market Value Share (%) and BPS Analysis by Active Ingredient, 2025-2035
  • Figure 126: Europe Market Y-o-Y Growth (%) Projections by Active Ingredient, 2025-2035
  • Figure 127: Europe Market Value (USD Million) Analysis by Channel, 2020-2035
  • Figure 128: Europe Market Volume (Units) Analysis by Channel, 2020-2035
  • Figure 129: Europe Market Value Share (%) and BPS Analysis by Channel, 2025-2035
  • Figure 130: Europe Market Y-o-Y Growth (%) Projections by Channel, 2025-2035
  • Figure 131: Europe Market Value (USD Million) Analysis by Skin Type, 2020-2035
  • Figure 132: Europe Market Volume (Units) Analysis by Skin Type, 2020-2035
  • Figure 133: Europe Market Value Share (%) and BPS Analysis by Skin Type, 2025-2035
  • Figure 134: Europe Market Y-o-Y Growth (%) Projections by Skin Type, 2025-2035
  • Figure 135: Europe Market Value (USD Million) Analysis by End User, 2020-2035
  • Figure 136: Europe Market Volume (Units) Analysis by End User, 2020-2035
  • Figure 137: Europe Market Value Share (%) and BPS Analysis by End User, 2025-2035
  • Figure 138: Europe Market Y-o-Y Growth (%) Projections by End User, 2025-2035
  • Figure 139: Europe Market Attractiveness by Product Type, 2025-2035
  • Figure 140: Europe Market Attractiveness by Active Ingredient, 2025-2035
  • Figure 141: Europe Market Attractiveness by Channel, 2025-2035
  • Figure 142: Europe Market Attractiveness by Skin Type, 2025-2035
  • Figure 143: Europe Market Attractiveness by End User, 2025-2035
  • Figure 144: Europe Market Attractiveness by Country, 2025-2035
  • Figure 145: East Asia Market Value (USD Million) by Product Type, 2025-2035
  • Figure 146: East Asia Market Value (USD Million) by Active Ingredient, 2025-2035
  • Figure 147: East Asia Market Value (USD Million) by Channel, 2025-2035
  • Figure 148: East Asia Market Value (USD Million) by Skin Type, 2025-2035
  • Figure 149: East Asia Market Value (USD Million) by End User, 2025-2035
  • Figure 150: East Asia Market Value (USD Million) by Country, 2025-2035
  • Figure 151: East Asia Market Value (USD Million) Analysis by Country, 2020-2035
  • Figure 152: East Asia Market Volume (Units) Analysis by Country, 2020-2035
  • Figure 153: East Asia Market Value Share (%) and BPS Analysis by Country, 2025-2035
  • Figure 154: East Asia Market Y-o-Y Growth (%) Projections by Country, 2025-2035
  • Figure 155: East Asia Market Value (USD Million) Analysis by Product Type, 2020-2035
  • Figure 156: East Asia Market Volume (Units) Analysis by Product Type, 2020-2035
  • Figure 157: East Asia Market Value Share (%) and BPS Analysis by Product Type, 2025-2035
  • Figure 158: East Asia Market Y-o-Y Growth (%) Projections by Product Type, 2025-2035
  • Figure 159: East Asia Market Value (USD Million) Analysis by Active Ingredient, 2020-2035
  • Figure 160: East Asia Market Volume (Units) Analysis by Active Ingredient, 2020-2035
  • Figure 161: East Asia Market Value Share (%) and BPS Analysis by Active Ingredient, 2025-2035
  • Figure 162: East Asia Market Y-o-Y Growth (%) Projections by Active Ingredient, 2025-2035
  • Figure 163: East Asia Market Value (USD Million) Analysis by Channel, 2020-2035
  • Figure 164: East Asia Market Volume (Units) Analysis by Channel, 2020-2035
  • Figure 165: East Asia Market Value Share (%) and BPS Analysis by Channel, 2025-2035
  • Figure 166: East Asia Market Y-o-Y Growth (%) Projections by Channel, 2025-2035
  • Figure 167: East Asia Market Value (USD Million) Analysis by Skin Type, 2020-2035
  • Figure 168: East Asia Market Volume (Units) Analysis by Skin Type, 2020-2035
  • Figure 169: East Asia Market Value Share (%) and BPS Analysis by Skin Type, 2025-2035
  • Figure 170: East Asia Market Y-o-Y Growth (%) Projections by Skin Type, 2025-2035
  • Figure 171: East Asia Market Value (USD Million) Analysis by End User, 2020-2035
  • Figure 172: East Asia Market Volume (Units) Analysis by End User, 2020-2035
  • Figure 173: East Asia Market Value Share (%) and BPS Analysis by End User, 2025-2035
  • Figure 174: East Asia Market Y-o-Y Growth (%) Projections by End User, 2025-2035
  • Figure 175: East Asia Market Attractiveness by Product Type, 2025-2035
  • Figure 176: East Asia Market Attractiveness by Active Ingredient, 2025-2035
  • Figure 177: East Asia Market Attractiveness by Channel, 2025-2035
  • Figure 178: East Asia Market Attractiveness by Skin Type, 2025-2035
  • Figure 179: East Asia Market Attractiveness by End User, 2025-2035
  • Figure 180: East Asia Market Attractiveness by Country, 2025-2035
  • Figure 181: South Asia & Pacific Market Value (USD Million) by Product Type, 2025-2035
  • Figure 182: South Asia & Pacific Market Value (USD Million) by Active Ingredient, 2025-2035
  • Figure 183: South Asia & Pacific Market Value (USD Million) by Channel, 2025-2035
  • Figure 184: South Asia & Pacific Market Value (USD Million) by Skin Type, 2025-2035
  • Figure 185: South Asia & Pacific Market Value (USD Million) by End User, 2025-2035
  • Figure 186: South Asia & Pacific Market Value (USD Million) by Country, 2025-2035
  • Figure 187: South Asia & Pacific Market Value (USD Million) Analysis by Country, 2020-2035
  • Figure 188: South Asia & Pacific Market Volume (Units) Analysis by Country, 2020-2035
  • Figure 189: South Asia & Pacific Market Value Share (%) and BPS Analysis by Country, 2025-2035
  • Figure 190: South Asia & Pacific Market Y-o-Y Growth (%) Projections by Country, 2025-2035
  • Figure 191: South Asia & Pacific Market Value (USD Million) Analysis by Product Type, 2020-2035
  • Figure 192: South Asia & Pacific Market Volume (Units) Analysis by Product Type, 2020-2035
  • Figure 193: South Asia & Pacific Market Value Share (%) and BPS Analysis by Product Type, 2025-2035
  • Figure 194: South Asia & Pacific Market Y-o-Y Growth (%) Projections by Product Type, 2025-2035
  • Figure 195: South Asia & Pacific Market Value (USD Million) Analysis by Active Ingredient, 2020-2035
  • Figure 196: South Asia & Pacific Market Volume (Units) Analysis by Active Ingredient, 2020-2035
  • Figure 197: South Asia & Pacific Market Value Share (%) and BPS Analysis by Active Ingredient, 2025-2035
  • Figure 198: South Asia & Pacific Market Y-o-Y Growth (%) Projections by Active Ingredient, 2025-2035
  • Figure 199: South Asia & Pacific Market Value (USD Million) Analysis by Channel, 2020-2035
  • Figure 200: South Asia & Pacific Market Volume (Units) Analysis by Channel, 2020-2035
  • Figure 201: South Asia & Pacific Market Value Share (%) and BPS Analysis by Channel, 2025-2035
  • Figure 202: South Asia & Pacific Market Y-o-Y Growth (%) Projections by Channel, 2025-2035
  • Figure 203: South Asia & Pacific Market Value (USD Million) Analysis by Skin Type, 2020-2035
  • Figure 204: South Asia & Pacific Market Volume (Units) Analysis by Skin Type, 2020-2035
  • Figure 205: South Asia & Pacific Market Value Share (%) and BPS Analysis by Skin Type, 2025-2035
  • Figure 206: South Asia & Pacific Market Y-o-Y Growth (%) Projections by Skin Type, 2025-2035
  • Figure 207: South Asia & Pacific Market Value (USD Million) Analysis by End User, 2020-2035
  • Figure 208: South Asia & Pacific Market Volume (Units) Analysis by End User, 2020-2035
  • Figure 209: South Asia & Pacific Market Value Share (%) and BPS Analysis by End User, 2025-2035
  • Figure 210: South Asia & Pacific Market Y-o-Y Growth (%) Projections by End User, 2025-2035
  • Figure 211: South Asia & Pacific Market Attractiveness by Product Type, 2025-2035
  • Figure 212: South Asia & Pacific Market Attractiveness by Active Ingredient, 2025-2035
  • Figure 213: South Asia & Pacific Market Attractiveness by Channel, 2025-2035
  • Figure 214: South Asia & Pacific Market Attractiveness by Skin Type, 2025-2035
  • Figure 215: South Asia & Pacific Market Attractiveness by End User, 2025-2035
  • Figure 216: South Asia & Pacific Market Attractiveness by Country, 2025-2035
  • Figure 217: Middle East and Africa Market Value (USD Million) by Product Type, 2025-2035
  • Figure 218: Middle East and Africa Market Value (USD Million) by Active Ingredient, 2025-2035
  • Figure 219: Middle East and Africa Market Value (USD Million) by Channel, 2025-2035
  • Figure 220: Middle East and Africa Market Value (USD Million) by Skin Type, 2025-2035
  • Figure 221: Middle East and Africa Market Value (USD Million) by End User, 2025-2035
  • Figure 222: Middle East and Africa Market Value (USD Million) by Country, 2025-2035
  • Figure 223: Middle East and Africa Market Value (USD Million) Analysis by Country, 2020-2035
  • Figure 224: Middle East and Africa Market Volume (Units) Analysis by Country, 2020-2035
  • Figure 225: Middle East and Africa Market Value Share (%) and BPS Analysis by Country, 2025-2035
  • Figure 226: Middle East and Africa Market Y-o-Y Growth (%) Projections by Country, 2025-2035
  • Figure 227: Middle East and Africa Market Value (USD Million) Analysis by Product Type, 2020-2035
  • Figure 228: Middle East and Africa Market Volume (Units) Analysis by Product Type, 2020-2035
  • Figure 229: Middle East and Africa Market Value Share (%) and BPS Analysis by Product Type, 2025-2035
  • Figure 230: Middle East and Africa Market Y-o-Y Growth (%) Projections by Product Type, 2025-2035
  • Figure 231: Middle East and Africa Market Value (USD Million) Analysis by Active Ingredient, 2020-2035
  • Figure 232: Middle East and Africa Market Volume (Units) Analysis by Active Ingredient, 2020-2035
  • Figure 233: Middle East and Africa Market Value Share (%) and BPS Analysis by Active Ingredient, 2025-2035
  • Figure 234: Middle East and Africa Market Y-o-Y Growth (%) Projections by Active Ingredient, 2025-2035
  • Figure 235: Middle East and Africa Market Value (USD Million) Analysis by Channel, 2020-2035
  • Figure 236: Middle East and Africa Market Volume (Units) Analysis by Channel, 2020-2035
  • Figure 237: Middle East and Africa Market Value Share (%) and BPS Analysis by Channel, 2025-2035
  • Figure 238: Middle East and Africa Market Y-o-Y Growth (%) Projections by Channel, 2025-2035
  • Figure 239: Middle East and Africa Market Value (USD Million) Analysis by Skin Type, 2020-2035
  • Figure 240: Middle East and Africa Market Volume (Units) Analysis by Skin Type, 2020-2035
  • Figure 241: Middle East and Africa Market Value Share (%) and BPS Analysis by Skin Type, 2025-2035
  • Figure 242: Middle East and Africa Market Y-o-Y Growth (%) Projections by Skin Type, 2025-2035
  • Figure 243: Middle East and Africa Market Value (USD Million) Analysis by End User, 2020-2035
  • Figure 244: Middle East and Africa Market Volume (Units) Analysis by End User, 2020-2035
  • Figure 245: Middle East and Africa Market Value Share (%) and BPS Analysis by End User, 2025-2035
  • Figure 246: Middle East and Africa Market Y-o-Y Growth (%) Projections by End User, 2025-2035
  • Figure 247: Middle East and Africa Market Attractiveness by Product Type, 2025-2035
  • Figure 248: Middle East and Africa Market Attractiveness by Active Ingredient, 2025-2035
  • Figure 249: Middle East and Africa Market Attractiveness by Channel, 2025-2035
  • Figure 250: Middle East and Africa Market Attractiveness by Skin Type, 2025-2035
  • Figure 251: Middle East and Africa Market Attractiveness by End User, 2025-2035
  • Figure 252: Middle East and Africa Market Attractiveness by Country, 2025-2035

Frequently Asked Questions

How big is the Global Anti-Acne Products Market in 2025?

The Global Anti-Acne Products Market is estimated to be valued at USD 8,203.1 million in 2025.

What will be the size of the Global Anti-Acne Products Market in 2035?

The market size for the Global Anti-Acne Products Market is projected to reach USD 17,902.4 million by 2035.

How much will be the Global Anti-Acne Products Market growth between 2025 and 2035?

The Global Anti-Acne Products Market is expected to grow at a CAGR of 8.1% between 2025 and 2035.

What are the key product types in the Global Anti-Acne Products Market?

The key product types in the Global Anti-Acne Products Market are topical creams & gels, medicated cleansers & face washes, spot treatments & patches, and oral supplements (OTC).

Which skin type segment will contribute a significant share in the Global Anti-Acne Products Market in 2025?

In terms of skin type, the oily/acne-prone segment is projected to command 46.3% share in the Global Anti-Acne Products Market in 2025.

Explore Similar Insights

Future Market Insights

Anti-Acne Products Market

Chat With

MaRIA

Hi There, I am MaRIA, Your Market Research Intelligence Assistant. How may I help you?