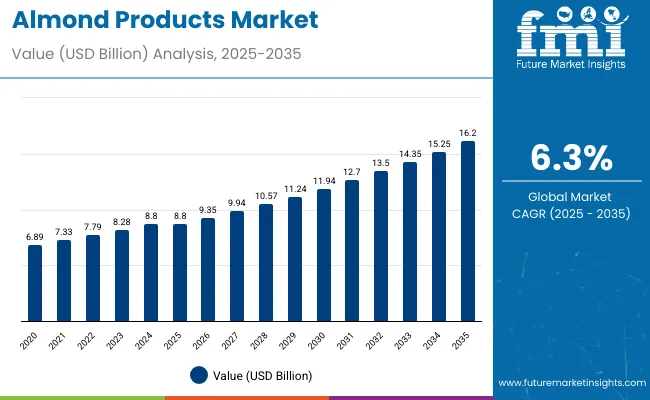
The almond products market is estimated to be valued at USD 8.8 billion in 2025. It is projected to reach USD 16.2 billion by 2035, registering a compound annual growth rate (CAGR) of 6.3% over the forecast period. The market is projected to add an absolute dollar opportunity of USD 7.4 billion over the forecast period.
This reflects 1.84 times growth during the forecast period at a compound annual growth rate of 6.3%. The market evolution is expected to be shaped byincreasing consumer preference for plant-based alternatives, rising lactose intolerance cases, and growing demand for clean-label and nutrient-rich products, particularly where enhanced nutritional profiles and sustainable sourcing are prioritized.
By 2030, the market is likely to reach USD 11.8 billion, contributing USD 3.0 billion in incremental value during the first half of the period. The remaining USD 4.4 billion is expected in the second half, indicating back-loaded growth. Product innovation in almond milk formulations and plant-based alternatives is gaining traction due to the favorable nutritional advantages of almond productsand versatile applications across food categories.
Companies such as Blue Diamond Growers and The Wonderful Company are advancing their competitive positions through investment in advanced processing technologies and sustainable farming practices. Health-conscious consumer demand is supporting expansion into dairy alternatives, bakery applications, and beauty and personal care products. Market performance will remain anchored in nutritional efficacy, product innovation, and clean-label compliance benchmarks.
| Metric | Value |
|---|---|
| Estimated Size (2025E) | USD 8.8 billion |
| Projected Value (2035F) | USD 16.2 billion |
| CAGR (2025 to 2035) | 6.3% |
The market holds notable shares across its adjacent sectors due to versatile applications. It accounts for 25% of the dairy alternatives market, largely driven by almond milk. In the plant-based food market, almond-based items contribute around 18%, supported by their role in snacks, protein supplements, and bakery products. Within the natural cosmetics market, almond oils and extracts represent nearly 10% of total revenues. In the nut ingredients market, almond products dominate with a 35% share, reflecting widespread usage across the food and personal care industries. These contributions continue to grow amid clean-label and wellness trends globally.
The market is experiencing structural change as demand for plant-based, nutrient-dense foods increases. Advanced processing techniques such as spray drying and enzymatic extraction improve nutritional quality, texture, and stability, boosting applications in bakery, beverages, and confectionery. Producers are diversifying with almond protein powders, butters, and fortified drinks. Strategic collaborations, transparent sourcing, and clean-label positioning drive consumer trust, reshaping procurement patterns and compelling traditional ingredient suppliers to adapt to evolving consumption preferences.
Almond products' exceptional nutritional profile, plant-based nature, and versatile applications make them highly attractive to health-conscious consumers and food manufacturers seeking dairy alternatives and premium ingredient solutions. The rising prevalence of lactose intolerance, increasing vegan and plant-based dietary adoption, and growing demand for clean-label products are driving significant market expansion across multiple consumer segments.
Growing awareness of sustainable food choices and functional nutrition is further propelling adoption, especially in dairy alternative beverages, bakery applications, and beauty and wellness sectors. Innovation in almond processing technology, flavor enhancement, and product fortification is also improving quality and expanding application possibilities across diverse food categories.
As health and wellness trends accelerate globally and environmental sustainability becomes paramount, the market outlook remains highly favorable. With consumers and manufacturers prioritizing plant-based nutrition, allergen-free alternatives, and premium natural ingredients, almond products are positioned to expand across food, beverage, cosmetic, and nutraceutical applications.
The market is segmented by type, application, distribution channel, and region. By type, the market is categorized into almond milk, whole almonds, almond paste, almond pieces, almond flour, and others (almond oil, almond extract, and almond skins).
Based on application, the market is segmented into confectionery, bakery, sweet & savory snacks, nut & seed butter, dairy, RTE cereals, and milk substitutes & ice creams. In terms of distribution channel, the market is divided into departmental stores, food & beverage manufacturers/suppliers, and online retail. Regionally, the market is classified into North America, Latin America, Western Europe, Eastern Europe, South Asia and Pacific, East Asia, the Middle East and Africa.
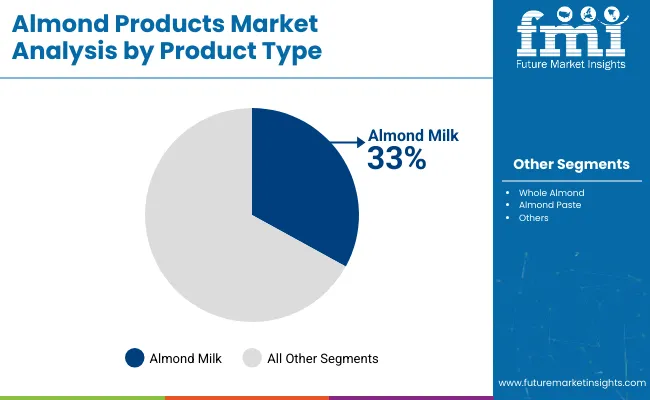
The almond milk segment holds a dominant 33% share in the product type category, owing to its widespread consumer acceptance as a plant-based dairy alternative and its versatile application across multiple beverage formats. Almond milk products are extensively utilized across retail and food service sectors, including ready-to-drink beverages, coffee creamers, and smoothie bases, due to their superior nutritional profile and lactose-free properties.
They enable consumers to access dairy-like nutrition while maintaining dietary preferences for plant-based, vegan, and clean-label products. As demand for sustainable, health-conscious, and allergen-friendly alternatives grows, almond milk continues to gain preference in both household consumption and commercial food service applications.
Manufacturers are investing in fortification technologies, flavor enhancement, and packaging innovations to improve nutritional density, taste profiles, and shelf stability. The segment is poised to expand further as global health trends favor plant-based, protein-rich, and environmentally sustainable dairy alternatives.
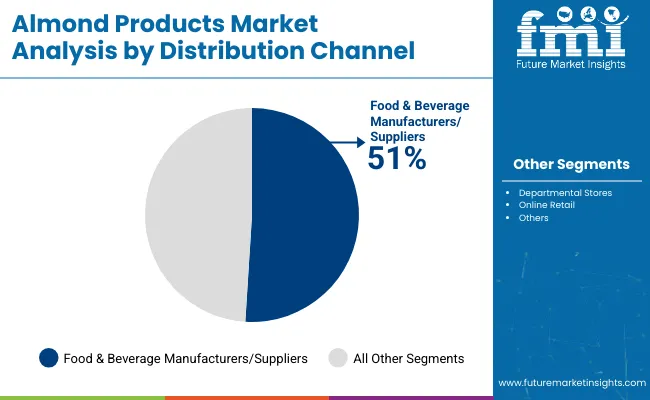
Food & beverage manufacturers/suppliers remain a core distribution channel with 51% of the market share in 2025, since almond products are essential ingredients in processed foods, bakery applications, and functional beverages. Their procurement versatility supports product innovation in clean-label snack foods, high-protein nutrition bars, and plant-based dairy formulations.
Almond ingredients also enhance nutritional profiles and functional properties in manufactured products, while offering consistent quality and supply chain reliability without the variability of fresh ingredients. This makes them indispensable in industrial food production environments.
Ongoing demand for plant-based ingredients and the premiumization of health-focused food products are key trends driving the sustained relevance of B2B almond ingredient sourcing in this distribution channel.
In 2024, global almond product consumption grew by 22% year-on-year, with Asia-Pacific taking a 35% share. Applications include plant-based milk alternatives, bakery ingredient enhancement, and premium health food manufacturing. Manufacturers are introducing advanced processing techniques and multi-functional almond formulations that deliver superior nutritional density and application versatility.
Transparent ingredient positioning is now supported through clean-label formulations. Plant-based consumption trends and nutritional efficacy support consumer confidence. Technology providers increasingly supply ready-to-use almond solutions with integrated nutritional profiles to reduce formulation complexity.
Health and Wellness Trends Drive Almond Products Adoption
Food manufacturers and beverage companies are choosing almond-based ingredients to achieve lactose-free alternatives, enhance nutritional profiles, and meet consumer demands for plant-based products. In nutritional testing, almond milk delivers up to 50% fewer calories than dairy milk while providing vitamin E, healthy fats, and protein.
Products incorporating almond ingredients maintain flavor stability and nutritional integrity throughout processing cycles. In ready-to-drink formats, almond-based beverages help reduce sugar content while maintaining taste appeal by up to 40%. Almond product applications are now being deployed for clean-label positioning, increasing adoption in sectors demanding natural plant-based enhancement. These advantages help explain why almond product adoption rates in food manufacturing rose 28% in 2024 across North America and Europe.
Supply Chain Complexity, Price Volatility and Processing Constraints Restrict Expansion
Growth faces constraints due to almond commodity price fluctuations, water-intensive cultivation requirements, and specialized processing infrastructure needs. Raw almond costs can vary from USD 2.50 to USD 4.20 per pound, depending on seasonal factors and California drought conditions, impacting product pricing and leading to procurement delays of up to 15% in industrial applications.
Advanced processing technology requirements and quality control standards add 6 to 8 weeks to product development cycles. Cold storage logistics and specialized handling conditions extend distribution costs by 18-25% compared to conventional ingredients. Limited processing capacity among almond facilities restricts scalable production, especially for custom formulation projects. These constraints make almond product adoption challenging in price-sensitive markets despite growing nutritional benefits and commercial interest.
| Countries | CAGR (2025-2035) |
|---|---|
| China | 12% |
| India | 8% |
| Germany | 7.5% |
| France | 7% |
| USA | 6% |
| Brazil | 5.5% |
| UK | 5% |
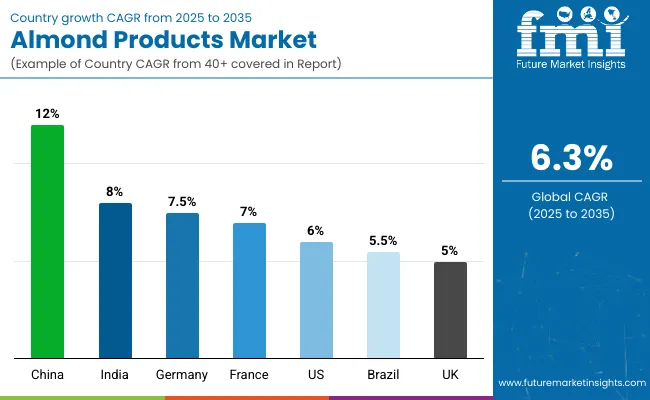
In the almond products market, China leads with the highest projected CAGR of 12% from 2025 to 2035, driven by rapid urbanization and growing health consciousness. India follows with a CAGR of 8%, supported by expanding middle-class consumption and plant-based dietary trends. Germany is next at 7.5%, benefiting from the integration of premium organic food and a sustainability focus.
France shows growth at 7%, driven by artisanal and clean-label food applications. The USA maintains steady growth at 6%, close to the global average, while Brazil and the UK show moderate expansion at 5.5% and 5% respectively, reflecting mature market dynamics and economic constraints.
The report covers an in-depth analysis of 40+ countries; seven top-performing OECD countries are highlighted below.
Revenue from almond products in China is projected to grow at a CAGR of 12% from 2025 to 2035, significantly exceeding the global average of 6.3%. Growth is fueled by rapid urbanization, rising disposable incomes, and increasing health awareness among consumers in major cities like Beijing, Shanghai, and Guangzhou. Local manufacturers are investing in almond milk production facilities and establishing partnerships with international suppliers to meet growing domestic demand for dairy alternatives and healthy snacking options.
Key Statistics:
The almond products market in India is anticipated to expand at a CAGR of 8% from 2025 to 2035, exceeding the global rate by 1.7%. Growth is centered on increasing health consciousness and expanding middle-class purchasing power in Mumbai, Delhi, and Bangalore regions. Traditional Ayurvedic wellness practices are driving demand for almond-based nutrition products and premium health foods. Indian food manufacturers are developing localized almond milk formulations and incorporating almonds into conventional sweets and confectionery products.
Key Statistics:
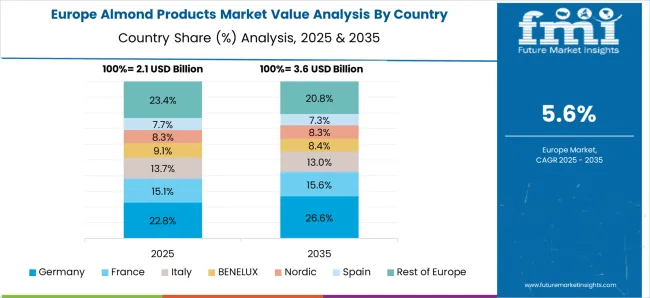
Sales of almond products in Germany are slated to flourish at a CAGR of 7.5% from 2025 to 2035, substantially above the global average. Growth has been concentrated in organic and sustainable food applications across the Munich, Berlin, and Hamburg regions. German consumers are driving demand for premium plant-based alternatives and environmentally conscious food choices. Almond product adoption is shifting toward specialized nutrition and organic food segments. EU regulatory framework compliance and German quality standards have improved almond product accessibility in premium health food and nutrition markets.
Key Statistics:
Revenue from almond products in France is expected to grow at a CAGR of 7% from 2025 to 2035, outperforming the global average by 0.7%. Demand is driven by artisanal food culture and premium plant-based product adoption in Paris, Lyon, and Marseille markets. French patisseries and gourmet food manufacturers are increasingly incorporating almond ingredients for product differentiation and culinary enhancement. Government nutrition guidelines promoting plant-based consumption and sustainable food choices have helped accelerate commercial almond product adoption across retail and food service channels.
Key Statistics:
Demand for almond products in the USA is projected to rise at a CAGR of 6% from 2025 to 2035, aligned with the global average. Growth is supported by an established plant-based food culture and strong domestic almond production in California. Urban markets like Los Angeles, New York, and Chicago are experiencing continued demand for almond milk, almond butter, and plant-based snacks. USA manufacturers benefit from proximity to California's almond orchards and advanced processing infrastructure. Market maturity limits explosive growth but ensures steady expansion driven by health-conscious consumers and food service sector adoption of dairy alternatives.
Key Statistics:
Revenue from almond products in Brazil is expected to grow at a CAGR of 5.5% from 2025 to 2035, slightly below the global average of 6.3%. Demand is emerging in São Paulo, Rio de Janeiro, and Brasília markets as health consciousness increases among urban consumers. Brazilian food manufacturers are gradually incorporating imported almond ingredients into local product formulations. Market development is focused on premium health food segments and specialized nutrition applications, particularly among higher-income demographics seeking international food trends.
Key Statistics:
Sales of almond products in the UK are expected to expand at a CAGR of 5% from 2025 to 2035, underperforming the global average by 1.3%. Growth is supported by an established plant-based food culture and a health-conscious consumer base in London, Manchester, and Birmingham markets. Retailers in the UK have strong distribution networks for almond milk and plant-based alternatives. Market focus has shifted toward premium and specialty almond products, particularly in organic and sustainable food segments targeting environmentally conscious consumers.
Key Statistics:
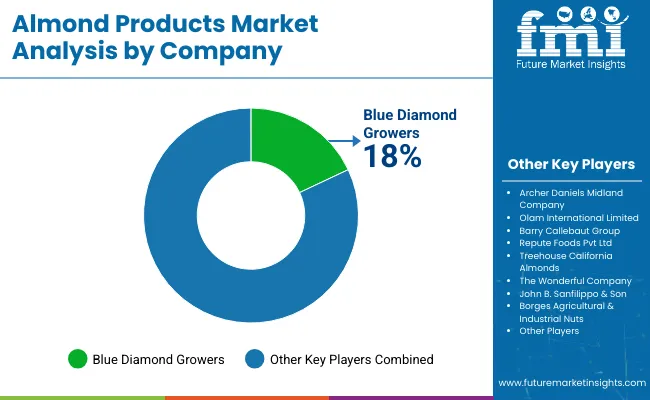
The market is moderately fragmented, featuring a mix of global agricultural giants, specialized processors, and regional suppliers with varying degrees of processing technology, product innovation, and application expertise. Blue Diamond Growers and The Wonderful Company lead the almond-based ingredient segment, supplying advanced nutritional products for dairy alternatives, bakery applications, and health food manufacturing. Their strength lies in comprehensive almond farming and processing capabilities, extensive distribution networks, and established relationships with major food and beverage manufacturers.
Archer Daniels Midland Company and Olam International Limited differentiate through specialized processing technologies, custom formulation services, and application-specific solutions that cater to industrial food manufacturing and ingredient supply applications. Barry Callebaut Group and Döhler GmbH focus on premium almond ingredient production, addressing growing demand for confectionery applications, beauty and wellness products, and specialized nutrition formulations.
Regional specialists such as Repute Foods Pvt Ltd, John B. Sanfilippo & Son, and Borges Agricultural & Industrial Nuts emphasize processing innovation, sustainable sourcing practices, and market-specific positioning, creating value in specialty ingredient markets and localized food applications.
Entry barriers remain significant, driven by challenges in advanced processing technology, almond supply chain integration, and compliance with food safety and quality standards across multiple application categories. Competitiveness increasingly depends on processing efficiency, product diversification capabilities, and application development expertise for diverse food, beverage, and wellness manufacturing environments.
| Items | Value |
|---|---|
| Quantitative Units (2025) | USD 8.8 billion |
| Type | Almond Milk, Whole Almond, Almond Paste, Almond Pieces, Almond Flour, Others (Almond Oil, Almond Extract, and Almond Skins) |
| Application | Confectionery, Bakery, Sweet a nd Savory Snacks, Nut & Seed Butter, Dairy, RTE Cereals, And Milk Substitutes & Ice Creams |
| Distribution Channel | Departmental Stores, Food & Beverage Manufacturers/Suppliers, Online Retail |
| Regions Covered | North America, Latin America, Europe, the Middle East and Africa, East Asia, South Asia |
| Countries Covered | United States, Canada, United Kingdom, Germany, France, China, Japan, South Korea, Brazil, Australia , India and 40+ countries |
| Key Companies Profiled | Archer Daniels Midland Company, Olam International Limited, Barry Callebaut Group, Repute Foods Pvt Ltd, Treehouse California Almonds, Blue Diamond Growers, The Wonderful Company, John B. Sanfilippo & Son, Borges Agricultural & Industrial Nuts, Savencia SA, Kanegrade Limited, Modern Ingredients, Royal Nut Company, and Döhler GmbH |
| Additional Attributes | Dollar sales by type, application, and distribution channel; regional demand trends; competitive landscape; consumer preferences for natural, organic, and clean-label almond products; integration with sustainable sourcing and processing practices; innovations in product formulations and applications; and quality standardization across global supply chains |
The global almond products market is estimated to be valued at USD 8.8 billion in 2025.
The market size for the almond products market is projected to reach USD 16.2 billion by 2035.
The almond products market is expected to grow at a 6.3% CAGR between 2025 and 2035.
The key product types in almond products market are almond milk, whole almond, almond paste, almond pieces, almond flour and others.
In terms of application, confectionery segment to command 38.6% share in the almond products market in 2025.


Our Research Products

The "Full Research Suite" delivers actionable market intel, deep dives on markets or technologies, so clients act faster, cut risk, and unlock growth.

The Leaderboard benchmarks and ranks top vendors, classifying them as Established Leaders, Leading Challengers, or Disruptors & Challengers.

Locates where complements amplify value and substitutes erode it, forecasting net impact by horizon

We deliver granular, decision-grade intel: market sizing, 5-year forecasts, pricing, adoption, usage, revenue, and operational KPIs—plus competitor tracking, regulation, and value chains—across 60 countries broadly.

Spot the shifts before they hit your P&L. We track inflection points, adoption curves, pricing moves, and ecosystem plays to show where demand is heading, why it is changing, and what to do next across high-growth markets and disruptive tech

Real-time reads of user behavior. We track shifting priorities, perceptions of today’s and next-gen services, and provider experience, then pace how fast tech moves from trial to adoption, blending buyer, consumer, and channel inputs with social signals (#WhySwitch, #UX).

Partner with our analyst team to build a custom report designed around your business priorities. From analysing market trends to assessing competitors or crafting bespoke datasets, we tailor insights to your needs.
Supplier Intelligence
Discovery & Profiling
Capacity & Footprint
Performance & Risk
Compliance & Governance
Commercial Readiness
Who Supplies Whom
Scorecards & Shortlists
Playbooks & Docs
Category Intelligence
Definition & Scope
Demand & Use Cases
Cost Drivers
Market Structure
Supply Chain Map
Trade & Policy
Operating Norms
Deliverables
Buyer Intelligence
Account Basics
Spend & Scope
Procurement Model
Vendor Requirements
Terms & Policies
Entry Strategy
Pain Points & Triggers
Outputs
Pricing Analysis
Benchmarks
Trends
Should-Cost
Indexation
Landed Cost
Commercial Terms
Deliverables
Brand Analysis
Positioning & Value Prop
Share & Presence
Customer Evidence
Go-to-Market
Digital & Reputation
Compliance & Trust
KPIs & Gaps
Outputs
Full Research Suite comprises of:
Market outlook & trends analysis
Interviews & case studies
Strategic recommendations
Vendor profiles & capabilities analysis
5-year forecasts
8 regions and 60+ country-level data splits
Market segment data splits
12 months of continuous data updates
DELIVERED AS:
PDF EXCEL ONLINE
Almond Milk Market Size and Share Forecast Outlook 2025 to 2035
Almond Oil-Based Serums Market Size and Share Forecast Outlook 2025 to 2035
Almond Ingredients Market Size, Growth, and Forecast for 2025 to 2035
Products from Food Waste Industry Analysis in Korea Size, Share and Forecast Outlook 2025 to 2035
Products from Food Waste in Japan - Size, Share, and Forecast Outlook 2025 to 2035
Products from Food Waste Market Analysis - Size, Growth, and Forecast 2025 to 2035
Almond Flour Market Analysis - Size, Share, and Forecast 2025 to 2035
Almond Oil Market Analysis - Size, Share, and Forecast Outlook 2025 to 2035
Almond Protein Market Analysis - Size, Share, and Forecast Outlook 2025 to 2035
Almond Extract Market Analysis - Size, Share, and Forecast 2025 to 2035
Almond Drink Market Analysis - Size, Share, and Forecast 2025 to 2035
Almond Butter Market Growth - Healthy Spreads & Industry Demand 2025 to 2035
USA Products from Food Waste Market Growth – Trends, Demand & Outlook 2025-2035
Teff Products Market
Detox Products Market Analysis - Size, Share, and Forecast Outlook 2025 to 2035
Algae Products Market Analysis - Size, Share, and Forecast Outlook 2025 to 2035
Pulse Products Market Analysis - Size, Share, and Forecast Outlook 2025 to 2035
Dairy Products Market Analysis by Product Type, End Use, Distribution Channel and Region through 2035
Vacuum Products for Emergency Services Market Size and Share Forecast Outlook 2025 to 2035
Bamboo Products Market Analysis – Trends & Growth 2025 to 2035

Thank you!
You will receive an email from our Business Development Manager. Please be sure to check your SPAM/JUNK folder too.
Chat With
MaRIA