Detox Products Market Size and Share Forecast Outlook 2025 to 2035

The global detox products market is projected to grow from USD 40.7 billion in 2025 to USD 72.6 billion by 2035, registering a CAGR of 5.9%.
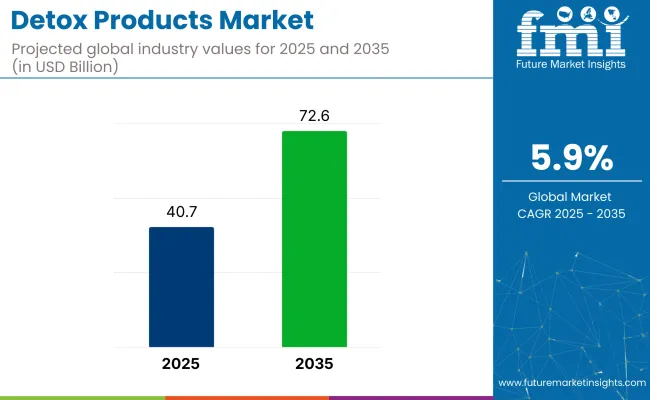
Quick Stats for detox products market

  • Market Value (2025): USD 40.7 billion
  • Forecast Value (2035): USD 72.6 billion
  • Forecast CAGR: 5.9%
  • Nature Leader in 2025: Organic (35% market share)
  • Top Sales Channel Segment: Hypermarkets/Supermarkets (31% share)
  • Key Growth Region: North America (USA is the fastest-growing market with 8.6% CAGR)

Detox Products Market

Metric Value
Industry Size (2025E) USD 40.7 billion
Industry Value (2035F) USD 72.6 billion
CAGR (2025 to 2035) 5.9%

The market expansion is driven by rising health consciousness, preference for natural and organic products, and increasing demand for functional foods and beverages offering cleansing and wellness benefits. Detox teas, juices, and supplements continue to gain traction among consumers seeking natural remedies for weight management, digestion, and immunity boosting.

The market holds a 100% share in the detox functional foods and beverages market as it forms its direct category. Within the broader functional foods market, detox products account for approximately 12%, driven by teas, juices, and supplements addressing gut health and immunity.

In the overall health and wellness products market, detox items hold nearly 4%, reflecting their positioning alongside vitamins and supplements. They contribute 2% to the global food and beverage market due to their niche focus, while their share in the vast consumer products market remains minimal below 0.3%, given its highly diversified nature.

Government regulations impacting the market focus on product safety, labeling standards, and health benefit claims to protect consumers and ensure authenticity. Regulatory bodies like the USA FDA, EFSA in Europe, and FSSAI in India enforce guidelines around permissible ingredients, organic certifications, and marketing claims. Compliance with these regulations is crucial for manufacturers to build consumer trust, expand global market access, and mitigate legal risks while promoting health-focused detox solutions.

The USA is projected to be the fastest-growing market, expanding at a CAGR of 8.6% from 2025 to 2035. Supermarkets and hypermarkets will lead the sales channel segment with a 31% share, while organic detox products will dominate the nature segment with a 35% share. The UK is also expected to grow steadily at a CAGR of 8.3%.

Detox Products Market Analysis by Top Investment Segments

The detox products market is segmented by product type, nature, sales channel, and region. By product type, the market is divided into detox teas, detox juices and smoothies, detox supplements and powders, and coffees. Based on nature, the market is classified into organic, regular, and decaffeinated.

By sales channel, the market is divided into hypermarkets/supermarkets, convenience stores,pharmacy and drugstores, grocery stores, food specialty stores, and online retail. Regionally, the market is classified into North America, Latin America, Western Europe, South Asia, East Asia, Eastern Europe, and the Middle East & Africa.

Detox Teas to Lead the Product Type Segment with 27% Market Share

Detox teas are projected to lead the product type segment, capturing 27% of the market share in 2025. These products are widely used for natural cleansing and weight management.

  • Detox teas offer perceived benefits such as liver detox, digestive health, and metabolism support.
  • Increased consumer preference for organic and herbal teas.

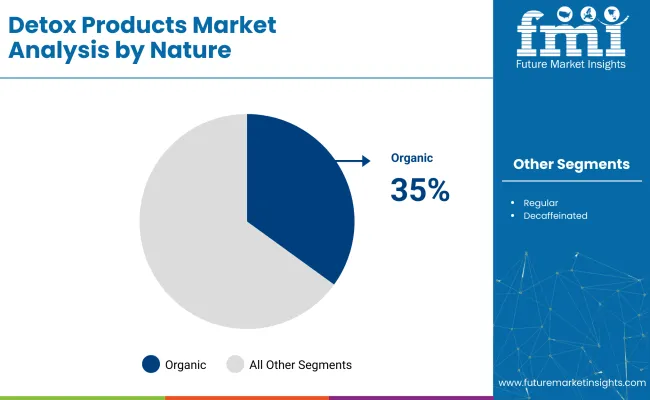
Organic to Dominate the Nature Segment with 35% Market Share in 2025

Organic is expected to lead the nature segment with a 35% market share in 2025. This growth is driven by rising consumer awareness, premium product demand, and evolving clean-label trends.
  • Consumers increasingly prefer clean-label, chemical-free products for holistic wellness.
  • Brands are investing in organic certifications to attract health-conscious buyers and boost premium positioning.

Detox Products Market By Nature

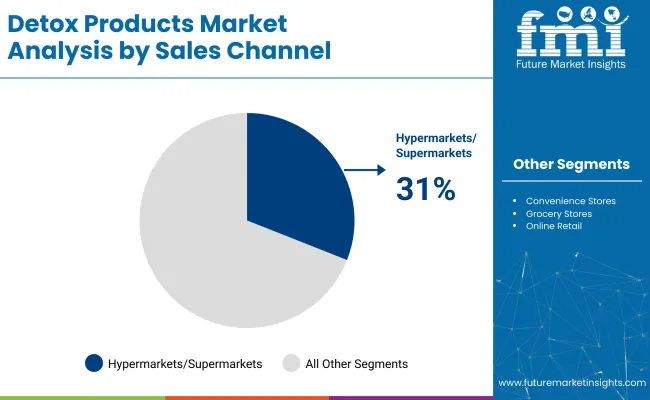
Supermarkets and Hypermarkets to Lead the Sales Channel Segment with 31% Market Share

Supermarkets and hypermarkets are expected to dominate the sales channel segment, accounting for 31% of the global market share by 2025. Growth is driven by convenient access to a wide range of trusted liver health supplement brands under one roof, allowing consumers to make informed, immediate purchase decisions.
  • These stores offer wide accessibility and product variety, appealing to convenience-focused consumers.
  • In-store promotions and wellness sections enhance visibility and drive higher footfall purchases for detox brands.

Detox Products Market By Sales Channel

Top Detox Products Market Dynamics

The global detox products market is experiencing steady growth, driven by increasing health consciousness and the rising demand for natural, organic, and functional food and beverage solutions. Detox products play a crucial role in supporting digestion, weight management, and overall wellness, aligning with consumer preferences for preventive health and clean-label offerings.

Recent Trends in the Detox Products Market

  • Integration of functional ingredients such as probiotics, adaptogens, and plant-based extracts is enhancing the health benefits and market appeal of detox products.
  • Hybrid detox products like protein smoothies with detox benefits and detox coffees are gaining popularity, offering consumers multi-functional solutions in convenient formats.

Challenges in the Detox Products Market
  • Lack of strong scientific validation for certain detox products, particularly herbal formulations without clinical trials, limits their acceptance among medical professionals and cautious consumers.
  • High production costs of organic detox products, driven by clean sourcing and certification requirements, result in premium pricing, making them less accessible in price-sensitive markets.

Top Countries Producing, Regulating, and Driving Demand for Detox Products

Country Wise Analysis Of Detox Products Market

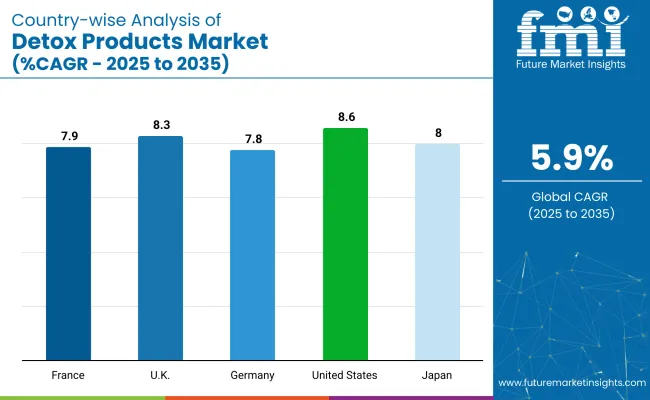
USA leads with the highest projected CAGR of 8.6% from 2025 to 2035, fueled by rising health consciousness, increasing incidence of lifestyle-related disorders, and a strong shift toward natural and organic detox solutions. While, developed economies such as the USA (8.6% CAGR), UK (8.3%), and Japan (8%) are expanding at a steady 1.37-1.41x of the global growth rate.

Japan leads with its strong heritage in matcha, sencha, and fermented probiotic detox beverages, aligning with preventive health and longevity trends. Germany and France leverage their robust herbal and organic tea markets, with EU directives accelerating natural product adoption. The USA market emphasizes detox supplements, teas, and influencer-driven juice cleanses, while the UK focuses on organic herbal teas and wellness tonics. As the market adds over USD 31.87 billion globally by 2035, both tradition-led and innovation-driven regions will shape long-term demand.

The report covers in-depth analysis of 40 plus countries; five top-performing OECD countries are highlighted below.

Growth Outlook for Detox Products in Japan

The sales of detox products in Japan are projected to grow at a CAGR of 8% from 2025 to 2035. Growth is driven by cultural emphasis on preventive health, traditional teas, and fermented probiotic drinks.

  • High demand in matcha, sencha, and probiotic beverages.
  • Preference for clean-label and fermented detox drinks.

In-depth Analysis of Detox Products Demand in Germany

The Germany detox products revenue is projected to grow at a CAGR of 7.8% during the forecast period. EU organic certifications, herbal traditions, and clean-label consumer expectations are pushing adoption of detox teas and supplements.

  • Strong EU compliance for clean-label and organic detox.
  • Focus on herbal teas and premium supplements.

Demand Trajectory for Industrial Detox Products in France

The demand for detox products in France is projected to grow at a 7.9% CAGR during the forecast period. Demand is driven by national health awareness campaigns, organic certification mandates, and consumer preference for herbal detox teas.

  • Modular formulations preferred for herbal infusions.
  • High adoption in digestion and immunity detox segments.

Detox Products Sales Analysis in the USA

The USA detox products market is projected to grow at 8.6% CAGR from 2025 to 2035. High-purity detox drinks are in demand in health-conscious urban populations, while supermarkets and e-commerce platforms remain major sales channels.

  • Strong demand for detox juices, teas, and supplements.
  • Influencer-led marketing drives awareness and sales.

Detox Products Trends in the UK

The UK detox products revenue is projected to grow at a CAGR of 8.3% from 2025 to 2035. Growth is supported by a preference for organic herbal teas, traditional remedies, and clean-label wellness beverages.

  • Focus on herbal teas and clean-label functional drinks.
  • Supermarket and specialty retail drive accessibility.

Leading Detox Products Suppliers and Manufacturers

The market is moderately consolidated, with leading players like Herbalife International Inc., Amway Corporation, Glanbia Plc, Nature’s Sunshine Products Inc., and Mallinckrodt PLC dominating the industry. These companies provide a diverse range of detox teas, supplements, juices, and powders catering to consumers seeking weight management, digestive health, and overall wellness benefits. Herbalife International Inc. focuses on herbal detox teas and weight management products, while Amway Corporation specializes in natural dietary supplements and functional beverages.

These players deliver protein-enriched detox powders and performance nutrition solutions and offers herbal detox supplements targeting digestion and liver health. Other key players like Sun Pharmaceutical Industries Ltd., Mylan N.V., Teva Pharmaceutical Industries Ltd., Novartis AG, and Biodelivery Sciences International Inc. contribute by providing advanced health products, supplements, and therapies supporting detoxification and wellness needs across global markets.

Recent Detox Products Industry News

  • In March 2025, Herbalife Ltd. announced a binding memorandum of understanding to acquire all assets of Pro2col Health LLC and Pruvit Ventures, Inc. and to obtain a 51% controlling stake in Link BioSciences Inc., expanding its health and wellness portfolio.
  • In April 2024, Glanbia plc entered into an agreement to acquire Flavor Producers LLC from Aroma Holding Company shareholders for initial consideration of USD 300 million plus deferred consideration, enhancing nutrition ingredient offerings while strengthening position in flavor and performance markets.

Detox Products Market Report Scope

Report Attributes Details
Market Size (2025) USD 40.7 billion
Projected Market Size (2035) USD 72.6 billion
CAGR (2025 to 2035) 5.9%
Base Year for Estimation 2024
Historical Period 2020 to 2024
Projections Period 2025 to 2035
Report Parameter USD billion for value/volume in units
Product Type Analyzed Detox Teas, Detox Juices and Smoothies, Detox Supplements and Powders, and Coffees
Nature Analyzed Organic, Regular, and Decaffeinated
Sales Channel Analyzed Hypermarkets/Supermarkets, Convenience Stores, Pharmacy and Drugstores, Grocery Stores, Food Specialty Stores, and Online Retail
Regions Covered North America, Latin America, Western Europe, Eastern Europe, East Asia, South Asia & Pacific, and Middle East & Africa
Countries Covered United States, Canada, Brazil, United Kingdom, Germany, France, Italy, China, Japan, India, South Korea, Australia
Key Players Influencing the Market Herbalife International Inc., Amway Corporation, Glanbia Plc, Nature’s Sunshine Products Inc., Mallinckrodt PLC., Sun Pharmaceutical Industries Ltd., Mylan N.V., Teva Pharmaceutical Industries Ltd., Novartis AG, Biodelivery Sciences International Inc.
Additional Attributes Dollar sales by product type, share by nature, regional demand growth, policy influence, clean-label trends, competitive benchmarking

Key Segments

By Product Type:

The segment includes detox teas, juices and smoothies, supplements and powders, and coffees.

By Sales Channel:

The diverse sales channels of detox products are supermarkets/hypermarkets, convenience stores, pharmacy and drugstores, grocery stores, food specialty stores, and online retail.

By Nature:

Detox products are found in organic, regular, and decaffeinated nature.

By Region:

Information about the leading countries of North America, Latin America, Western Europe, South Asia and Pacific, East Asia, and the Middle East and Africa is given.

Table of Content

  1. Executive Summary
    • Global Market Outlook
    • Demand-side Trends
    • Supply-side Trends
    • Technology Roadmap Analysis
    • Analysis and Recommendations
  2. Market Overview
    • Market Coverage / Taxonomy
    • Market Definition / Scope / Limitations
  3. Market Background
    • Market Dynamics
      • Drivers
      • Restraints
      • Opportunity
      • Trends
    • Scenario Forecast
      • Demand in Optimistic Scenario
      • Demand in Likely Scenario
      • Demand in Conservative Scenario
    • Opportunity Map Analysis
    • Product Life Cycle Analysis
    • Supply Chain Analysis
      • Supply Side Participants and their Roles
        • Producers
        • Mid-Level Participants (Traders/ Agents/ Brokers)
        • Wholesalers and Distributors
      • Value Added and Value Created at Node in the Supply Chain
      • List of Raw Material Suppliers
      • List of Existing and Potential Buyer’s
    • Investment Feasibility Matrix
    • Value Chain Analysis
      • Profit Margin Analysis
      • Wholesalers and Distributors
      • Retailers
    • PESTLE and Porter’s Analysis
    • Regulatory Landscape
      • By Key Regions
      • By Key Countries
    • Regional Parent Market Outlook
    • Production and Consumption Statistics
    • Import and Export Statistics
  4. Global Market Analysis 2020 to 2024 and Forecast, 2025 to 2035
    • Historical Market Size Value (USD Billion) & Volume (Units) Analysis, 2020 to 2024
    • Current and Future Market Size Value (USD Billion) & Volume (Units) Projections, 2025 to 2035
      • Y-o-Y Growth Trend Analysis
      • Absolute $ Opportunity Analysis
  5. Global Market Pricing Analysis 2020 to 2024 and Forecast 2025 to 2035
  6. Global Market Analysis 2020 to 2024 and Forecast 2025 to 2035, By Product Type
    • Introduction / Key Findings
    • Historical Market Size Value (USD Billion) & Volume (Units) Analysis By Product Type, 2020 to 2024
    • Current and Future Market Size Value (USD Billion) & Volume (Units) Analysis and Forecast By Product Type, 2025 to 2035
      • Detox Teas
      • Detox Juices and Smoothies
      • Detox Supplements and Powders
      • Coffees
    • Y-o-Y Growth Trend Analysis By Product Type, 2020 to 2024
    • Absolute $ Opportunity Analysis By Product Type, 2025 to 2035
  7. Global Market Analysis 2020 to 2024 and Forecast 2025 to 2035, By Nature
    • Introduction / Key Findings
    • Historical Market Size Value (USD Billion) & Volume (Units) Analysis By Nature, 2020 to 2024
    • Current and Future Market Size Value (USD Billion) & Volume (Units) Analysis and Forecast By Nature, 2025 to 2035
      • Organic
      • Regular
      • Decaffeinated
    • Y-o-Y Growth Trend Analysis By Nature, 2020 to 2024
    • Absolute $ Opportunity Analysis By Nature, 2025 to 2035
  8. Global Market Analysis 2020 to 2024 and Forecast 2025 to 2035, By Sales Channel
    • Introduction / Key Findings
    • Historical Market Size Value (USD Billion) & Volume (Units) Analysis By Sales Channel, 2020 to 2024
    • Current and Future Market Size Value (USD Billion) & Volume (Units) Analysis and Forecast By Sales Channel, 2025 to 2035
      • Hypermarkets/Supermarkets
      • Convenience Stores
      • Pharmacy and Drugstores
      • Grocery Stores
      • Food Specialty Stores
      • Online Retail
    • Y-o-Y Growth Trend Analysis By Sales Channel, 2020 to 2024
    • Absolute $ Opportunity Analysis By Sales Channel, 2025 to 2035
  9. Global Market Analysis 2020 to 2024 and Forecast 2025 to 2035, By Region
    • Introduction
    • Historical Market Size Value (USD Billion) & Volume (Units) Analysis By Region, 2020 to 2024
    • Current Market Size Value (USD Billion) & Volume (Units) Analysis and Forecast By Region, 2025 to 2035
      • North America
      • Latin America
      • Western Europe
      • Eastern Europe
      • East Asia
      • South Asia & Pacific
      • Middle East and Africa
    • Market Attractiveness Analysis By Region
  10. North America Market Analysis 2020 to 2024 and Forecast 2025 to 2035, By Country
    • Historical Market Size Value (USD Billion) & Volume (Units) Trend Analysis By Market Taxonomy, 2020 to 2024
    • Market Size Value (USD Billion) & Volume (Units) Forecast By Market Taxonomy, 2025 to 2035
      • By Country
        • USA
        • Canada
        • Mexico
      • By Product Type
      • By Nature
      • By Sales Channel
    • Market Attractiveness Analysis
      • By Country
      • By Product Type
      • By Nature
      • By Sales Channel
    • Key Takeaways
  11. Latin America Market Analysis 2020 to 2024 and Forecast 2025 to 2035, By Country
    • Historical Market Size Value (USD Billion) & Volume (Units) Trend Analysis By Market Taxonomy, 2020 to 2024
    • Market Size Value (USD Billion) & Volume (Units) Forecast By Market Taxonomy, 2025 to 2035
      • By Country
        • Brazil
        • Argentina
        • Rest of LATAM
      • By Product Type
      • By Nature
      • By Sales Channel
    • Market Attractiveness Analysis
      • By Country
      • By Product Type
      • By Nature
      • By Sales Channel
    • Key Takeaways
  12. Western Europe Market Analysis 2020 to 2024 and Forecast 2025 to 2035, By Country
    • Historical Market Size Value (USD Billion) & Volume (Units) Trend Analysis By Market Taxonomy, 2020 to 2024
    • Market Size Value (USD Billion) & Volume (Units) Forecast By Market Taxonomy, 2025 to 2035
      • By Country
        • Germany
        • Italy
        • France
        • UK
        • Spain
        • BENELUX
        • Nordic
        • Rest of W.Europe
      • By Product Type
      • By Nature
      • By Sales Channel
    • Market Attractiveness Analysis
      • By Country
      • By Product Type
      • By Nature
      • By Sales Channel
    • Key Takeaways
  13. Eastern Europe Market Analysis 2020 to 2024 and Forecast 2025 to 2035, By Country
    • Historical Market Size Value (USD Billion) & Volume (Units) Trend Analysis By Market Taxonomy, 2020 to 2024
    • Market Size Value (USD Billion) & Volume (Units) Forecast By Market Taxonomy, 2025 to 2035
      • By Country
        • Russia
        • Hungary
        • Poland
        • Balkan & Baltics
        • Rest of E. Europe
      • By Product Type
      • By Nature
      • By Sales Channel
    • Market Attractiveness Analysis
      • By Country
      • By Product Type
      • By Nature
      • By Sales Channel
    • Key Takeaways
  14. East Asia Market Analysis 2020 to 2024 and Forecast 2025 to 2035, By Country
    • Historical Market Size Value (USD Billion) & Volume (Units) Trend Analysis By Market Taxonomy, 2020 to 2024
    • Market Size Value (USD Billion) & Volume (Units) Forecast By Market Taxonomy, 2025 to 2035
      • By Country
        • China
        • Japan
        • South Korea
      • By Product Type
      • By Nature
      • By Sales Channel
    • Market Attractiveness Analysis
      • By Country
      • By Product Type
      • By Nature
      • By Sales Channel
    • Key Takeaways
  15. South Asia & Pacific Market Analysis 2020 to 2024 and Forecast 2025 to 2035, By Country
    • Historical Market Size Value (USD Billion) & Volume (Units) Trend Analysis By Market Taxonomy, 2020 to 2024
    • Market Size Value (USD Billion) & Volume (Units) Forecast By Market Taxonomy, 2025 to 2035
      • By Country
        • India
        • Australia & New Zealand
        • ASEAN
        • Rest of SAP
      • By Product Type
      • By Nature
      • By Sales Channel
    • Market Attractiveness Analysis
      • By Country
      • By Product Type
      • By Nature
      • By Sales Channel
    • Key Takeaways
  16. Middle East and Africa Market Analysis 2020 to 2024 and Forecast 2025 to 2035, By Country
    • Historical Market Size Value (USD Billion) & Volume (Units) Trend Analysis By Market Taxonomy, 2020 to 2024
    • Market Size Value (USD Billion) & Volume (Units) Forecast By Market Taxonomy, 2025 to 2035
      • By Country
        • GCC Countries
        • Northern Africa
        • South Africa
        • Turkiye
        • Rest of MEA
      • By Product Type
      • By Nature
      • By Sales Channel
    • Market Attractiveness Analysis
      • By Country
      • By Product Type
      • By Nature
      • By Sales Channel
    • Key Takeaways
  17. Key Countries Market Analysis
    • USA
      • Pricing Analysis
      • Market Share Analysis, 2024
        • By Product Type
        • By Nature
        • By Sales Channel
    • Canada
      • Pricing Analysis
      • Market Share Analysis, 2024
        • By Product Type
        • By Nature
        • By Sales Channel
    • Brazil
      • Pricing Analysis
      • Market Share Analysis, 2024
        • By Product Type
        • By Nature
        • By Sales Channel
    • Mexico
      • Pricing Analysis
      • Market Share Analysis, 2024
        • By Product Type
        • By Nature
        • By Sales Channel
    • Argentina
      • Pricing Analysis
      • Market Share Analysis, 2024
        • By Product Type
        • By Nature
        • By Sales Channel
  18. Market Structure Analysis
    • Competition Dashboard
    • Competition Benchmarking
    • Market Share Analysis of Top Players
      • By Regional
      • By Product Type
      • By Nature
      • By Sales Channel
  19. Competition Analysis
    • Competition Deep Dive
      • Herbalife International Inc.
        • Overview
        • Product Portfolio
        • Profitability by Market Segments (Product/Age /Sales Channel/Region)
        • Sales Footprint
        • Strategy Overview
          • Marketing Strategy
          • Product Strategy
          • Channel Strategy
      • Amway Corporation
        • Overview
        • Product Portfolio
        • Profitability by Market Segments (Product/Age /Sales Channel/Region)
        • Sales Footprint
        • Strategy Overview
          • Marketing Strategy
          • Product Strategy
          • Channel Strategy
      • Glanbia Plc
        • Overview
        • Product Portfolio
        • Profitability by Market Segments (Product/Age /Sales Channel/Region)
        • Sales Footprint
        • Strategy Overview
          • Marketing Strategy
          • Product Strategy
          • Channel Strategy
      • Nature’s Sunshine Products Inc.
        • Overview
        • Product Portfolio
        • Profitability by Market Segments (Product/Age /Sales Channel/Region)
        • Sales Footprint
        • Strategy Overview
          • Marketing Strategy
          • Product Strategy
          • Channel Strategy
      • Mallinckrodt PLC
        • Overview
        • Product Portfolio
        • Profitability by Market Segments (Product/Age /Sales Channel/Region)
        • Sales Footprint
        • Strategy Overview
          • Marketing Strategy
          • Product Strategy
          • Channel Strategy
      • Sun Pharmaceutical Industries Ltd
        • Overview
        • Product Portfolio
        • Profitability by Market Segments (Product/Age /Sales Channel/Region)
        • Sales Footprint
        • Strategy Overview
          • Marketing Strategy
          • Product Strategy
          • Channel Strategy
      • Mylan N.V.
        • Overview
        • Product Portfolio
        • Profitability by Market Segments (Product/Age /Sales Channel/Region)
        • Sales Footprint
        • Strategy Overview
          • Marketing Strategy
          • Product Strategy
          • Channel Strategy
      • Teva Pharmaceutical Industries Ltd
        • Overview
        • Product Portfolio
        • Profitability by Market Segments (Product/Age /Sales Channel/Region)
        • Sales Footprint
        • Strategy Overview
          • Marketing Strategy
          • Product Strategy
          • Channel Strategy
      • Novartis AG
        • Overview
        • Product Portfolio
        • Profitability by Market Segments (Product/Age /Sales Channel/Region)
        • Sales Footprint
        • Strategy Overview
          • Marketing Strategy
          • Product Strategy
          • Channel Strategy
      • Biodelivery Sciences International Inc.
        • Overview
        • Product Portfolio
        • Profitability by Market Segments (Product/Age /Sales Channel/Region)
        • Sales Footprint
        • Strategy Overview
          • Marketing Strategy
          • Product Strategy
          • Channel Strategy
  20. Assumptions & Acronyms Used
  21. Research Methodology

List of Tables

  • Table 1: Global Market Value (USD Billion) Forecast by Region, 2020-2035
  • Table 2: Global Market Volume (Units) Forecast by Region, 2020-2035
  • Table 3: Global Market Value (USD Billion) Forecast by Product Type, 2020-2035
  • Table 4: Global Market Volume (Units) Forecast by Product Type, 2020-2035
  • Table 5: Global Market Value (USD Billion) Forecast by Nature, 2020-2035
  • Table 6: Global Market Volume (Units) Forecast by Nature, 2020-2035
  • Table 7: Global Market Value (USD Billion) Forecast by Sales Channel, 2020-2035
  • Table 8: Global Market Volume (Units) Forecast by Sales Channel, 2020-2035
  • Table 9: North America Market Value (USD Billion) Forecast by Country, 2020-2035
  • Table 10: North America Market Volume (Units) Forecast by Country, 2020-2035
  • Table 11: North America Market Value (USD Billion) Forecast by Product Type, 2020-2035
  • Table 12: North America Market Volume (Units) Forecast by Product Type, 2020-2035
  • Table 13: North America Market Value (USD Billion) Forecast by Nature, 2020-2035
  • Table 14: North America Market Volume (Units) Forecast by Nature, 2020-2035
  • Table 15: North America Market Value (USD Billion) Forecast by Sales Channel, 2020-2035
  • Table 16: North America Market Volume (Units) Forecast by Sales Channel, 2020-2035
  • Table 17: Latin America Market Value (USD Billion) Forecast by Country, 2020-2035
  • Table 18: Latin America Market Volume (Units) Forecast by Country, 2020-2035
  • Table 19: Latin America Market Value (USD Billion) Forecast by Product Type, 2020-2035
  • Table 20: Latin America Market Volume (Units) Forecast by Product Type, 2020-2035
  • Table 21: Latin America Market Value (USD Billion) Forecast by Nature, 2020-2035
  • Table 22: Latin America Market Volume (Units) Forecast by Nature, 2020-2035
  • Table 23: Latin America Market Value (USD Billion) Forecast by Sales Channel, 2020-2035
  • Table 24: Latin America Market Volume (Units) Forecast by Sales Channel, 2020-2035
  • Table 25: Western Europe Market Value (USD Billion) Forecast by Country, 2020-2035
  • Table 26: Western Europe Market Volume (Units) Forecast by Country, 2020-2035
  • Table 27: Western Europe Market Value (USD Billion) Forecast by Product Type, 2020-2035
  • Table 28: Western Europe Market Volume (Units) Forecast by Product Type, 2020-2035
  • Table 29: Western Europe Market Value (USD Billion) Forecast by Nature, 2020-2035
  • Table 30: Western Europe Market Volume (Units) Forecast by Nature, 2020-2035
  • Table 31: Western Europe Market Value (USD Billion) Forecast by Sales Channel, 2020-2035
  • Table 32: Western Europe Market Volume (Units) Forecast by Sales Channel, 2020-2035
  • Table 33: Eastern Europe Market Value (USD Billion) Forecast by Country, 2020-2035
  • Table 34: Eastern Europe Market Volume (Units) Forecast by Country, 2020-2035
  • Table 35: Eastern Europe Market Value (USD Billion) Forecast by Product Type, 2020-2035
  • Table 36: Eastern Europe Market Volume (Units) Forecast by Product Type, 2020-2035
  • Table 37: Eastern Europe Market Value (USD Billion) Forecast by Nature, 2020-2035
  • Table 38: Eastern Europe Market Volume (Units) Forecast by Nature, 2020-2035
  • Table 39: Eastern Europe Market Value (USD Billion) Forecast by Sales Channel, 2020-2035
  • Table 40: Eastern Europe Market Volume (Units) Forecast by Sales Channel, 2020-2035
  • Table 41: East Asia Market Value (USD Billion) Forecast by Country, 2020-2035
  • Table 42: East Asia Market Volume (Units) Forecast by Country, 2020-2035
  • Table 43: East Asia Market Value (USD Billion) Forecast by Product Type, 2020-2035
  • Table 44: East Asia Market Volume (Units) Forecast by Product Type, 2020-2035
  • Table 45: East Asia Market Value (USD Billion) Forecast by Nature, 2020-2035
  • Table 46: East Asia Market Volume (Units) Forecast by Nature, 2020-2035
  • Table 47: East Asia Market Value (USD Billion) Forecast by Sales Channel, 2020-2035
  • Table 48: East Asia Market Volume (Units) Forecast by Sales Channel, 2020-2035
  • Table 49: South Asia & Pacific Market Value (USD Billion) Forecast by Country, 2020-2035
  • Table 50: South Asia & Pacific Market Volume (Units) Forecast by Country, 2020-2035
  • Table 51: South Asia & Pacific Market Value (USD Billion) Forecast by Product Type, 2020-2035
  • Table 52: South Asia & Pacific Market Volume (Units) Forecast by Product Type, 2020-2035
  • Table 53: South Asia & Pacific Market Value (USD Billion) Forecast by Nature, 2020-2035
  • Table 54: South Asia & Pacific Market Volume (Units) Forecast by Nature, 2020-2035
  • Table 55: South Asia & Pacific Market Value (USD Billion) Forecast by Sales Channel, 2020-2035
  • Table 56: South Asia & Pacific Market Volume (Units) Forecast by Sales Channel, 2020-2035
  • Table 57: Middle East and Africa Market Value (USD Billion) Forecast by Country, 2020-2035
  • Table 58: Middle East and Africa Market Volume (Units) Forecast by Country, 2020-2035
  • Table 59: Middle East and Africa Market Value (USD Billion) Forecast by Product Type, 2020-2035
  • Table 60: Middle East and Africa Market Volume (Units) Forecast by Product Type, 2020-2035
  • Table 61: Middle East and Africa Market Value (USD Billion) Forecast by Nature, 2020-2035
  • Table 62: Middle East and Africa Market Volume (Units) Forecast by Nature, 2020-2035
  • Table 63: Middle East and Africa Market Value (USD Billion) Forecast by Sales Channel, 2020-2035
  • Table 64: Middle East and Africa Market Volume (Units) Forecast by Sales Channel, 2020-2035

List of Figures

  • Figure 1: Global Market Volume (Units) Forecast 2020-2035
  • Figure 2: Global Market Pricing Analysis
  • Figure 3: Global Market Value (USD Billion) Forecast 2020-2035
  • Figure 4: Global Market Value Share and BPS Analysis by Product Type, 2025 and 2035
  • Figure 5: Global Market Y-o-Y Growth Comparison by Product Type, 2025-2035
  • Figure 6: Global Market Attractiveness Analysis by Product Type
  • Figure 7: Global Market Value Share and BPS Analysis by Nature, 2025 and 2035
  • Figure 8: Global Market Y-o-Y Growth Comparison by Nature, 2025-2035
  • Figure 9: Global Market Attractiveness Analysis by Nature
  • Figure 10: Global Market Value Share and BPS Analysis by Sales Channel, 2025 and 2035
  • Figure 11: Global Market Y-o-Y Growth Comparison by Sales Channel, 2025-2035
  • Figure 12: Global Market Attractiveness Analysis by Sales Channel
  • Figure 13: Global Market Value (USD Billion) Share and BPS Analysis by Region, 2025 and 2035
  • Figure 14: Global Market Y-o-Y Growth Comparison by Region, 2025-2035
  • Figure 15: Global Market Attractiveness Analysis by Region
  • Figure 16: North America Market Incremental $ Opportunity, 2025-2035
  • Figure 17: Latin America Market Incremental $ Opportunity, 2025-2035
  • Figure 18: Western Europe Market Incremental $ Opportunity, 2025-2035
  • Figure 19: Eastern Europe Market Incremental $ Opportunity, 2025-2035
  • Figure 20: East Asia Market Incremental $ Opportunity, 2025-2035
  • Figure 21: South Asia & Pacific Market Incremental $ Opportunity, 2025-2035
  • Figure 22: Middle East and Africa Market Incremental $ Opportunity, 2025-2035
  • Figure 23: North America Market Value Share and BPS Analysis by Country, 2025 and 2035
  • Figure 24: North America Market Value Share and BPS Analysis by Product Type, 2025 and 2035
  • Figure 25: North America Market Y-o-Y Growth Comparison by Product Type, 2025-2035
  • Figure 26: North America Market Attractiveness Analysis by Product Type
  • Figure 27: North America Market Value Share and BPS Analysis by Nature, 2025 and 2035
  • Figure 28: North America Market Y-o-Y Growth Comparison by Nature, 2025-2035
  • Figure 29: North America Market Attractiveness Analysis by Nature
  • Figure 30: North America Market Value Share and BPS Analysis by Sales Channel, 2025 and 2035
  • Figure 31: North America Market Y-o-Y Growth Comparison by Sales Channel, 2025-2035
  • Figure 32: North America Market Attractiveness Analysis by Sales Channel
  • Figure 33: Latin America Market Value Share and BPS Analysis by Country, 2025 and 2035
  • Figure 34: Latin America Market Value Share and BPS Analysis by Product Type, 2025 and 2035
  • Figure 35: Latin America Market Y-o-Y Growth Comparison by Product Type, 2025-2035
  • Figure 36: Latin America Market Attractiveness Analysis by Product Type
  • Figure 37: Latin America Market Value Share and BPS Analysis by Nature, 2025 and 2035
  • Figure 38: Latin America Market Y-o-Y Growth Comparison by Nature, 2025-2035
  • Figure 39: Latin America Market Attractiveness Analysis by Nature
  • Figure 40: Latin America Market Value Share and BPS Analysis by Sales Channel, 2025 and 2035
  • Figure 41: Latin America Market Y-o-Y Growth Comparison by Sales Channel, 2025-2035
  • Figure 42: Latin America Market Attractiveness Analysis by Sales Channel
  • Figure 43: Western Europe Market Value Share and BPS Analysis by Country, 2025 and 2035
  • Figure 44: Western Europe Market Value Share and BPS Analysis by Product Type, 2025 and 2035
  • Figure 45: Western Europe Market Y-o-Y Growth Comparison by Product Type, 2025-2035
  • Figure 46: Western Europe Market Attractiveness Analysis by Product Type
  • Figure 47: Western Europe Market Value Share and BPS Analysis by Nature, 2025 and 2035
  • Figure 48: Western Europe Market Y-o-Y Growth Comparison by Nature, 2025-2035
  • Figure 49: Western Europe Market Attractiveness Analysis by Nature
  • Figure 50: Western Europe Market Value Share and BPS Analysis by Sales Channel, 2025 and 2035
  • Figure 51: Western Europe Market Y-o-Y Growth Comparison by Sales Channel, 2025-2035
  • Figure 52: Western Europe Market Attractiveness Analysis by Sales Channel
  • Figure 53: Eastern Europe Market Value Share and BPS Analysis by Country, 2025 and 2035
  • Figure 54: Eastern Europe Market Value Share and BPS Analysis by Product Type, 2025 and 2035
  • Figure 55: Eastern Europe Market Y-o-Y Growth Comparison by Product Type, 2025-2035
  • Figure 56: Eastern Europe Market Attractiveness Analysis by Product Type
  • Figure 57: Eastern Europe Market Value Share and BPS Analysis by Nature, 2025 and 2035
  • Figure 58: Eastern Europe Market Y-o-Y Growth Comparison by Nature, 2025-2035
  • Figure 59: Eastern Europe Market Attractiveness Analysis by Nature
  • Figure 60: Eastern Europe Market Value Share and BPS Analysis by Sales Channel, 2025 and 2035
  • Figure 61: Eastern Europe Market Y-o-Y Growth Comparison by Sales Channel, 2025-2035
  • Figure 62: Eastern Europe Market Attractiveness Analysis by Sales Channel
  • Figure 63: East Asia Market Value Share and BPS Analysis by Country, 2025 and 2035
  • Figure 64: East Asia Market Value Share and BPS Analysis by Product Type, 2025 and 2035
  • Figure 65: East Asia Market Y-o-Y Growth Comparison by Product Type, 2025-2035
  • Figure 66: East Asia Market Attractiveness Analysis by Product Type
  • Figure 67: East Asia Market Value Share and BPS Analysis by Nature, 2025 and 2035
  • Figure 68: East Asia Market Y-o-Y Growth Comparison by Nature, 2025-2035
  • Figure 69: East Asia Market Attractiveness Analysis by Nature
  • Figure 70: East Asia Market Value Share and BPS Analysis by Sales Channel, 2025 and 2035
  • Figure 71: East Asia Market Y-o-Y Growth Comparison by Sales Channel, 2025-2035
  • Figure 72: East Asia Market Attractiveness Analysis by Sales Channel
  • Figure 73: South Asia & Pacific Market Value Share and BPS Analysis by Country, 2025 and 2035
  • Figure 74: South Asia & Pacific Market Value Share and BPS Analysis by Product Type, 2025 and 2035
  • Figure 75: South Asia & Pacific Market Y-o-Y Growth Comparison by Product Type, 2025-2035
  • Figure 76: South Asia & Pacific Market Attractiveness Analysis by Product Type
  • Figure 77: South Asia & Pacific Market Value Share and BPS Analysis by Nature, 2025 and 2035
  • Figure 78: South Asia & Pacific Market Y-o-Y Growth Comparison by Nature, 2025-2035
  • Figure 79: South Asia & Pacific Market Attractiveness Analysis by Nature
  • Figure 80: South Asia & Pacific Market Value Share and BPS Analysis by Sales Channel, 2025 and 2035
  • Figure 81: South Asia & Pacific Market Y-o-Y Growth Comparison by Sales Channel, 2025-2035
  • Figure 82: South Asia & Pacific Market Attractiveness Analysis by Sales Channel
  • Figure 83: Middle East and Africa Market Value Share and BPS Analysis by Country, 2025 and 2035
  • Figure 84: Middle East and Africa Market Value Share and BPS Analysis by Product Type, 2025 and 2035
  • Figure 85: Middle East and Africa Market Y-o-Y Growth Comparison by Product Type, 2025-2035
  • Figure 86: Middle East and Africa Market Attractiveness Analysis by Product Type
  • Figure 87: Middle East and Africa Market Value Share and BPS Analysis by Nature, 2025 and 2035
  • Figure 88: Middle East and Africa Market Y-o-Y Growth Comparison by Nature, 2025-2035
  • Figure 89: Middle East and Africa Market Attractiveness Analysis by Nature
  • Figure 90: Middle East and Africa Market Value Share and BPS Analysis by Sales Channel, 2025 and 2035
  • Figure 91: Middle East and Africa Market Y-o-Y Growth Comparison by Sales Channel, 2025-2035
  • Figure 92: Middle East and Africa Market Attractiveness Analysis by Sales Channel
  • Figure 93: Global Market - Tier Structure Analysis
  • Figure 94: Global Market - Company Share Analysis

Frequently Asked Questions

What is the projected size of the detox products market in 2025?

The market is valued at USD 40.7 billion in 2025.

What is the outlook on detox products demand by 2035?

The market is forecast to reach USD 72.6 billion by 2035, reflecting a CAGR of 5.9%.

Which segment leads the detox products market by sales channel in 2025?

Supermarkets and hypermarkets will lead the sales channel segment, accounting for 31% of the global market share in 2025.

What is the top nature segment for the detox products market in 2025?

Organic detox products will dominate the nature segment with a 35% share in 2025.

Which country is projected to have the fastest-growing detox products market?

The USA is anticipated to be the fastest-growing market, with a CAGR of 8.6% from 2025 to 2035.

Explore Similar Insights

Future Market Insights

Detox Products Market

Chat With

MaRIA

Hi There, I am MaRIA, Your Market Research Intelligence Assistant. How may I help you?