Feed Mycotoxin Detoxifiers Market Size, Share, and Forecast Outlook 2025 to 2035

The feed mycotoxin detoxifiers market is estimated to be worth USD 2.1 billion in 2025 and is projected to reach a value of USD 3.8 billion by 2035, expanding at a CAGR of 6.2% over the assessment period of 2025 to 2035. Producers are increasing inclusion rates of detoxifiers in feed rations to counter the impact of aflatoxins, deoxynivalenol, and fumonisins that compromise gut health and reduce weight gain.
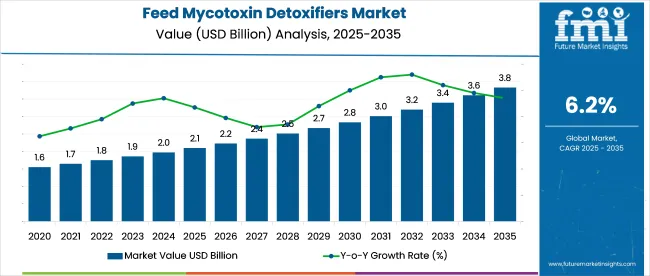
Quick Stats in Feed Mycotoxin Detoxifiers Market

  • Market Size (2025): USD 2.1 billion
  • Market Forecast (2035): USD 3.8 billion
  • CAGR (2025 to 2035): 6.2%
  • Top Type Segment: Mycotoxin Binders (38% share in 2025)
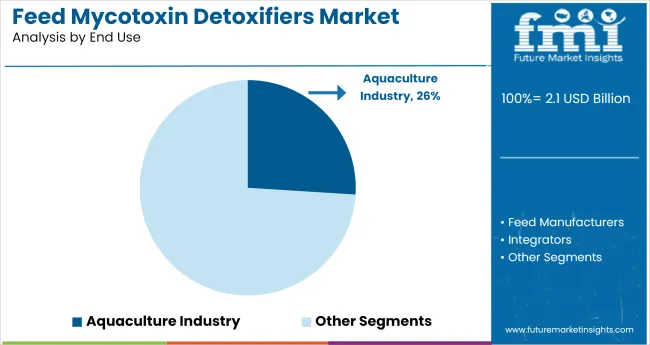
  • Leading End Use: Aquaculture Industry (26% share in 2025)
  • Top Growing Country: India (7.4% CAGR)

Feed Mycotoxin Detoxifiers Market Market Value Analysis

Attributes Description
Estimated Industry Size (2025E) USD 2.1 billion
Projected Industry Value (2035F) USD 3.8 billion
Value-based CAGR (2025 to 2035) 6.2%

In Europe and parts of Asia, over 60% of feed-grade corn and wheat now show detectable mycotoxin levels, pushing integrators to adopt multi-component detoxifier blends. These blends often combine organic binders, yeast cell walls, and enzymatic agents to ensure broader efficacy across toxin classes.

Dairy and poultry operations are leading consumption due to the higher economic losses linked to mycotoxin-induced fertility drops and poor feed efficiency. Feed mills are integrating detoxifiers into base concentrates for broader use across regions with fluctuating raw material quality. Precision dosing systems are also improving application consistency, further encouraging adoption across industrial-scale livestock enterprises.

As of 2025, the feed mycotoxin detoxifiers market is viewed as a focused niche within the broader animal feed industry. It accounts for around 2-3% of the global feed additives market, supported by rising concerns about toxin contamination in livestock diets. Within the overall animal nutrition sector, its share is estimated at 1.5-2.5%, as producers look to minimize performance losses due to contaminated feed.

About 2-3% of the livestock feed market uses detoxifiers, especially in poultry and swine diets. In aquaculture, close to 1-2% of feed formulations include detox agents to manage risks in fish and shrimp production. Its share in the specialty feed ingredients segment is pegged at 3-4%, owing to its targeted role in high-efficiency formulations.

Analyzing Feed Mycotoxin Detoxifiers Market by Top Investment Segments

The market is gaining traction across poultry and aquaculture sectors, supported by rising concerns over contaminated feed and livestock health. Growth is further fueled by increased demand for mycotoxin binders, distribution expansion through hypermarkets, and a shift toward safe, performance-boosting additives in animal diets.
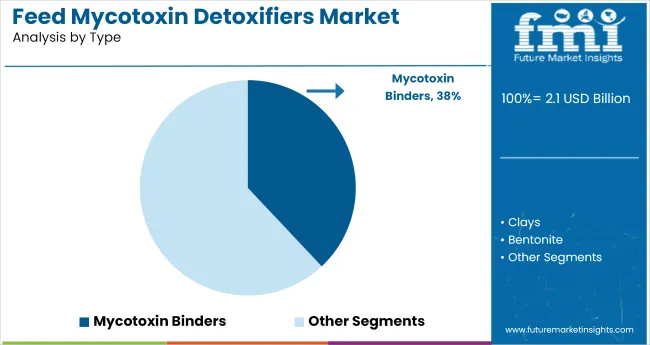
Mycotoxin Binders Lead the Detoxifier Type Category with 38% Market Share

Feed Mycotoxin Detoxifiers Market Analysis By Type

Mycotoxin binders are forecasted to dominate the type category, securing 38% share of the global feed mycotoxin detoxifiers market by 2025. These agents play a critical role in neutralizing harmful fungal toxins that compromise feed safety and animal health. Their cost-effectiveness and ease of integration into existing feed formulations are driving rapid adoption across livestock producers worldwide.
  • Binders such as bentonite and activated carbon are widely used due to their proven toxin absorption capabilities.
  • Feed manufacturers prefer binders for their non-nutritive profile, minimizing any negative nutritional impact.
  • Regulatory support for safe detoxifiers has boosted their inclusion rates, especially in poultry and dairy sectors.

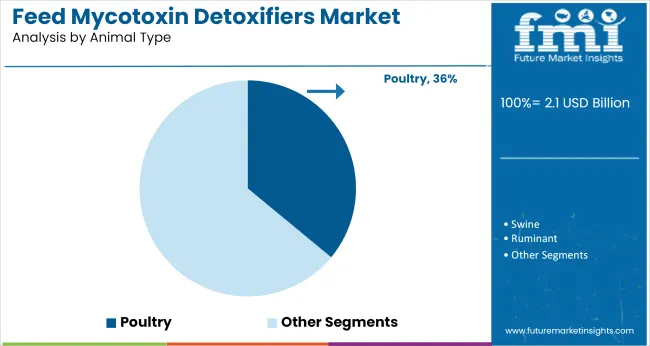
Poultry Segment Tops the Animal Type Category with 36% Share

Feed Mycotoxin Detoxifiers Market Analysis By Animal Type

Poultry is projected to be the leading animal type in the feed mycotoxin detoxifiers market, accounting for 36% share by 2025. The intensive nature of poultry farming and higher sensitivity of chickens to mycotoxins makes detoxifiers essential to maintaining feed safety. Continuous demand for high-protein meat and eggs also amplifies the need for toxin-free rations.
  • Poultry feed is frequently exposed to fungal contamination due to moisture and storage practices.
  • Mycotoxin detoxifiers are widely used in broiler diets to ensure weight gain and immunity.
  • Rising poultry consumption in Asia and Africa is creating a large, recurring demand base.

Aquaculture Industry Drives End-Use Growth with 26% Market Share

Feed Mycotoxin Detoxifiers Market Analysis By End Use

Aquaculture is expected to contribute 26% of total demand for feed mycotoxin detoxifiers by 2025, driven by the growing emphasis on clean feed inputs in fish and shrimp farming. Aquatic species are highly vulnerable to waterborne mycotoxins, necessitating detoxifiers in both pelletized and powdered feed forms.
  • Feed additives tailored for aquaculture ensure better water solubility and bioavailability.
  • Farmers increasingly invest in detoxifiers to avoid disease outbreaks linked to fungal exposure.
  • Rapid expansion of aquafeed production in China and Southeast Asia is fueling segment growth.

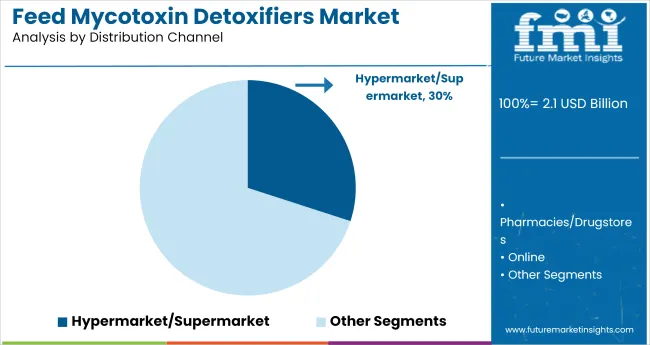
Hypermarkets and Supermarkets Dominate Distribution with 30% Share

Feed Mycotoxin Detoxifiers Market Analysis By Distribution Channel

Hypermarkets and supermarkets are set to capture 30% of the distribution channel share for feed mycotoxin detoxifiers by 2025. These retail formats offer direct access to a wide customer base including small-scale farmers and commercial livestock operators. Product visibility, competitive pricing, and convenience are key factors behind their growing relevance.

  • Prominent brands are expanding retail presence to reach remote agricultural zones.
  • Farmers prefer physical retail outlets for bulk purchasing and brand comparisons.
  • Shelf-ready packaging and promotional discounts enhance buyer engagement across regions.

Top Feed Mycotoxin Detoxifiers Market Dynamics

The market is expanding due to increasing contamination risks linked to climate volatility and poor post-harvest storage. In 2024, over 62% of global compound feed tested positive for multiple mycotoxins.

Growth of Non-Clay-Based and Synergistic Formulations

Smectite and bentonite clays dominate binder applications, but non-clay formulations are gaining ground. Enzyme blends, yeast cell wall extracts, and microbial detoxifiers are being integrated to broaden spectrum and improve gut compatibility. In 2024, biological detoxifiers held 18% market share in EU livestock applications.

  • Enzyme-yeast combinations used to degrade trichothecenes and improve gut health.
  • Non-clay formulations promoted for better nutrient bioavailability.
  • Probiotic-compatible detoxifiers formulated for antibiotic-free feeding programs.

Regulatory Shifts and Residue Concerns Fueling R&D

EU and North American feed regulators are tightening scrutiny over residue accumulation and binding selectivity. The European Food Safety Authority (EFSA) now recommends performance trials for binder efficacy on non-target nutrient binding. As a result, manufacturers are investing in pH-stable binders and targeted biotransformation molecules.
  • EFSA-backed performance trials required for EU binder approvals.
  • pH-stable products designed to retain efficacy throughout GI tract.
  • Focus growing on selective binding to avoid interference with vitamins and minerals.

Top Countries Formulating, Regulating, Integrating, and Supplying Feed Mycotoxin Detoxifiers

Feed Mycotoxin Detoxifiers Market Cagr Analysis By Country

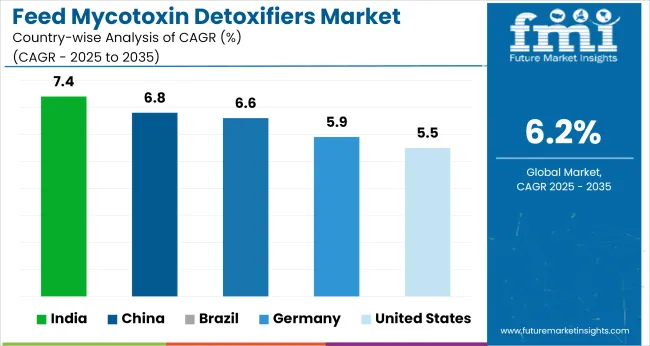
Country CAGR (2025 to 2035)
India 7.4%
China 6.8%
Brazil 6.6%
Germany 5.9%
United States 5.5%

The market is projected to grow at a global CAGR of 6.2% from 2025 to 2035. Among the five leading countries, India (BRICS) reports the highest CAGR at 7.4%, outperforming the global rate by 1.2 percentage points. China (BRICS) follows at 6.8%, benefitting from scaled livestock operations and a steady rise in awareness of mycotoxin contamination.

Brazil (BRICS) records a solid 6.6%, just above the global baseline, supported by the expansion of poultry and ruminant feed industries. Germany (OECD) stands at 5.9%, slightly underperforming by 0.3 points, constrained by regulatory transitions in feed additive classifications.

The USA (OECD) trails at 5.5%, showing a 0.7-point gap versus the global trend, due to slower adoption of advanced detoxifier blends. This spread highlights faster uptake in BRICS economies, where climate-sensitive storage and bulk grain transport increase the risk of mycotoxin presence across supply chains.

The report provides insights across 40+ countries. The five below are highlighted for their strategic influence and growth trajectory.

Market Dynamics for Feed Mycotoxin Detoxifiers in India

India is expected to register a CAGR of 7.4% from 2025 to 2035, positioning itself as a rapidly expanding market for mycotoxin detoxifiers. The high susceptibility of Indian feedstock, especially maize and oilseed cakes, to fungal contamination is driving urgent demand. Monsoon-dependent moisture levels and storage limitations further increase the risk of aflatoxins and fumonisins.

Poultry and dairy sectors, which dominate the country’s livestock output, are adopting toxin binders and enzymatic solutions to protect animal health and performance. Regulatory support and expansion of organized feed production are also accelerating adoption.

  • Widespread occurrence of mycotoxins in poultry and cattle feed
  • Demand for both organic and inorganic toxin binders rising
  • Feed safety rules boosting compliance among integrators

Trends in Feed Mycotoxin Detoxifiers Usage Across China

Expanding at a CAGR of 6.8% through 2035, China’s feed mycotoxin detoxifiers market is gaining strength due to large-scale feed operations and stringent food safety priorities. Feed contamination incidents have driven the uptake of adsorbents, enzyme-based solutions, and advanced deactivation technologies.

Swine and poultry sectors remain the largest consumers, especially in southern regions prone to high humidity and mold growth. Increasing imports of grains and oilseeds have further amplified risk exposure, prompting producers to incorporate detoxifiers in core formulations.

  • Moisture-rich climate encouraging aflatoxin accumulation
  • Emphasis on HACCP and GMP-certified feed production
  • Growth in multifunctional detoxifier blends in compound feed

Brazil’s Growth Trajectory in Feed Mycotoxin Detoxification

Brazil’s market is set to grow at a CAGR of 6.6% between 2025 and 2035, propelled by expansion in the poultry, beef, and swine sectors. The country’s tropical climate fosters high mold proliferation in feed ingredients, especially corn and soybean meal.

Integrators and feed mills are adopting detoxifiers to mitigate risks posed by aflatoxins, zearalenone, and DON. The export-driven nature of Brazil’s meat industry is also encouraging adherence to strict quality standards. Increased investments in mycotoxin monitoring and analytics are reinforcing the shift toward preventive feed management.

  • High contamination levels in corn from southern and central states
  • Livestock exporters demanding clean feed solutions for compliance
  • Mycotoxin detection labs enabling pre-formulation testing protocols

Assessment of Mycotoxin Detoxifier Demand in Germany

Germany is projected to grow at a CAGR of 5.9% from 2025 to 2035, with mycotoxin mitigation becoming an integral part of precision livestock nutrition. The country’s temperate climate and strict feed safety regulations have led to consistent use of detoxifiers, especially in poultry and pig feeds.

Feed mills are incorporating clay-based adsorbents, yeast extracts, and microbial solutions that address a broad spectrum of toxins. The trend toward antibiotic-free meat production is also reinforcing the need for gut health protection via detoxification.

  • Regulatory frameworks like QS and GMP+ pushing detoxifier inclusion
  • R&D focused on multi-toxin binders with high efficacy
  • Rise in clean-label animal feed promoting natural detox agents

Feed Mycotoxin Detoxifiers Market in the United States

The USA feed detoxifier market is expected to grow at a CAGR of 5.5% during the forecast period, driven by heightened awareness of feed quality in large-scale animal production systems. Mycotoxin presence in stored grains, particularly corn and DDGS, is a major concern in Midwest states. Leading feed producers are deploying synthetic and organic solutions to neutralize toxins and maintain animal performance. The growing shift toward natural additives is also spurring demand for yeast and bentonite-based detoxifiers.
  • Recurrent mycotoxin outbreaks in poultry and swine industries
  • Increased monitoring by USDA and private labs boosting detection
  • Demand for toxin-specific binders and enzyme supplements rising

Leading Feed Mycotoxin Detoxifiers Suppliers

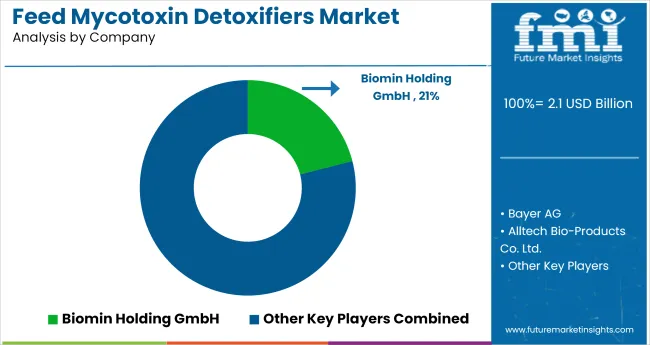
Feed Mycotoxin Detoxifiers Market Analysis By Company

Biomin Holding GmbH leads the global mycotoxin detoxifier market with an estimated 21% share, driven by its patented Mycofix® technology and strong presence in Europe and Asia. Alltech captures around 18% of the market, with extensive adoption of its yeast-based binders in poultry and swine feed sectors across North America.

ADM leverages its integrated value chain to distribute over 20,000 MT of detoxifiers annually across global feed mills. Kemin Industries focuses on multi-functional toxin binders, contributing to its steady 9-10% market share. Impextraco and Amlan International remain key regional players, especially in Latin America and Southeast Asia. New entrants are emphasizing mineral-organic hybrids to address regulatory shifts and expanding contamination risks from climate volatility.

Leading Players in Feed Mycotoxin Detoxifiers Market

  • Biomin Holding GmbH
  • Bayer AG
  • Alltech Bio-Products Co. Ltd.
  • Poortershaven Industrial Minerals BV
  • Archer Daniels Midland Company
  • Cenzone Tech Inc.,
  • Belgium Impextraco
  • Amlan International
  • Chr. Hansen Holding A/S
  • Kemin Industries Inc.
  • Others

Report Coverage and Scope Summary

Report Attributes Details
Market Size (2025) USD 2.1 billion
Projected Market Size (2035) USD 3.8 billion
CAGR (2025 to 2035) 6.2%
Base Year for Estimation 2024
Historical Period 2020 to 2024
Projections Period 2025 to 2035
Quantitative Units USD billion for market value
Types Analyzed (Segment 1) Mycotoxin Binders, Clays, Bentonite, Mycotoxin Modifiers, Yeasts, Enzymes
End Uses Analyzed (Segment 2) Aquaculture Operations, Integrators, Feed Manufacturers, Individual Farmers
Animal Types Analyzed (Segment 3) Poultry, Ruminants, Swine, Pets, Aquaculture Species, Rodents, Others (Dogs, Cats, Horses)
Distribution Channels Analyzed (Segment 4) Pharmacies & Drugstores, Health & Beauty Stores, Hypermarkets & Supermarkets, Direct Selling Networks, Online Platforms
Regions Covered North America, Latin America, Eastern Europe, Western Europe, East Asia, South Asia & Pacific, Central Asia, Balkan & Baltic Countries, Russia & Belarus, Middle East & Africa
Countries Covered United States, Canada, Germany, United Kingdom, France, Italy, Spain, China, India, Japan, South Korea, Australia, Brazil, Mexico, Argentina, Saudi Arabia, UAE, South Africa
Key Players Biomin Holding GmbH, Bayer AG, Alltech Bio-Products Co. Ltd., Poortershaven Industrial Minerals BV, Archer Daniels Midland Company, Cenzone Tech Inc., Belgium Impextraco, Amlan International, Chr. Hansen Holding A/S, Kemin Industries Inc., Others
Additional Attributes Dollar sales by type and animal species, increasing adoption of toxin-binding additives, regulatory focus on feed safety, and growing prevalence of fungal contaminants in livestock nutrition chains.

Key Segments of the Report

By Type:

The market is segmented by type into mycotoxin binders, clays, bentonite, mycotoxin modifiers, yeasts, and enzymes, each offering specific mechanisms to neutralize or adsorb toxins in animal feed.

By End Use:

End-use segmentation includes aquaculture operations, integrators, feed manufacturers, and individual farmers, reflecting diverse applications across commercial and independent production systems.

By Animal Type:

The market serves a wide range of species including poultry, ruminants, swine, pets, aquaculture species, rodents, and other animals such as dogs, cats, and horses.

By Distribution Channel:

Distribution occurs through pharmacies and drugstores, health and beauty stores, hypermarkets and supermarkets, direct selling networks, and online platforms.

By Region:

Geographic analysis spans North America, Latin America, Eastern Europe, Western Europe, East Asia, South Asia & Pacific, Central Asia, Balkan and Baltic Countries, Russia & Belarus, and the Middle East & Africa.

Table of Content

  1. Executive Summary
    • Global Market Outlook
    • Demand-side Trends
    • Supply-side Trends
    • Technology Roadmap Analysis
    • Analysis and Recommendations
  2. Market Overview
    • Market Coverage / Taxonomy
    • Market Definition / Scope / Limitations
  3. Market Background
    • Market Dynamics
      • Drivers
      • Restraints
      • Opportunity
      • Trends
    • Scenario Forecast
      • Demand in Optimistic Scenario
      • Demand in Likely Scenario
      • Demand in Conservative Scenario
    • Opportunity Map Analysis
    • Product Life Cycle Analysis
    • Supply Chain Analysis
      • Supply Side Participants and their Roles
        • Producers
        • Mid-Level Participants (Traders/ Agents/ Brokers)
        • Wholesalers and Distributors
      • Value Added and Value Created at Node in the Supply Chain
      • List of Raw Material Suppliers
      • List of Existing and Potential Buyer’s
    • Investment Feasibility Matrix
    • Value Chain Analysis
      • Profit Margin Analysis
      • Wholesalers and Distributors
      • Retailers
    • PESTLE and Porter’s Analysis
    • Regulatory Landscape
      • By Key Regions
      • By Key Countries
    • Regional Parent Market Outlook
    • Production and Consumption Statistics
    • Import and Export Statistics
  4. Global Market Analysis 2020 to 2024 and Forecast, 2025 to 2035
    • Historical Market Size Value (USD Billion) & Volume (MT) Analysis, 2020 to 2024
    • Current and Future Market Size Value (USD Billion) & Volume (MT) Projections, 2025 to 2035
      • Y-o-Y Growth Trend Analysis
      • Absolute $ Opportunity Analysis
  5. Global Market Pricing Analysis 2020 to 2024 and Forecast 2025 to 2035
  6. Global Market Analysis 2020 to 2024 and Forecast 2025 to 2035, By Type
    • Introduction / Key Findings
    • Historical Market Size Value (USD Billion) & Volume (MT) Analysis By Type, 2020 to 2024
    • Current and Future Market Size Value (USD Billion) & Volume (MT) Analysis and Forecast By Type, 2025 to 2035
      • Mycotoxin Binders
      • Clays
      • Bentonite
      • Mycotoxin Modifiers
      • Yeasts
      • Enzymes
    • Y-o-Y Growth Trend Analysis By Type, 2020 to 2024
    • Absolute $ Opportunity Analysis By Type, 2025 to 2035
  7. Global Market Analysis 2020 to 2024 and Forecast 2025 to 2035, By End Use
    • Introduction / Key Findings
    • Historical Market Size Value (USD Billion) & Volume (MT) Analysis By End Use, 2020 to 2024
    • Current and Future Market Size Value (USD Billion) & Volume (MT) Analysis and Forecast By End Use, 2025 to 2035
      • Aquaculture Operations
      • Integrators
      • Feed Manufacturers
      • Individual Farmers
    • Y-o-Y Growth Trend Analysis By End Use, 2020 to 2024
    • Absolute $ Opportunity Analysis By End Use, 2025 to 2035
  8. Global Market Analysis 2020 to 2024 and Forecast 2025 to 2035, By Animal Type
    • Introduction / Key Findings
    • Historical Market Size Value (USD Billion) & Volume (MT) Analysis By Animal Type, 2020 to 2024
    • Current and Future Market Size Value (USD Billion) & Volume (MT) Analysis and Forecast By Animal Type, 2025 to 2035
      • Poultry
      • Ruminants
      • Swine
      • Pets
      • Aquaculture Species
      • Rodents
      • Others
        • Dogs
        • Cats
        • Horses
    • Y-o-Y Growth Trend Analysis By Animal Type, 2020 to 2024
    • Absolute $ Opportunity Analysis By Animal Type, 2025 to 2035
  9. Global Market Analysis 2020 to 2024 and Forecast 2025 to 2035, By Distribution Channel
    • Introduction / Key Findings
    • Historical Market Size Value (USD Billion) & Volume (MT) Analysis By Distribution Channel, 2020 to 2024
    • Current and Future Market Size Value (USD Billion) & Volume (MT) Analysis and Forecast By Distribution Channel, 2025 to 2035
      • Pharmacies & Drugstores
      • Health & Beauty Stores
      • Hypermarkets & Supermarkets
      • Direct Selling Networks
      • Online Platforms
    • Y-o-Y Growth Trend Analysis By Distribution Channel, 2020 to 2024
    • Absolute $ Opportunity Analysis By Distribution Channel, 2025 to 2035
  10. Global Market Analysis 2020 to 2024 and Forecast 2025 to 2035, By Region
    • Introduction
    • Historical Market Size Value (USD Billion) & Volume (MT) Analysis By Region, 2020 to 2024
    • Current Market Size Value (USD Billion) & Volume (MT) Analysis and Forecast By Region, 2025 to 2035
      • North America
      • Latin America
      • Western Europe
      • Eastern Europe
      • East Asia
      • South Asia & Pacific
      • Middle East and Africa
    • Market Attractiveness Analysis By Region
  11. North America Market Analysis 2020 to 2024 and Forecast 2025 to 2035, By Country
    • Historical Market Size Value (USD Billion) & Volume (MT) Trend Analysis By Market Taxonomy, 2020 to 2024
    • Market Size Value (USD Billion) & Volume (MT) Forecast By Market Taxonomy, 2025 to 2035
      • By Country
        • USA
        • Canada
        • Mexico
      • By Type
      • By End Use
      • By Animal Type
      • By Distribution Channel
    • Market Attractiveness Analysis
      • By Country
      • By Type
      • By End Use
      • By Animal Type
      • By Distribution Channel
    • Key Takeaways
  12. Latin America Market Analysis 2020 to 2024 and Forecast 2025 to 2035, By Country
    • Historical Market Size Value (USD Billion) & Volume (MT) Trend Analysis By Market Taxonomy, 2020 to 2024
    • Market Size Value (USD Billion) & Volume (MT) Forecast By Market Taxonomy, 2025 to 2035
      • By Country
        • Brazil
        • Argentina
        • Rest of LATAM
      • By Type
      • By End Use
      • By Animal Type
      • By Distribution Channel
    • Market Attractiveness Analysis
      • By Country
      • By Type
      • By End Use
      • By Animal Type
      • By Distribution Channel
    • Key Takeaways
  13. Western Europe Market Analysis 2020 to 2024 and Forecast 2025 to 2035, By Country
    • Historical Market Size Value (USD Billion) & Volume (MT) Trend Analysis By Market Taxonomy, 2020 to 2024
    • Market Size Value (USD Billion) & Volume (MT) Forecast By Market Taxonomy, 2025 to 2035
      • By Country
        • Germany
        • Italy
        • France
        • UK
        • Spain
        • BENELUX
        • Nordic
        • Rest of W.Europe
      • By Type
      • By End Use
      • By Animal Type
      • By Distribution Channel
    • Market Attractiveness Analysis
      • By Country
      • By Type
      • By End Use
      • By Animal Type
      • By Distribution Channel
    • Key Takeaways
  14. Eastern Europe Market Analysis 2020 to 2024 and Forecast 2025 to 2035, By Country
    • Historical Market Size Value (USD Billion) & Volume (MT) Trend Analysis By Market Taxonomy, 2020 to 2024
    • Market Size Value (USD Billion) & Volume (MT) Forecast By Market Taxonomy, 2025 to 2035
      • By Country
        • Russia
        • Hungary
        • Poland
        • Balkan & Baltics
        • Rest of E. Europe
      • By Type
      • By End Use
      • By Animal Type
      • By Distribution Channel
    • Market Attractiveness Analysis
      • By Country
      • By Type
      • By End Use
      • By Animal Type
      • By Distribution Channel
    • Key Takeaways
  15. East Asia Market Analysis 2020 to 2024 and Forecast 2025 to 2035, By Country
    • Historical Market Size Value (USD Billion) & Volume (MT) Trend Analysis By Market Taxonomy, 2020 to 2024
    • Market Size Value (USD Billion) & Volume (MT) Forecast By Market Taxonomy, 2025 to 2035
      • By Country
        • China
        • Japan
        • South Korea
      • By Type
      • By End Use
      • By Animal Type
      • By Distribution Channel
    • Market Attractiveness Analysis
      • By Country
      • By Type
      • By End Use
      • By Animal Type
      • By Distribution Channel
    • Key Takeaways
  16. South Asia & Pacific Market Analysis 2020 to 2024 and Forecast 2025 to 2035, By Country
    • Historical Market Size Value (USD Billion) & Volume (MT) Trend Analysis By Market Taxonomy, 2020 to 2024
    • Market Size Value (USD Billion) & Volume (MT) Forecast By Market Taxonomy, 2025 to 2035
      • By Country
        • India
        • Australia & New Zealand
        • ASEAN
        • Rest of SAP
      • By Type
      • By End Use
      • By Animal Type
      • By Distribution Channel
    • Market Attractiveness Analysis
      • By Country
      • By Type
      • By End Use
      • By Animal Type
      • By Distribution Channel
    • Key Takeaways
  17. Middle East and Africa Market Analysis 2020 to 2024 and Forecast 2025 to 2035, By Country
    • Historical Market Size Value (USD Billion) & Volume (MT) Trend Analysis By Market Taxonomy, 2020 to 2024
    • Market Size Value (USD Billion) & Volume (MT) Forecast By Market Taxonomy, 2025 to 2035
      • By Country
        • GCC Countries
        • Northern Africa
        • South Africa
        • Turkiye
        • Rest of MEA
      • By Type
      • By End Use
      • By Animal Type
      • By Distribution Channel
    • Market Attractiveness Analysis
      • By Country
      • By Type
      • By End Use
      • By Animal Type
      • By Distribution Channel
    • Key Takeaways
  18. Key Countries Market Analysis
    • USA
      • Pricing Analysis
      • Market Share Analysis, 2024
        • By Type
        • By End Use
        • By Animal Type
        • By Distribution Channel
    • Canada
      • Pricing Analysis
      • Market Share Analysis, 2024
        • By Type
        • By End Use
        • By Animal Type
        • By Distribution Channel
    • Brazil
      • Pricing Analysis
      • Market Share Analysis, 2024
        • By Type
        • By End Use
        • By Animal Type
        • By Distribution Channel
    • Mexico
      • Pricing Analysis
      • Market Share Analysis, 2024
        • By Type
        • By End Use
        • By Animal Type
        • By Distribution Channel
    • Argentina
      • Pricing Analysis
      • Market Share Analysis, 2024
        • By Type
        • By End Use
        • By Animal Type
        • By Distribution Channel
  19. Market Structure Analysis
    • Competition Dashboard
    • Competition Benchmarking
    • Market Share Analysis of Top Players
      • By Regional
      • By Type
      • By End Use
      • By Animal Type
      • By Distribution Channel
  20. Competition Analysis
    • Competition Deep Dive
      • Biomin Holding GmbH
        • Overview
        • Product Portfolio
        • Profitability by Market Segments (Product/Age /Sales Channel/Region)
        • Sales Footprint
        • Strategy Overview
          • Marketing Strategy
          • Product Strategy
          • Channel Strategy
      • Bayer AG
        • Overview
        • Product Portfolio
        • Profitability by Market Segments (Product/Age /Sales Channel/Region)
        • Sales Footprint
        • Strategy Overview
          • Marketing Strategy
          • Product Strategy
          • Channel Strategy
      • Alltech Bio-Products Co. Ltd.
        • Overview
        • Product Portfolio
        • Profitability by Market Segments (Product/Age /Sales Channel/Region)
        • Sales Footprint
        • Strategy Overview
          • Marketing Strategy
          • Product Strategy
          • Channel Strategy
      • Poortershaven Industrial Minerals BV
        • Overview
        • Product Portfolio
        • Profitability by Market Segments (Product/Age /Sales Channel/Region)
        • Sales Footprint
        • Strategy Overview
          • Marketing Strategy
          • Product Strategy
          • Channel Strategy
      • Archer Daniels Midland Company
        • Overview
        • Product Portfolio
        • Profitability by Market Segments (Product/Age /Sales Channel/Region)
        • Sales Footprint
        • Strategy Overview
          • Marketing Strategy
          • Product Strategy
          • Channel Strategy
      • Cenzone Tech Inc.,
        • Overview
        • Product Portfolio
        • Profitability by Market Segments (Product/Age /Sales Channel/Region)
        • Sales Footprint
        • Strategy Overview
          • Marketing Strategy
          • Product Strategy
          • Channel Strategy
      • Belgium Impextraco
        • Overview
        • Product Portfolio
        • Profitability by Market Segments (Product/Age /Sales Channel/Region)
        • Sales Footprint
        • Strategy Overview
          • Marketing Strategy
          • Product Strategy
          • Channel Strategy
      • Amlan International
        • Overview
        • Product Portfolio
        • Profitability by Market Segments (Product/Age /Sales Channel/Region)
        • Sales Footprint
        • Strategy Overview
          • Marketing Strategy
          • Product Strategy
          • Channel Strategy
      • Chr. Hansen Holding A/S
        • Overview
        • Product Portfolio
        • Profitability by Market Segments (Product/Age /Sales Channel/Region)
        • Sales Footprint
        • Strategy Overview
          • Marketing Strategy
          • Product Strategy
          • Channel Strategy
      • Kemin Industries Inc.
        • Overview
        • Product Portfolio
        • Profitability by Market Segments (Product/Age /Sales Channel/Region)
        • Sales Footprint
        • Strategy Overview
          • Marketing Strategy
          • Product Strategy
          • Channel Strategy
      • Others
        • Overview
        • Product Portfolio
        • Profitability by Market Segments (Product/Age /Sales Channel/Region)
        • Sales Footprint
        • Strategy Overview
          • Marketing Strategy
          • Product Strategy
          • Channel Strategy
  21. Assumptions & Acronyms Used
  22. Research Methodology

List of Tables

  • Table 1: Global Market Value (USD Billion) Forecast by Region, 2020-2035
  • Table 2: Global Market Volume (MT) Forecast by Region, 2020-2035
  • Table 3: Global Market Value (USD Billion) Forecast by Type, 2020-2035
  • Table 4: Global Market Volume (MT) Forecast by Type, 2020-2035
  • Table 5: Global Market Value (USD Billion) Forecast by End Use, 2020-2035
  • Table 6: Global Market Volume (MT) Forecast by End Use, 2020-2035
  • Table 7: Global Market Value (USD Billion) Forecast by Animal Type, 2020-2035
  • Table 8: Global Market Volume (MT) Forecast by Animal Type, 2020-2035
  • Table 9: Global Market Value (USD Billion) Forecast by Distribution Channel, 2020-2035
  • Table 10: Global Market Volume (MT) Forecast by Distribution Channel, 2020-2035
  • Table 11: North America Market Value (USD Billion) Forecast by Country, 2020-2035
  • Table 12: North America Market Volume (MT) Forecast by Country, 2020-2035
  • Table 13: North America Market Value (USD Billion) Forecast by Type, 2020-2035
  • Table 14: North America Market Volume (MT) Forecast by Type, 2020-2035
  • Table 15: North America Market Value (USD Billion) Forecast by End Use, 2020-2035
  • Table 16: North America Market Volume (MT) Forecast by End Use, 2020-2035
  • Table 17: North America Market Value (USD Billion) Forecast by Animal Type, 2020-2035
  • Table 18: North America Market Volume (MT) Forecast by Animal Type, 2020-2035
  • Table 19: North America Market Value (USD Billion) Forecast by Distribution Channel, 2020-2035
  • Table 20: North America Market Volume (MT) Forecast by Distribution Channel, 2020-2035
  • Table 21: Latin America Market Value (USD Billion) Forecast by Country, 2020-2035
  • Table 22: Latin America Market Volume (MT) Forecast by Country, 2020-2035
  • Table 23: Latin America Market Value (USD Billion) Forecast by Type, 2020-2035
  • Table 24: Latin America Market Volume (MT) Forecast by Type, 2020-2035
  • Table 25: Latin America Market Value (USD Billion) Forecast by End Use, 2020-2035
  • Table 26: Latin America Market Volume (MT) Forecast by End Use, 2020-2035
  • Table 27: Latin America Market Value (USD Billion) Forecast by Animal Type, 2020-2035
  • Table 28: Latin America Market Volume (MT) Forecast by Animal Type, 2020-2035
  • Table 29: Latin America Market Value (USD Billion) Forecast by Distribution Channel, 2020-2035
  • Table 30: Latin America Market Volume (MT) Forecast by Distribution Channel, 2020-2035
  • Table 31: Western Europe Market Value (USD Billion) Forecast by Country, 2020-2035
  • Table 32: Western Europe Market Volume (MT) Forecast by Country, 2020-2035
  • Table 33: Western Europe Market Value (USD Billion) Forecast by Type, 2020-2035
  • Table 34: Western Europe Market Volume (MT) Forecast by Type, 2020-2035
  • Table 35: Western Europe Market Value (USD Billion) Forecast by End Use, 2020-2035
  • Table 36: Western Europe Market Volume (MT) Forecast by End Use, 2020-2035
  • Table 37: Western Europe Market Value (USD Billion) Forecast by Animal Type, 2020-2035
  • Table 38: Western Europe Market Volume (MT) Forecast by Animal Type, 2020-2035
  • Table 39: Western Europe Market Value (USD Billion) Forecast by Distribution Channel, 2020-2035
  • Table 40: Western Europe Market Volume (MT) Forecast by Distribution Channel, 2020-2035
  • Table 41: Eastern Europe Market Value (USD Billion) Forecast by Country, 2020-2035
  • Table 42: Eastern Europe Market Volume (MT) Forecast by Country, 2020-2035
  • Table 43: Eastern Europe Market Value (USD Billion) Forecast by Type, 2020-2035
  • Table 44: Eastern Europe Market Volume (MT) Forecast by Type, 2020-2035
  • Table 45: Eastern Europe Market Value (USD Billion) Forecast by End Use, 2020-2035
  • Table 46: Eastern Europe Market Volume (MT) Forecast by End Use, 2020-2035
  • Table 47: Eastern Europe Market Value (USD Billion) Forecast by Animal Type, 2020-2035
  • Table 48: Eastern Europe Market Volume (MT) Forecast by Animal Type, 2020-2035
  • Table 49: Eastern Europe Market Value (USD Billion) Forecast by Distribution Channel, 2020-2035
  • Table 50: Eastern Europe Market Volume (MT) Forecast by Distribution Channel, 2020-2035
  • Table 51: East Asia Market Value (USD Billion) Forecast by Country, 2020-2035
  • Table 52: East Asia Market Volume (MT) Forecast by Country, 2020-2035
  • Table 53: East Asia Market Value (USD Billion) Forecast by Type, 2020-2035
  • Table 54: East Asia Market Volume (MT) Forecast by Type, 2020-2035
  • Table 55: East Asia Market Value (USD Billion) Forecast by End Use, 2020-2035
  • Table 56: East Asia Market Volume (MT) Forecast by End Use, 2020-2035
  • Table 57: East Asia Market Value (USD Billion) Forecast by Animal Type, 2020-2035
  • Table 58: East Asia Market Volume (MT) Forecast by Animal Type, 2020-2035
  • Table 59: East Asia Market Value (USD Billion) Forecast by Distribution Channel, 2020-2035
  • Table 60: East Asia Market Volume (MT) Forecast by Distribution Channel, 2020-2035
  • Table 61: South Asia & Pacific Market Value (USD Billion) Forecast by Country, 2020-2035
  • Table 62: South Asia & Pacific Market Volume (MT) Forecast by Country, 2020-2035
  • Table 63: South Asia & Pacific Market Value (USD Billion) Forecast by Type, 2020-2035
  • Table 64: South Asia & Pacific Market Volume (MT) Forecast by Type, 2020-2035
  • Table 65: South Asia & Pacific Market Value (USD Billion) Forecast by End Use, 2020-2035
  • Table 66: South Asia & Pacific Market Volume (MT) Forecast by End Use, 2020-2035
  • Table 67: South Asia & Pacific Market Value (USD Billion) Forecast by Animal Type, 2020-2035
  • Table 68: South Asia & Pacific Market Volume (MT) Forecast by Animal Type, 2020-2035
  • Table 69: South Asia & Pacific Market Value (USD Billion) Forecast by Distribution Channel, 2020-2035
  • Table 70: South Asia & Pacific Market Volume (MT) Forecast by Distribution Channel, 2020-2035
  • Table 71: Middle East and Africa Market Value (USD Billion) Forecast by Country, 2020-2035
  • Table 72: Middle East and Africa Market Volume (MT) Forecast by Country, 2020-2035
  • Table 73: Middle East and Africa Market Value (USD Billion) Forecast by Type, 2020-2035
  • Table 74: Middle East and Africa Market Volume (MT) Forecast by Type, 2020-2035
  • Table 75: Middle East and Africa Market Value (USD Billion) Forecast by End Use, 2020-2035
  • Table 76: Middle East and Africa Market Volume (MT) Forecast by End Use, 2020-2035
  • Table 77: Middle East and Africa Market Value (USD Billion) Forecast by Animal Type, 2020-2035
  • Table 78: Middle East and Africa Market Volume (MT) Forecast by Animal Type, 2020-2035
  • Table 79: Middle East and Africa Market Value (USD Billion) Forecast by Distribution Channel, 2020-2035
  • Table 80: Middle East and Africa Market Volume (MT) Forecast by Distribution Channel, 2020-2035

List of Figures

  • Figure 1: Global Market Volume (MT) Forecast 2020-2035
  • Figure 2: Global Market Pricing Analysis
  • Figure 3: Global Market Value (USD Billion) Forecast 2020-2035
  • Figure 4: Global Market Value Share and BPS Analysis by Type, 2025 and 2035
  • Figure 5: Global Market Y-o-Y Growth Comparison by Type, 2025-2035
  • Figure 6: Global Market Attractiveness Analysis by Type
  • Figure 7: Global Market Value Share and BPS Analysis by End Use, 2025 and 2035
  • Figure 8: Global Market Y-o-Y Growth Comparison by End Use, 2025-2035
  • Figure 9: Global Market Attractiveness Analysis by End Use
  • Figure 10: Global Market Value Share and BPS Analysis by Animal Type, 2025 and 2035
  • Figure 11: Global Market Y-o-Y Growth Comparison by Animal Type, 2025-2035
  • Figure 12: Global Market Attractiveness Analysis by Animal Type
  • Figure 13: Global Market Value Share and BPS Analysis by Distribution Channel, 2025 and 2035
  • Figure 14: Global Market Y-o-Y Growth Comparison by Distribution Channel, 2025-2035
  • Figure 15: Global Market Attractiveness Analysis by Distribution Channel
  • Figure 16: Global Market Value (USD Billion) Share and BPS Analysis by Region, 2025 and 2035
  • Figure 17: Global Market Y-o-Y Growth Comparison by Region, 2025-2035
  • Figure 18: Global Market Attractiveness Analysis by Region
  • Figure 19: North America Market Incremental $ Opportunity, 2025-2035
  • Figure 20: Latin America Market Incremental $ Opportunity, 2025-2035
  • Figure 21: Western Europe Market Incremental $ Opportunity, 2025-2035
  • Figure 22: Eastern Europe Market Incremental $ Opportunity, 2025-2035
  • Figure 23: East Asia Market Incremental $ Opportunity, 2025-2035
  • Figure 24: South Asia & Pacific Market Incremental $ Opportunity, 2025-2035
  • Figure 25: Middle East and Africa Market Incremental $ Opportunity, 2025-2035
  • Figure 26: North America Market Value Share and BPS Analysis by Country, 2025 and 2035
  • Figure 27: North America Market Value Share and BPS Analysis by Type, 2025 and 2035
  • Figure 28: North America Market Y-o-Y Growth Comparison by Type, 2025-2035
  • Figure 29: North America Market Attractiveness Analysis by Type
  • Figure 30: North America Market Value Share and BPS Analysis by End Use, 2025 and 2035
  • Figure 31: North America Market Y-o-Y Growth Comparison by End Use, 2025-2035
  • Figure 32: North America Market Attractiveness Analysis by End Use
  • Figure 33: North America Market Value Share and BPS Analysis by Animal Type, 2025 and 2035
  • Figure 34: North America Market Y-o-Y Growth Comparison by Animal Type, 2025-2035
  • Figure 35: North America Market Attractiveness Analysis by Animal Type
  • Figure 36: North America Market Value Share and BPS Analysis by Distribution Channel, 2025 and 2035
  • Figure 37: North America Market Y-o-Y Growth Comparison by Distribution Channel, 2025-2035
  • Figure 38: North America Market Attractiveness Analysis by Distribution Channel
  • Figure 39: Latin America Market Value Share and BPS Analysis by Country, 2025 and 2035
  • Figure 40: Latin America Market Value Share and BPS Analysis by Type, 2025 and 2035
  • Figure 41: Latin America Market Y-o-Y Growth Comparison by Type, 2025-2035
  • Figure 42: Latin America Market Attractiveness Analysis by Type
  • Figure 43: Latin America Market Value Share and BPS Analysis by End Use, 2025 and 2035
  • Figure 44: Latin America Market Y-o-Y Growth Comparison by End Use, 2025-2035
  • Figure 45: Latin America Market Attractiveness Analysis by End Use
  • Figure 46: Latin America Market Value Share and BPS Analysis by Animal Type, 2025 and 2035
  • Figure 47: Latin America Market Y-o-Y Growth Comparison by Animal Type, 2025-2035
  • Figure 48: Latin America Market Attractiveness Analysis by Animal Type
  • Figure 49: Latin America Market Value Share and BPS Analysis by Distribution Channel, 2025 and 2035
  • Figure 50: Latin America Market Y-o-Y Growth Comparison by Distribution Channel, 2025-2035
  • Figure 51: Latin America Market Attractiveness Analysis by Distribution Channel
  • Figure 52: Western Europe Market Value Share and BPS Analysis by Country, 2025 and 2035
  • Figure 53: Western Europe Market Value Share and BPS Analysis by Type, 2025 and 2035
  • Figure 54: Western Europe Market Y-o-Y Growth Comparison by Type, 2025-2035
  • Figure 55: Western Europe Market Attractiveness Analysis by Type
  • Figure 56: Western Europe Market Value Share and BPS Analysis by End Use, 2025 and 2035
  • Figure 57: Western Europe Market Y-o-Y Growth Comparison by End Use, 2025-2035
  • Figure 58: Western Europe Market Attractiveness Analysis by End Use
  • Figure 59: Western Europe Market Value Share and BPS Analysis by Animal Type, 2025 and 2035
  • Figure 60: Western Europe Market Y-o-Y Growth Comparison by Animal Type, 2025-2035
  • Figure 61: Western Europe Market Attractiveness Analysis by Animal Type
  • Figure 62: Western Europe Market Value Share and BPS Analysis by Distribution Channel, 2025 and 2035
  • Figure 63: Western Europe Market Y-o-Y Growth Comparison by Distribution Channel, 2025-2035
  • Figure 64: Western Europe Market Attractiveness Analysis by Distribution Channel
  • Figure 65: Eastern Europe Market Value Share and BPS Analysis by Country, 2025 and 2035
  • Figure 66: Eastern Europe Market Value Share and BPS Analysis by Type, 2025 and 2035
  • Figure 67: Eastern Europe Market Y-o-Y Growth Comparison by Type, 2025-2035
  • Figure 68: Eastern Europe Market Attractiveness Analysis by Type
  • Figure 69: Eastern Europe Market Value Share and BPS Analysis by End Use, 2025 and 2035
  • Figure 70: Eastern Europe Market Y-o-Y Growth Comparison by End Use, 2025-2035
  • Figure 71: Eastern Europe Market Attractiveness Analysis by End Use
  • Figure 72: Eastern Europe Market Value Share and BPS Analysis by Animal Type, 2025 and 2035
  • Figure 73: Eastern Europe Market Y-o-Y Growth Comparison by Animal Type, 2025-2035
  • Figure 74: Eastern Europe Market Attractiveness Analysis by Animal Type
  • Figure 75: Eastern Europe Market Value Share and BPS Analysis by Distribution Channel, 2025 and 2035
  • Figure 76: Eastern Europe Market Y-o-Y Growth Comparison by Distribution Channel, 2025-2035
  • Figure 77: Eastern Europe Market Attractiveness Analysis by Distribution Channel
  • Figure 78: East Asia Market Value Share and BPS Analysis by Country, 2025 and 2035
  • Figure 79: East Asia Market Value Share and BPS Analysis by Type, 2025 and 2035
  • Figure 80: East Asia Market Y-o-Y Growth Comparison by Type, 2025-2035
  • Figure 81: East Asia Market Attractiveness Analysis by Type
  • Figure 82: East Asia Market Value Share and BPS Analysis by End Use, 2025 and 2035
  • Figure 83: East Asia Market Y-o-Y Growth Comparison by End Use, 2025-2035
  • Figure 84: East Asia Market Attractiveness Analysis by End Use
  • Figure 85: East Asia Market Value Share and BPS Analysis by Animal Type, 2025 and 2035
  • Figure 86: East Asia Market Y-o-Y Growth Comparison by Animal Type, 2025-2035
  • Figure 87: East Asia Market Attractiveness Analysis by Animal Type
  • Figure 88: East Asia Market Value Share and BPS Analysis by Distribution Channel, 2025 and 2035
  • Figure 89: East Asia Market Y-o-Y Growth Comparison by Distribution Channel, 2025-2035
  • Figure 90: East Asia Market Attractiveness Analysis by Distribution Channel
  • Figure 91: South Asia & Pacific Market Value Share and BPS Analysis by Country, 2025 and 2035
  • Figure 92: South Asia & Pacific Market Value Share and BPS Analysis by Type, 2025 and 2035
  • Figure 93: South Asia & Pacific Market Y-o-Y Growth Comparison by Type, 2025-2035
  • Figure 94: South Asia & Pacific Market Attractiveness Analysis by Type
  • Figure 95: South Asia & Pacific Market Value Share and BPS Analysis by End Use, 2025 and 2035
  • Figure 96: South Asia & Pacific Market Y-o-Y Growth Comparison by End Use, 2025-2035
  • Figure 97: South Asia & Pacific Market Attractiveness Analysis by End Use
  • Figure 98: South Asia & Pacific Market Value Share and BPS Analysis by Animal Type, 2025 and 2035
  • Figure 99: South Asia & Pacific Market Y-o-Y Growth Comparison by Animal Type, 2025-2035
  • Figure 100: South Asia & Pacific Market Attractiveness Analysis by Animal Type
  • Figure 101: South Asia & Pacific Market Value Share and BPS Analysis by Distribution Channel, 2025 and 2035
  • Figure 102: South Asia & Pacific Market Y-o-Y Growth Comparison by Distribution Channel, 2025-2035
  • Figure 103: South Asia & Pacific Market Attractiveness Analysis by Distribution Channel
  • Figure 104: Middle East and Africa Market Value Share and BPS Analysis by Country, 2025 and 2035
  • Figure 105: Middle East and Africa Market Value Share and BPS Analysis by Type, 2025 and 2035
  • Figure 106: Middle East and Africa Market Y-o-Y Growth Comparison by Type, 2025-2035
  • Figure 107: Middle East and Africa Market Attractiveness Analysis by Type
  • Figure 108: Middle East and Africa Market Value Share and BPS Analysis by End Use, 2025 and 2035
  • Figure 109: Middle East and Africa Market Y-o-Y Growth Comparison by End Use, 2025-2035
  • Figure 110: Middle East and Africa Market Attractiveness Analysis by End Use
  • Figure 111: Middle East and Africa Market Value Share and BPS Analysis by Animal Type, 2025 and 2035
  • Figure 112: Middle East and Africa Market Y-o-Y Growth Comparison by Animal Type, 2025-2035
  • Figure 113: Middle East and Africa Market Attractiveness Analysis by Animal Type
  • Figure 114: Middle East and Africa Market Value Share and BPS Analysis by Distribution Channel, 2025 and 2035
  • Figure 115: Middle East and Africa Market Y-o-Y Growth Comparison by Distribution Channel, 2025-2035
  • Figure 116: Middle East and Africa Market Attractiveness Analysis by Distribution Channel
  • Figure 117: Global Market - Tier Structure Analysis
  • Figure 118: Global Market - Company Share Analysis

Frequently Asked Questions

What is the market size of the feed mycotoxin detoxifiers market in 2025?

The market is valued at USD 2.1 billion in 2025.

What is the projected market size of the feed mycotoxin detoxifiers market by 2035?

The market is forecasted to reach USD 3.8 billion by 2035.

What is the CAGR of the feed mycotoxin detoxifiers market from 2025 to 2035?

The market is expected to expand at a CAGR of 6.2% during the forecast period.

Which end-use industry holds the largest share in the feed mycotoxin detoxifiers market?

The aquaculture industry accounts for 26% of the market in 2025.

Which country shows the highest growth in the feed mycotoxin detoxifiers market?

India is the fastest-growing country with a CAGR of 7.4% from 2025 to 2035.

Explore Similar Insights

Future Market Insights

Feed Mycotoxin Detoxifiers Market