Feed Micronutrients Market Size and Share Forecast Outlook 2025 to 2035

The feed micronutrients market is projected to grow steadily from USD 2.1 billion in 2025 to USD 3.9 billion by 2035, reflecting a CAGR of 6.3%. This growth is driven by increasing demand for micronutrient-enriched animal feed to enhance livestock health and productivity. The market shows a consistent upward trajectory with significant contributions from trace minerals, which hold the largest product share at 60%. Poultry dominates the livestock segment with a 60% market share, highlighting the critical role of the poultry industry in market expansion.

Geographically, the market is led by China, exhibiting the highest CAGR of 6.4%, closely followed by the United States and India. By 2030, the market is projected to reach USD 2.85 billion, representing an absolute dollar growth of USD 0.75 billion from the 2025 base of USD 2.1 billion. This steady increase indicates sustained momentum in the first half of the decade, driven primarily by expanding demand in key geographies and product segments such as trace minerals and poultry feed.

Companies such as BASF SE, DuPont Nutrition & Biosciences, and Evonik Industries AG are strengthening their competitive positions through strategic investments in product innovation, supply chain optimization, and sustainability initiatives. Innovation-led approaches focus on developing advanced micronutrient formulations that enhance livestock health and productivity, supporting expansion into poultry, ruminant, and aquaculture feed segments. Market performance is expected to be anchored by regulatory compliance, ingredient purity standards, and sustainable sourcing practices.
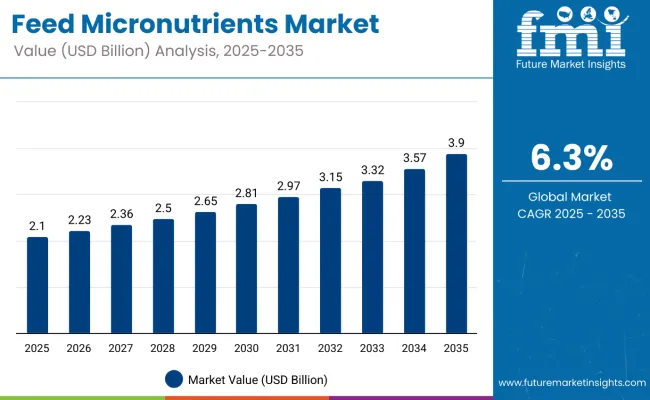
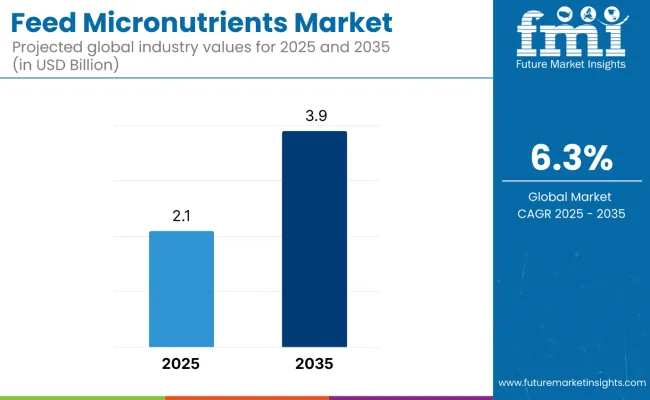
Feed Micronutrients Market Value Analysis

Quick Stats for Feed Micronutrients Market

  • Feed Micronutrients Market Value (2025): USD 2.1 billion
  • Feed Micronutrients Market Forecast Value (2035): USD 3.9 billion
  • Feed Micronutrients Market Forecast CAGR: 6.3%
  • Leading Segment in Feed Micronutrients Market in 2025: Trace Minerals (60%)
  • Key Growth Regions in Feed Micronutrients Market: Asia Pacific, North America, and Europe
  • Top Key Players in Feed Micronutrients Market: BASF SE, DuPont Nutrition & Biosciences, Evonik Industries AG, Novozymes A/S

Feed Micronutrients Market

Metric Value
Estimated Market Value (2025) USD 2.1 billion
Forecast Market Value (2035) USD 3.9 billion
Forecast CAGR (2025 to 2035) 6.3%

The market holds a crucial role within the broader animal nutrition industry, driven by its foundational impact on livestock health and productivity enhancement. It contributes significantly to improving feed efficiency and immune support across diverse livestock segments, particularly poultry, which dominates the market. The rising adoption of trace minerals and vitamin-enriched feed formulations underpins this market’s steady expansion globally.

The market is experiencing gradual structural evolution, with leading companies such as BASF SE, DuPont Nutrition & Biosciences, and Evonik Industries AG investing in innovative micronutrient blends and sustainable sourcing strategies. These advancements support integration across multiple livestock sectors, including poultry, ruminants, aquaculture, and swine, while regulatory compliance and quality standards continue to shape market dynamics.

Why is the Feed Micronutrients Market Growing?

The feed micronutrients market is growing primarily due to the increasing need to improve animal health, productivity, and overall feed efficiency. Micronutrients such as trace minerals, vitamins, and carotenoids play a critical role in supporting immune function, growth, and reproduction in livestock, making them essential additives in modern animal nutrition.

Rising awareness among farmers and feed manufacturers about the benefits of balanced micronutrient supplementation is driving adoption, particularly in high-demand sectors like poultry and aquaculture. Increasing consumer preference for safer and higher-quality animal products further propels the use of micronutrient-enriched feed formulations.

Additionally, advancements in micronutrient delivery technologies and sustainable sourcing practices are enhancing the efficacy and environmental footprint of these products. As the livestock industry continues to focus on sustainable growth and regulatory compliance, the demand for feed micronutrients is expected to maintain strong momentum across global markets.

Feed Micronutrients Market Analysis by Top Investment Segments

The market is segmented by product, livestock, and region. By product, the market is divided into trace minerals, vitamins, carotenoids, and others (antioxidants and enzyme cofactors). Based on livestock, the market is categorized into poultry, ruminant, aquaculture, swine, and equine. Regionally, the market is classified into North America, Latin America, Europe, Asia Pacific, and the Middle East & Africa (MEA).
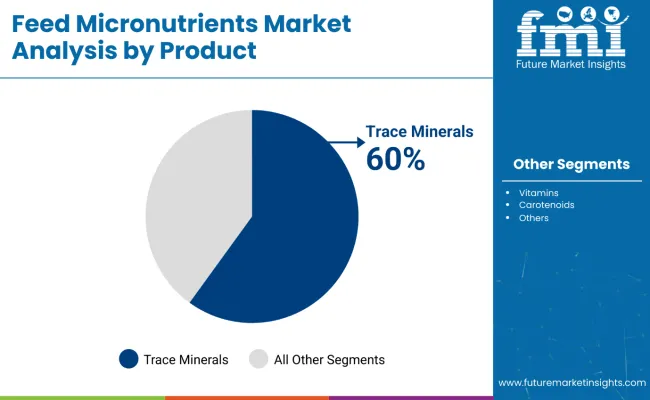
By Product, Trace Minerals Account for 60% of the Market Share in 2025

Feed Micronutrients Market By Product

Trace minerals constitute the largest product segment, commanding 60% share in 2025. These essential minerals including iron, zinc, copper, manganese, and boron are vital for enhancing livestock health, growth, and productivity. Their critical role in supporting immune function and metabolic processes drives widespread adoption in animal feed formulations. Among livestock, the poultry segment overwhelmingly leads, also capturing around 60% of the market share.

This dominance is attributable to the rapidly growing poultry industry, which demands nutrient-rich feed to meet consumer preferences for high-quality meat and eggs. The combination of intensive poultry production systems and rising awareness of animal nutrition is fueling the sector’s expansion. Overall, trace minerals and poultry are key pillars of the feed micronutrients market, highlighting the role of targeted nutritional solutions in optimizing animal performance and supporting growth in the global livestock industry.
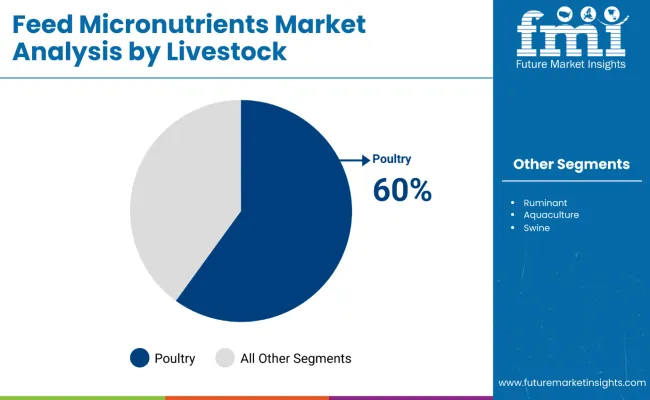
By Livestock, Poultry Accounts for 60% of the Market Share in 2025

Feed Micronutrients Market By Livestock

The market is segmented by livestock into poultry, ruminant, aquaculture, swine, and equine, with poultry dominating the market at a 60% share. This dominance is driven by the rapid growth of poultry farming worldwide, where micronutrient-enriched feed is essential to improve growth rates, bolster immune systems, and enhance overall productivity. Ruminants, including cattle and sheep, form the next significant segment, relying on micronutrients to aid digestion and maintain health.

Aquaculture is a fast-growing segment, reflecting increased global demand for fish and seafood, with precise nutrient formulations improving survival and growth rates. Swine farming represents another important segment, focusing on feed efficiency and reproductive performance through micronutrient supplementation. Although equine is the smallest segment, it remains vital for specialized horse nutrition, especially in racing and recreational markets. The unique nutritional requirements of these livestock categories collectively fuel the feed micronutrients market, with poultry as the primary growth driver.

What are the Drivers, Restraints, and Key Trends of the Feed Micronutrients Market?

From 2025 to 2035, the feed micronutrients market is driven by increasing emphasis on animal health, productivity, and sustainable livestock farming practices. Feed manufacturers are adopting advanced micronutrient formulations to enhance immune function, growth rates, and overall feed efficiency in poultry, ruminants, aquaculture, and swine. The integration of trace minerals, vitamins, and carotenoids into balanced feed solutions positions suppliers as key partners in improving livestock performance and supporting sustainable agriculture.

Rising Focus on Nutritional Efficiency Fuels Market Growth

Growing awareness of the critical role of micronutrients in optimizing animal health and productivity is the primary catalyst behind market expansion. Advances in feed additive technologies and enhanced delivery systems ensure better bioavailability and absorption of micronutrients. Regulatory emphasis on feed safety and quality further drives adoption. By 2025, feed producers increasingly focused on formulating nutrient-dense feeds tailored for different livestock species to meet consumer demand for safe and high-quality animal products.

Precision Nutrition and Sustainable Practices Create Market Opportunities

The market is evolving with the integration of precision nutrition approaches and sustainable sourcing practices. Improved micronutrient blends combined with digital feed management systems enable livestock farmers to optimize nutrient intake, reduce waste, and enhance production efficiency. Growing interests in eco-friendly feed additives and trace mineral sources underscore the sustainability focus. Companies that offer innovative, science-backed micronutrient solutions with proven efficacy are positioned to gain a competitive edge and capture growing global demand.
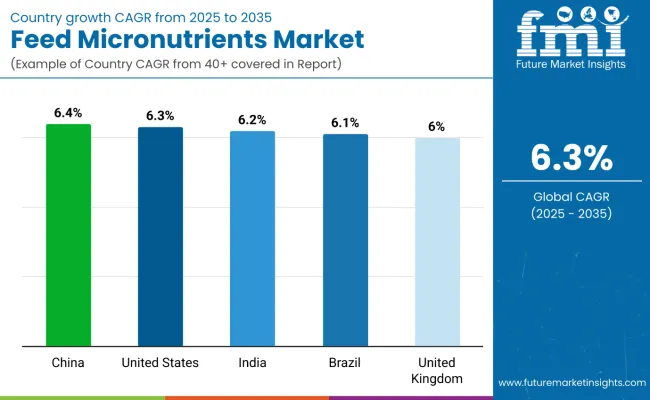
Feed Micronutrients Market Analysis by Key Countries

Country Wise Analysis Of Feed Micronutrients Market

Country CAGR (%)
China 6.4%
United States 6.3%
India 6.2%
Brazil 6.1%
United Kingdom 6.0%

The market is experiencing steady growth across key countries, with China leading at a CAGR of 6.4%, driven by rapid modernization of livestock farming, government support for animal health, and expanding production infrastructure. The United States follows closely with a CAGR of 6.3%, supported by advanced animal agriculture, strong regulatory frameworks, and innovation in micronutrient delivery systems. India, growing at 6.2%, benefits from rapid expansion in poultry and dairy sectors, government-led awareness campaigns, and modernization of feed production facilities tailored to regional livestock needs. Brazil’s market grows at 6.1%, fueled by a robust meat export industry, sustainable nutrition practices, and investments in feed mill modernization. The United Kingdom sustains a steady CAGR of 6.0%, emphasizing sustainability, animal welfare, and regulatory compliance, backed by innovations in eco-friendly micronutrient blends.

The report covers an in-depth analysis of 40+ countries; five top-performing OECD countries are highlighted below.

Production Capacity Trends in Feed Micronutrients Market in China

Revenue from feed micronutrients in China is growing at a CAGR of 6.4%, driven by rapid industrialization and modernization of livestock farming, particularly in poultry and aquaculture. The government’s focus on animal health, food safety, and sustainable farming practices is boosting demand for micronutrient-enriched feeds. Increasing investments in local production facilities and R&D centers support higher output capacities across regions. Consumer demand for high-quality meat and seafood fuels market penetration. Advances in supply chain infrastructure and stringent quality control are improving product availability and trust. Expansion of trace mineral and vitamin formulations is prominent to meet diverse livestock needs. Leading players are forging partnerships to scale production and distribution. Overall, China is consolidating its position as the largest and fastest-growing market for feed micronutrients globally.

  • Expanding feed production capacity to meet growing livestock demands.
  • Government incentives promoting feed quality and safety.
  • Increasing investments in feed additive manufacturing infrastructure.

Output Expansion in Feed Micronutrients Market in United States

The USA feed micronutrients market is projected to grow at a CAGR of 6.3%, supported by large-scale, technologically advanced animal agriculture. Emphasis on improving feed efficiency and livestock health pushes output expansion in trace minerals and vitamin-enriched feeds. Strict regulatory frameworks ensure product efficacy and safety, supporting market growth. Innovation in micronutrient delivery and bioavailability enhancement is a key focus area. The shift toward sustainable farming practices and clean-label animal products increases adoption rates. Investment in feed manufacturing modernization boosts production capacity, facilitating supply consistency. Leading companies are leveraging digital technologies to optimize production and supply chain operations. Market maturity is reflected in robust demand across poultry, ruminant, and swine sectors.

  • Large-scale production supporting diverse livestock micronutrient needs.
  • Regulatory compliance driving product development and safety.
  • Increasing sustainability initiatives impacting feed formulations.

Structural Adoption in Feed Micronutrients Market in India

Demand for feed micronutrients in India is growing at a CAGR of 6.2%, propelled by rapid growth in poultry and dairy production. Structural adoption involves modernization of feed production facilities and integration of micronutrient supplementation into traditional farming practices. Government schemes promoting livestock productivity and farmer education programs facilitate wider market penetration. Improving cold chain and distribution infrastructure enhance geographic reach. Rising demand for animal protein in urban areas drives volume growth. Manufacturers focus on cost-effective and innovative micronutrient blends tailored for regional livestock needs. Collaborations with local cooperatives accelerate product adoption among small-scale farmers. Overall, India’s market reflects robust structural changes supporting sustained growth.

  • Modernization of feed manufacturing plants across regions.
  • Government-led awareness campaigns boosting micronutrient use.
  • Expansion of distribution networks targeting rural farmers.

Market Development Trends in Feed Micronutrients Market in Brazil

Sales of feed micronutrients in Brazil are projected to grow at a CAGR of 6.1%, supported by the country’s strong meat export industry and significant poultry and cattle production. Market development trends include capacity expansion in feed additive manufacturing and a move toward sustainable nutrition practices. Government support for traceability and quality assurance boosts market confidence. Investments in feed mill modernizations facilitate higher precision in micronutrient blending. Growth in export-oriented livestock farming drives demand for premium feed formulations. Adoption of eco-friendly and nutrient-dense feed products is rising. Partnerships between local and global players strengthen supply chain resilience. Brazil is poised for continued growth fueled by these industry developments.

  • Expansion of feed additive production capacity.
  • Growing focus on sustainability and traceability.
  • Infrastructure upgrades supporting micronutrient precision blending.

Market Penetration and Sustainability in Feed Micronutrients Market in United Kingdom

The UK feed micronutrients market is evolving with a CAGR of 6.0%, emphasizing sustainability and animal welfare. Market penetration is driven by consumer demand for high-quality, ethically produced meat and dairy products. Regulatory frameworks ensure micronutrient use complies with safety and environmental standards. Manufacturers are adopting eco-friendly feed blends and trace mineral sources. Innovations in feed additive formulation support improved animal health and reduced environmental impact. Strong supply chains guarantee consistent availability across livestock sectors. Investment in technology enhances micronutrient bioavailability and production efficiency. The UK market balances regulatory rigor with innovation to sustain growth.
  • Emphasis on sustainable feed formulations and animal welfare.
  • Regulatory oversight ensuring high safety and quality standards.
  • Adoption of eco-friendly micronutrient sources.

Competitive Landscape of Feed Micronutrients Market

Feed Micronutrients Market By Company

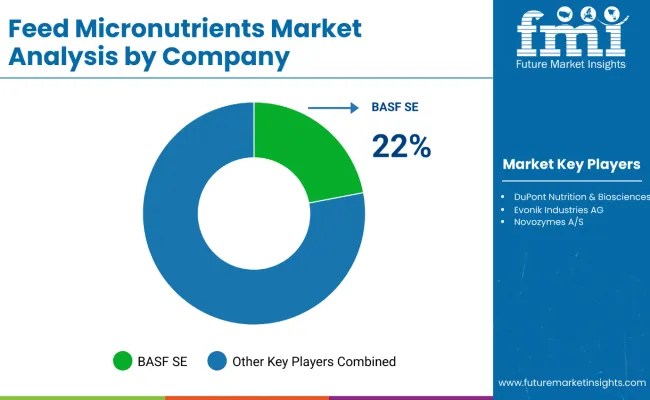
The market is moderately consolidated, dominated by established ingredient suppliers with specialized expertise in micronutrient formulation and delivery technologies. BASF SE leads the market with a strong presence in trace mineral and vitamin feed additives, backed by advanced research capabilities and regulatory compliance. DuPont Nutrition & Biosciences distinguishes itself through innovative micronutrient blends and tailored solutions addressing specific livestock nutritional needs. Evonik Industries AG and Novozymes A/S focus on sustainable sourcing and enzyme-enhanced micronutrient products to improve feed efficiency and animal health in poultry, ruminant, and aquaculture sectors.

Regional players play a key role by leveraging local market knowledge and customized formulations that meet country-specific regulatory and livestock demands, ensuring consistent supply and quality. The market presents high entry barriers given the complexity of micronutrient bioavailability, stringent safety and purity standards, and the requirement for regulatory approvals in diverse global markets. Success in this competitive landscape depends on innovation in formulation technologies, adherence to regulatory frameworks, and the ability to demonstrate improved animal performance and sustainability.

Key Developments in the Feed Micronutrients Market

In January 2025, AAFCO approved a new regulatory pathway for animal food ingredients, replacing the previous FDA-linked process. Led by K-State Olathe, the initiative provides scientific review, expert evaluation, and streamlined approval, enhancing safety, efficiency, and innovation in the animal feed industry while ensuring broader regulatory recognition.

Report Scope - Feed Micronutrients Market

Items Values
Quantitative Units (2025) USD 2.1 Billion
Product Trace Minerals, Vitamins, Carotenoids, Others (including antioxidants and enzyme cofactors)
Livestock Poultry, Ruminant, Aquaculture, Swine, Equine
Regions Covered North America, Latin America, Europe, Asia Pacific, and the Middle East & Africa (MEA).
Countries Covered United States, Canada, United Kingdom, Germany, France, China, Japan, South Korea, Brazil, Australia and 40+ countries
Key Companies Profiled Zinpro Corporation, Vamso Biotec Pvt. Ltd., Tanke Biosciences Corporation, Royal DSM, Archer Daniels Midland Company, Alltech , Inc., Ridley, Inc., Phibro Animal Health Corporation, Pancosma SA, QualiTech Corp., Mercer Milling Company, Inc., Davidsons Animal Feeds, Cargill, and Kemin Industries Inc.
Additional Attributes Dollar sales by product and livestock segment; increasing adoption of micronutrient-enriched feed formulations; growing focus on sustainable livestock farming; advancements in micronutrient delivery and bioavailability; regulatory compliance and quality standards shaping market dynamics

Key segmentation

By Product:

  • Feed Micronutrients as Trace Minerals
    • Iron
    • Zinc
    • Manganese
    • Copper
    • Boron
  • Feed Micronutrients as Vitamins
    • Vitamin A
    • Vitamin B
    • Vitamin C
    • Vitamin D
    • Vitamin K
    • Vitamin E
    • Carotenoids

By Livestock:

  • Poultry
  • Ruminant
  • Swine
  • Aquaculture
  • Others

By Region:

  • North America
  • Latin America
  • Europe
  • East Asia
  • South Asia & Pacific
  • Middle East and Africa (MEA)

Table of Content

  1. Executive Summary
    • Global Market Outlook
    • Demand-side Trends
    • Supply-side Trends
    • Technology Roadmap Analysis
    • Analysis and Recommendations
  2. Market Overview
    • Market Coverage / Taxonomy
    • Market Definition / Scope / Limitations
  3. Market Background
    • Market Dynamics
      • Drivers
      • Restraints
      • Opportunity
      • Trends
    • Scenario Forecast
      • Demand in Optimistic Scenario
      • Demand in Likely Scenario
      • Demand in Conservative Scenario
    • Opportunity Map Analysis
    • Product Life Cycle Analysis
    • Supply Chain Analysis
      • Supply Side Participants and their Roles
        • Producers
        • Mid-Level Participants (Traders/ Agents/ Brokers)
        • Wholesalers and Distributors
      • Value Added and Value Created at Node in the Supply Chain
      • List of Raw Material Suppliers
      • List of Existing and Potential Buyer’s
    • Investment Feasibility Matrix
    • Value Chain Analysis
      • Profit Margin Analysis
      • Wholesalers and Distributors
      • Retailers
    • PESTLE and Porter’s Analysis
    • Regulatory Landscape
      • By Key Regions
      • By Key Countries
    • Regional Parent Market Outlook
    • Production and Consumption Statistics
    • Import and Export Statistics
  4. Global Market Analysis 2020 to 2024 and Forecast, 2025 to 2035
    • Historical Market Size Value (USD Billion) & Volume (Metric Tons) Analysis, 2020 to 2024
    • Current and Future Market Size Value (USD Billion) & Volume (Metric Tons) Projections, 2025 to 2035
      • Y-o-Y Growth Trend Analysis
      • Absolute $ Opportunity Analysis
  5. Global Market Pricing Analysis 2020 to 2024 and Forecast 2025 to 2035
  6. Global Market Analysis 2020 to 2024 and Forecast 2025 to 2035, By Product
    • Introduction / Key Findings
    • Historical Market Size Value (USD Billion) & Volume (Metric Tons) Analysis By Product, 2020 to 2024
    • Current and Future Market Size Value (USD Billion) & Volume (Metric Tons) Analysis and Forecast By Product, 2025 to 2035
      • Trace Minerals
      • Vitamins
      • Carotenoids
      • Others (Antioxidants and Enzyme Cofactors)
    • Y-o-Y Growth Trend Analysis By Product, 2020 to 2024
    • Absolute $ Opportunity Analysis By Product, 2025 to 2035
  7. Global Market Analysis 2020 to 2024 and Forecast 2025 to 2035, By Livestock
    • Introduction / Key Findings
    • Historical Market Size Value (USD Billion) & Volume (Metric Tons) Analysis By Livestock, 2020 to 2024
    • Current and Future Market Size Value (USD Billion) & Volume (Metric Tons) Analysis and Forecast By Livestock, 2025 to 2035
      • Poultry
      • Ruminant
      • Aquaculture
      • Swine
      • Equine
    • Y-o-Y Growth Trend Analysis By Livestock, 2020 to 2024
    • Absolute $ Opportunity Analysis By Livestock, 2025 to 2035
  8. Global Market Analysis 2020 to 2024 and Forecast 2025 to 2035, By Region
    • Introduction
    • Historical Market Size Value (USD Billion) & Volume (Metric Tons) Analysis By Region, 2020 to 2024
    • Current Market Size Value (USD Billion) & Volume (Metric Tons) Analysis and Forecast By Region, 2025 to 2035
      • North America
      • Latin America
      • Western Europe
      • Eastern Europe
      • East Asia
      • South Asia & Pacific
      • Middle East and Africa
    • Market Attractiveness Analysis By Region
  9. North America Market Analysis 2020 to 2024 and Forecast 2025 to 2035, By Country
    • Historical Market Size Value (USD Billion) & Volume (Metric Tons) Trend Analysis By Market Taxonomy, 2020 to 2024
    • Market Size Value (USD Billion) & Volume (Metric Tons) Forecast By Market Taxonomy, 2025 to 2035
      • By Country
        • USA
        • Canada
        • Mexico
      • By Product
      • By Livestock
    • Market Attractiveness Analysis
      • By Country
      • By Product
      • By Livestock
    • Key Takeaways
  10. Latin America Market Analysis 2020 to 2024 and Forecast 2025 to 2035, By Country
    • Historical Market Size Value (USD Billion) & Volume (Metric Tons) Trend Analysis By Market Taxonomy, 2020 to 2024
    • Market Size Value (USD Billion) & Volume (Metric Tons) Forecast By Market Taxonomy, 2025 to 2035
      • By Country
        • Brazil
        • Argentina
        • Rest of LATAM
      • By Product
      • By Livestock
    • Market Attractiveness Analysis
      • By Country
      • By Product
      • By Livestock
    • Key Takeaways
  11. Western Europe Market Analysis 2020 to 2024 and Forecast 2025 to 2035, By Country
    • Historical Market Size Value (USD Billion) & Volume (Metric Tons) Trend Analysis By Market Taxonomy, 2020 to 2024
    • Market Size Value (USD Billion) & Volume (Metric Tons) Forecast By Market Taxonomy, 2025 to 2035
      • By Country
        • Germany
        • Italy
        • France
        • UK
        • Spain
        • BENELUX
        • Nordic
        • Rest of W.Europe
      • By Product
      • By Livestock
    • Market Attractiveness Analysis
      • By Country
      • By Product
      • By Livestock
    • Key Takeaways
  12. Eastern Europe Market Analysis 2020 to 2024 and Forecast 2025 to 2035, By Country
    • Historical Market Size Value (USD Billion) & Volume (Metric Tons) Trend Analysis By Market Taxonomy, 2020 to 2024
    • Market Size Value (USD Billion) & Volume (Metric Tons) Forecast By Market Taxonomy, 2025 to 2035
      • By Country
        • Russia
        • Hungary
        • Poland
        • Balkan & Baltics
        • Rest of E. Europe
      • By Product
      • By Livestock
    • Market Attractiveness Analysis
      • By Country
      • By Product
      • By Livestock
    • Key Takeaways
  13. East Asia Market Analysis 2020 to 2024 and Forecast 2025 to 2035, By Country
    • Historical Market Size Value (USD Billion) & Volume (Metric Tons) Trend Analysis By Market Taxonomy, 2020 to 2024
    • Market Size Value (USD Billion) & Volume (Metric Tons) Forecast By Market Taxonomy, 2025 to 2035
      • By Country
        • China
        • Japan
        • South Korea
      • By Product
      • By Livestock
    • Market Attractiveness Analysis
      • By Country
      • By Product
      • By Livestock
    • Key Takeaways
  14. South Asia & Pacific Market Analysis 2020 to 2024 and Forecast 2025 to 2035, By Country
    • Historical Market Size Value (USD Billion) & Volume (Metric Tons) Trend Analysis By Market Taxonomy, 2020 to 2024
    • Market Size Value (USD Billion) & Volume (Metric Tons) Forecast By Market Taxonomy, 2025 to 2035
      • By Country
        • India
        • Australia & New Zealand
        • ASEAN
        • Rest of SAP
      • By Product
      • By Livestock
    • Market Attractiveness Analysis
      • By Country
      • By Product
      • By Livestock
    • Key Takeaways
  15. Middle East and Africa Market Analysis 2020 to 2024 and Forecast 2025 to 2035, By Country
    • Historical Market Size Value (USD Billion) & Volume (Metric Tons) Trend Analysis By Market Taxonomy, 2020 to 2024
    • Market Size Value (USD Billion) & Volume (Metric Tons) Forecast By Market Taxonomy, 2025 to 2035
      • By Country
        • GCC Countries
        • Northern Africa
        • South Africa
        • Turkiye
        • Rest of MEA
      • By Product
      • By Livestock
    • Market Attractiveness Analysis
      • By Country
      • By Product
      • By Livestock
    • Key Takeaways
  16. Key Countries Market Analysis
    • USA
      • Pricing Analysis
      • Market Share Analysis, 2024
        • By Product
        • By Livestock
    • Canada
      • Pricing Analysis
      • Market Share Analysis, 2024
        • By Product
        • By Livestock
    • Brazil
      • Pricing Analysis
      • Market Share Analysis, 2024
        • By Product
        • By Livestock
    • Mexico
      • Pricing Analysis
      • Market Share Analysis, 2024
        • By Product
        • By Livestock
    • Argentina
      • Pricing Analysis
      • Market Share Analysis, 2024
        • By Product
        • By Livestock
  17. Market Structure Analysis
    • Competition Dashboard
    • Competition Benchmarking
    • Market Share Analysis of Top Players
      • By Regional
      • By Product
      • By Livestock
  18. Competition Analysis
    • Competition Deep Dive
      • Zinpro Corporation
        • Overview
        • Product Portfolio
        • Profitability by Market Segments (Product/Age /Sales Channel/Region)
        • Sales Footprint
        • Strategy Overview
          • Marketing Strategy
          • Product Strategy
          • Channel Strategy
      • Vamso Biotec Pvt. Ltd.
        • Overview
        • Product Portfolio
        • Profitability by Market Segments (Product/Age /Sales Channel/Region)
        • Sales Footprint
        • Strategy Overview
          • Marketing Strategy
          • Product Strategy
          • Channel Strategy
      • Tanke Biosciences Corporation
        • Overview
        • Product Portfolio
        • Profitability by Market Segments (Product/Age /Sales Channel/Region)
        • Sales Footprint
        • Strategy Overview
          • Marketing Strategy
          • Product Strategy
          • Channel Strategy
      • Royal DSM
        • Overview
        • Product Portfolio
        • Profitability by Market Segments (Product/Age /Sales Channel/Region)
        • Sales Footprint
        • Strategy Overview
          • Marketing Strategy
          • Product Strategy
          • Channel Strategy
      • Archer Daniels Midland Company
        • Overview
        • Product Portfolio
        • Profitability by Market Segments (Product/Age /Sales Channel/Region)
        • Sales Footprint
        • Strategy Overview
          • Marketing Strategy
          • Product Strategy
          • Channel Strategy
      • Alltech, Inc.
        • Overview
        • Product Portfolio
        • Profitability by Market Segments (Product/Age /Sales Channel/Region)
        • Sales Footprint
        • Strategy Overview
          • Marketing Strategy
          • Product Strategy
          • Channel Strategy
      • Ridley, Inc.
        • Overview
        • Product Portfolio
        • Profitability by Market Segments (Product/Age /Sales Channel/Region)
        • Sales Footprint
        • Strategy Overview
          • Marketing Strategy
          • Product Strategy
          • Channel Strategy
      • Phibro Animal Health Corporation
        • Overview
        • Product Portfolio
        • Profitability by Market Segments (Product/Age /Sales Channel/Region)
        • Sales Footprint
        • Strategy Overview
          • Marketing Strategy
          • Product Strategy
          • Channel Strategy
      • Pancosma SA.
        • Overview
        • Product Portfolio
        • Profitability by Market Segments (Product/Age /Sales Channel/Region)
        • Sales Footprint
        • Strategy Overview
          • Marketing Strategy
          • Product Strategy
          • Channel Strategy
      • QualiTech Corp.
        • Overview
        • Product Portfolio
        • Profitability by Market Segments (Product/Age /Sales Channel/Region)
        • Sales Footprint
        • Strategy Overview
          • Marketing Strategy
          • Product Strategy
          • Channel Strategy
      • Mercer Milling Company, Inc.
        • Overview
        • Product Portfolio
        • Profitability by Market Segments (Product/Age /Sales Channel/Region)
        • Sales Footprint
        • Strategy Overview
          • Marketing Strategy
          • Product Strategy
          • Channel Strategy
      • Davidsons Animal Feeds
        • Overview
        • Product Portfolio
        • Profitability by Market Segments (Product/Age /Sales Channel/Region)
        • Sales Footprint
        • Strategy Overview
          • Marketing Strategy
          • Product Strategy
          • Channel Strategy
      • Cargill
        • Overview
        • Product Portfolio
        • Profitability by Market Segments (Product/Age /Sales Channel/Region)
        • Sales Footprint
        • Strategy Overview
          • Marketing Strategy
          • Product Strategy
          • Channel Strategy
      • Kemin Industries Inc.
        • Overview
        • Product Portfolio
        • Profitability by Market Segments (Product/Age /Sales Channel/Region)
        • Sales Footprint
        • Strategy Overview
          • Marketing Strategy
          • Product Strategy
          • Channel Strategy
  19. Assumptions & Acronyms Used
  20. Research Methodology

List of Tables

  • Table 1: Global Market Value (USD Billion) Forecast by Region, 2020-2035
  • Table 2: Global Market Volume (Metric Tons) Forecast by Region, 2020-2035
  • Table 3: Global Market Value (USD Billion) Forecast by Product, 2020-2035
  • Table 4: Global Market Volume (Metric Tons) Forecast by Product, 2020-2035
  • Table 5: Global Market Value (USD Billion) Forecast by Livestock, 2020-2035
  • Table 6: Global Market Volume (Metric Tons) Forecast by Livestock, 2020-2035
  • Table 7: North America Market Value (USD Billion) Forecast by Country, 2020-2035
  • Table 8: North America Market Volume (Metric Tons) Forecast by Country, 2020-2035
  • Table 9: North America Market Value (USD Billion) Forecast by Product, 2020-2035
  • Table 10: North America Market Volume (Metric Tons) Forecast by Product, 2020-2035
  • Table 11: North America Market Value (USD Billion) Forecast by Livestock, 2020-2035
  • Table 12: North America Market Volume (Metric Tons) Forecast by Livestock, 2020-2035
  • Table 13: Latin America Market Value (USD Billion) Forecast by Country, 2020-2035
  • Table 14: Latin America Market Volume (Metric Tons) Forecast by Country, 2020-2035
  • Table 15: Latin America Market Value (USD Billion) Forecast by Product, 2020-2035
  • Table 16: Latin America Market Volume (Metric Tons) Forecast by Product, 2020-2035
  • Table 17: Latin America Market Value (USD Billion) Forecast by Livestock, 2020-2035
  • Table 18: Latin America Market Volume (Metric Tons) Forecast by Livestock, 2020-2035
  • Table 19: Western Europe Market Value (USD Billion) Forecast by Country, 2020-2035
  • Table 20: Western Europe Market Volume (Metric Tons) Forecast by Country, 2020-2035
  • Table 21: Western Europe Market Value (USD Billion) Forecast by Product, 2020-2035
  • Table 22: Western Europe Market Volume (Metric Tons) Forecast by Product, 2020-2035
  • Table 23: Western Europe Market Value (USD Billion) Forecast by Livestock, 2020-2035
  • Table 24: Western Europe Market Volume (Metric Tons) Forecast by Livestock, 2020-2035
  • Table 25: Eastern Europe Market Value (USD Billion) Forecast by Country, 2020-2035
  • Table 26: Eastern Europe Market Volume (Metric Tons) Forecast by Country, 2020-2035
  • Table 27: Eastern Europe Market Value (USD Billion) Forecast by Product, 2020-2035
  • Table 28: Eastern Europe Market Volume (Metric Tons) Forecast by Product, 2020-2035
  • Table 29: Eastern Europe Market Value (USD Billion) Forecast by Livestock, 2020-2035
  • Table 30: Eastern Europe Market Volume (Metric Tons) Forecast by Livestock, 2020-2035
  • Table 31: East Asia Market Value (USD Billion) Forecast by Country, 2020-2035
  • Table 32: East Asia Market Volume (Metric Tons) Forecast by Country, 2020-2035
  • Table 33: East Asia Market Value (USD Billion) Forecast by Product, 2020-2035
  • Table 34: East Asia Market Volume (Metric Tons) Forecast by Product, 2020-2035
  • Table 35: East Asia Market Value (USD Billion) Forecast by Livestock, 2020-2035
  • Table 36: East Asia Market Volume (Metric Tons) Forecast by Livestock, 2020-2035
  • Table 37: South Asia & Pacific Market Value (USD Billion) Forecast by Country, 2020-2035
  • Table 38: South Asia & Pacific Market Volume (Metric Tons) Forecast by Country, 2020-2035
  • Table 39: South Asia & Pacific Market Value (USD Billion) Forecast by Product, 2020-2035
  • Table 40: South Asia & Pacific Market Volume (Metric Tons) Forecast by Product, 2020-2035
  • Table 41: South Asia & Pacific Market Value (USD Billion) Forecast by Livestock, 2020-2035
  • Table 42: South Asia & Pacific Market Volume (Metric Tons) Forecast by Livestock, 2020-2035
  • Table 43: Middle East and Africa Market Value (USD Billion) Forecast by Country, 2020-2035
  • Table 44: Middle East and Africa Market Volume (Metric Tons) Forecast by Country, 2020-2035
  • Table 45: Middle East and Africa Market Value (USD Billion) Forecast by Product, 2020-2035
  • Table 46: Middle East and Africa Market Volume (Metric Tons) Forecast by Product, 2020-2035
  • Table 47: Middle East and Africa Market Value (USD Billion) Forecast by Livestock, 2020-2035
  • Table 48: Middle East and Africa Market Volume (Metric Tons) Forecast by Livestock, 2020-2035

List of Figures

  • Figure 1: Global Market Volume (Metric Tons) Forecast 2020-2035
  • Figure 2: Global Market Pricing Analysis
  • Figure 3: Global Market Value (USD Billion) Forecast 2020-2035
  • Figure 4: Global Market Value Share and BPS Analysis by Product, 2025 and 2035
  • Figure 5: Global Market Y-o-Y Growth Comparison by Product, 2025-2035
  • Figure 6: Global Market Attractiveness Analysis by Product
  • Figure 7: Global Market Value Share and BPS Analysis by Livestock, 2025 and 2035
  • Figure 8: Global Market Y-o-Y Growth Comparison by Livestock, 2025-2035
  • Figure 9: Global Market Attractiveness Analysis by Livestock
  • Figure 10: Global Market Value (USD Billion) Share and BPS Analysis by Region, 2025 and 2035
  • Figure 11: Global Market Y-o-Y Growth Comparison by Region, 2025-2035
  • Figure 12: Global Market Attractiveness Analysis by Region
  • Figure 13: North America Market Incremental $ Opportunity, 2025-2035
  • Figure 14: Latin America Market Incremental $ Opportunity, 2025-2035
  • Figure 15: Western Europe Market Incremental $ Opportunity, 2025-2035
  • Figure 16: Eastern Europe Market Incremental $ Opportunity, 2025-2035
  • Figure 17: East Asia Market Incremental $ Opportunity, 2025-2035
  • Figure 18: South Asia & Pacific Market Incremental $ Opportunity, 2025-2035
  • Figure 19: Middle East and Africa Market Incremental $ Opportunity, 2025-2035
  • Figure 20: North America Market Value Share and BPS Analysis by Country, 2025 and 2035
  • Figure 21: North America Market Value Share and BPS Analysis by Product, 2025 and 2035
  • Figure 22: North America Market Y-o-Y Growth Comparison by Product, 2025-2035
  • Figure 23: North America Market Attractiveness Analysis by Product
  • Figure 24: North America Market Value Share and BPS Analysis by Livestock, 2025 and 2035
  • Figure 25: North America Market Y-o-Y Growth Comparison by Livestock, 2025-2035
  • Figure 26: North America Market Attractiveness Analysis by Livestock
  • Figure 27: Latin America Market Value Share and BPS Analysis by Country, 2025 and 2035
  • Figure 28: Latin America Market Value Share and BPS Analysis by Product, 2025 and 2035
  • Figure 29: Latin America Market Y-o-Y Growth Comparison by Product, 2025-2035
  • Figure 30: Latin America Market Attractiveness Analysis by Product
  • Figure 31: Latin America Market Value Share and BPS Analysis by Livestock, 2025 and 2035
  • Figure 32: Latin America Market Y-o-Y Growth Comparison by Livestock, 2025-2035
  • Figure 33: Latin America Market Attractiveness Analysis by Livestock
  • Figure 34: Western Europe Market Value Share and BPS Analysis by Country, 2025 and 2035
  • Figure 35: Western Europe Market Value Share and BPS Analysis by Product, 2025 and 2035
  • Figure 36: Western Europe Market Y-o-Y Growth Comparison by Product, 2025-2035
  • Figure 37: Western Europe Market Attractiveness Analysis by Product
  • Figure 38: Western Europe Market Value Share and BPS Analysis by Livestock, 2025 and 2035
  • Figure 39: Western Europe Market Y-o-Y Growth Comparison by Livestock, 2025-2035
  • Figure 40: Western Europe Market Attractiveness Analysis by Livestock
  • Figure 41: Eastern Europe Market Value Share and BPS Analysis by Country, 2025 and 2035
  • Figure 42: Eastern Europe Market Value Share and BPS Analysis by Product, 2025 and 2035
  • Figure 43: Eastern Europe Market Y-o-Y Growth Comparison by Product, 2025-2035
  • Figure 44: Eastern Europe Market Attractiveness Analysis by Product
  • Figure 45: Eastern Europe Market Value Share and BPS Analysis by Livestock, 2025 and 2035
  • Figure 46: Eastern Europe Market Y-o-Y Growth Comparison by Livestock, 2025-2035
  • Figure 47: Eastern Europe Market Attractiveness Analysis by Livestock
  • Figure 48: East Asia Market Value Share and BPS Analysis by Country, 2025 and 2035
  • Figure 49: East Asia Market Value Share and BPS Analysis by Product, 2025 and 2035
  • Figure 50: East Asia Market Y-o-Y Growth Comparison by Product, 2025-2035
  • Figure 51: East Asia Market Attractiveness Analysis by Product
  • Figure 52: East Asia Market Value Share and BPS Analysis by Livestock, 2025 and 2035
  • Figure 53: East Asia Market Y-o-Y Growth Comparison by Livestock, 2025-2035
  • Figure 54: East Asia Market Attractiveness Analysis by Livestock
  • Figure 55: South Asia & Pacific Market Value Share and BPS Analysis by Country, 2025 and 2035
  • Figure 56: South Asia & Pacific Market Value Share and BPS Analysis by Product, 2025 and 2035
  • Figure 57: South Asia & Pacific Market Y-o-Y Growth Comparison by Product, 2025-2035
  • Figure 58: South Asia & Pacific Market Attractiveness Analysis by Product
  • Figure 59: South Asia & Pacific Market Value Share and BPS Analysis by Livestock, 2025 and 2035
  • Figure 60: South Asia & Pacific Market Y-o-Y Growth Comparison by Livestock, 2025-2035
  • Figure 61: South Asia & Pacific Market Attractiveness Analysis by Livestock
  • Figure 62: Middle East and Africa Market Value Share and BPS Analysis by Country, 2025 and 2035
  • Figure 63: Middle East and Africa Market Value Share and BPS Analysis by Product, 2025 and 2035
  • Figure 64: Middle East and Africa Market Y-o-Y Growth Comparison by Product, 2025-2035
  • Figure 65: Middle East and Africa Market Attractiveness Analysis by Product
  • Figure 66: Middle East and Africa Market Value Share and BPS Analysis by Livestock, 2025 and 2035
  • Figure 67: Middle East and Africa Market Y-o-Y Growth Comparison by Livestock, 2025-2035
  • Figure 68: Middle East and Africa Market Attractiveness Analysis by Livestock
  • Figure 69: Global Market - Tier Structure Analysis
  • Figure 70: Global Market - Company Share Analysis

Frequently Asked Questions

How big is the feed micronutrients market in 2025?

The global feed micronutrients market is estimated to be valued at USD 2.1 billion in 2025.

What will be the size of feed micronutrients market in 2035?

The feed micronutrients market size is projected to reach USD 3.9 billion by 2035.

How much will be the feed micronutrients market growth between 2025 and 2035?

The feed micronutrients market is expected to grow at a 6.3% CAGR between 2025 and 2035.

Which product segment is projected to lead in the feed micronutrients market in 2025?

Trace minerals are projected to lead the feed micronutrients market with a 60% market share in 2025.

Which livestock segment will contribute significant share in the feed micronutrients market in 2025?

In terms of livestock, the poultry segment is expected to command 60% share in the feed micronutrients market in 2025.

Explore Similar Insights

Future Market Insights

Feed Micronutrients Market