Feed Phytogenic Market Size and Share Forecast Outlook 2025 to 2035

The global feed phytogenic market is set to witness substantial expansion, growing from USD 838.02 million in 2025 to USD 2,193.4 million by 2035, registering a healthy CAGR of 10.1%.
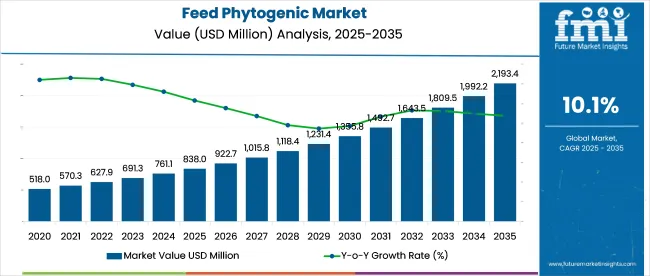
Quick Stats of Feed Phytogenic Market

  • Market Value (2025): USD 838.02 million
  • Forecast Value (2035): USD 2,193.4 million
  • Forecast CAGR (2025 to 2035): 10.1%
  • Leading Segment in 2025: Performance Enhancers(62.3% share)
  • Key Growth Region: North America (United States is the fastest growing market with 6.1% CAGR)
  • Key Players: Phytobiotics Futterzusatzstoffe GmbH, Biomin GmbH, DowDuPont, Pancosma, Delacon Biotechnik GmbH, Igusol, Natural Remedies Pvt. Ltd., Nutricare Life Sciences Limited, Dostofarm GmbH, Natural Herbs & Formulations, and other market players.

Feed Phytogenic Market

Attribute Values
Estimated Industry Size (2025E) USD 838.02 million
Projected Industry Value (2035F) USD 2,193.4 million
CAGR (2025 to 2035) 10.1%

This growth reflects a major transformation in global livestock production practices, particularly the increasing focus on plant-based additives as natural alternatives to antibiotic growth promoters (AGPs). Phytogenics, bioactive compounds derived from plants, such as herbs, spices, and essential oils, are being widely adopted in animal diets for their proven benefits in enhancing gut health, supporting immune function, and improving feed conversion ratios. Their integration into commercial livestock feed is driven by a combination of regulatory enforcement, consumer demand for clean-label meat, and ongoing in formulation technologies.

The industry accounts for 6-8% share of the global animal feed additives market, which itself is valued at over USD 11-13 billion. Within the animal nutrition market, which includes a broader range of supplements and feed ingredients, phytogenics represent a smaller share-around 2-3%, given their specialized functional use.

In the livestock feed market, estimated to exceed USD 500 billion globally, feed phytogenics contribute less than 1% by value, though their influence on performance and feed quality is disproportionately high. In the natural feed additives and functional ingredients for animal health segments, feed phytogenics hold a stronger position, comprising 15-20% due to growing demand for clean-label, residue-free alternatives to antibiotics in both developed and emerging livestock production systems.

The industry involves a multi-layered network of stakeholders-beginning with raw material suppliers of herbs, spices, and essential oils. These plant-derived materials are processed and standardized by phytogenic additive manufacturers, often employing technologies such as steam distillation or solvent extraction. The formulated phytogenic ingredients are then sold to premix and feed manufacturers, who incorporate them into complete feed products or additive premixes tailored for specific livestock.

Distribution channels include both direct B2B sales to integrators and indirect sales through distributors to independent farms. The value chain also involves contract research organizations and quality assurance entities ensuring standardization and efficacy, particularly as demand grows in key markets like Europe, Asia-Pacific, and Latin America.

Analysis of Feed Phytogenic Market by Top Investment Segments 

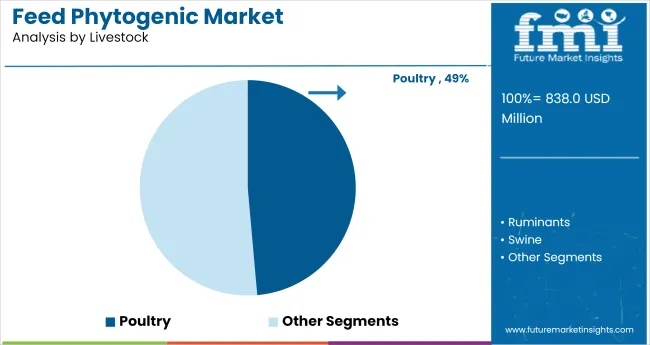
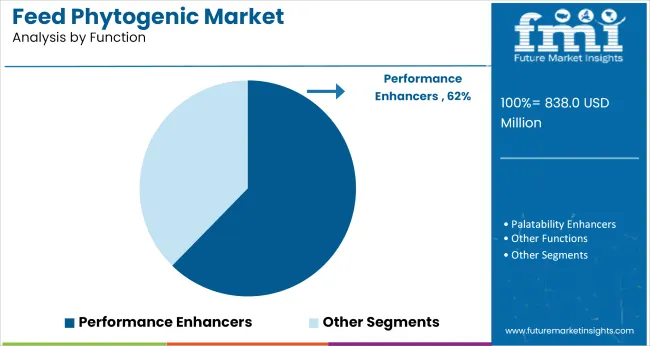
In 2025, essential oils dominate the feed phytogenic market with a 55.6% share due to their antimicrobial and performance-enhancing benefits, while the poultry segment leads livestock applications with a 48.6% share, driven by the need for antibiotic-free growth solutions. Performance enhancers top functional demand, holding a 62.3% share, as producers prioritize feed efficiency and productivity across species.
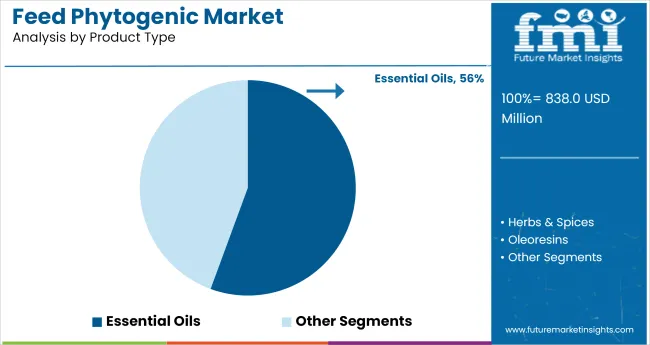
Essential Oils accounts for 55.6% Market Share in 2025

Feed Phytogenic Market By Product Type

Essential oils dominate the market with a substantial 55.6% market share in 2025, making them the most widely used product type within the segment. Their leadership stems from their powerful antimicrobial, antioxidant, and anti-inflammatory properties, which help improve feed efficiency, gut health, and immune function in livestock.
  • Key active compounds like thymol, carvacrol, eugenol, and cinnamaldehyde are known to enhance digestion, reduce pathogenic load, and support animal performance.
  • Essential oils are also highly compatible with pelleted and premix feed forms, making them a versatile option for commercial feed manufacturers.
  • The global reduction of antibiotic growth promoters (AGPs) has accelerated their demand as safe, residue-free alternatives.

By Livestock, Poultry Segment Accounts for Over 48.6% Share

Feed Phytogenic Market By Livestock

The poultry segment stands as the leading consumer of feed phytogenics globally, with a commanding 48.6% market share in 2025. This dominance is primarily driven by the intensive nature of poultry farming, where feed efficiency, gut health, and growth performance are critical for profitability.
  • The poultry industry, particularly broiler and layer production, faces strict regulations on antibiotic usage, pushing producers to adopt natural growth promoters such as phytogenics.
  • Essential oils, flavonoids, and saponins are increasingly incorporated into poultry diets to boost nutrient absorption, balance gut microbiota, and reduce mortality rates.
  • Consumer demand for antibiotic-free chicken meat and eggs continues to rise, prompting large-scale producers to integrate phytogenic additives as part of their clean-label and production strategies.

Performance Enhancers Lead Product Demand

Feed Phytogenic Market By Function

Performance enhancerslead the functional segmentation of the market, accounting for a significants 62.3% market share in 2025. This dominance is primarily due to the rising demand for natural solutions that improve feed conversion ratios (FCR), growth rates, and animal productivity.

  • Phytogenic additives classified as performance enhancers, such as essential oils and plant extracts, positively influence digestion, nutrient absorption, and gut microbiota balance, thereby improving animal performance without the need for antibiotics.
  • Livestock producers, especially in poultry and swine farming, are under increasing pressure to maintain high productivity standards while complying with stringent restrictions on antibiotic growth promoters.
  • The effectiveness of these enhancers across various species and feed systems ensures their continued dominance within the functional landscape of phytogenic feed additives.

Top Feed Phytogenic Market Dynamics

Growing consumer demand for antibiotic-free, clean-label animal products and tightening global regulations on AGPs are driving the rapid adoption of phytogenic feed additives. Producers are increasingly turning to natural solutions to meet food safety standards and maintain animal health.

Rising Consumer Demand for Antibiotic-Free Animal Products

Growing awareness around food safety, antibiotic resistance, and residue-free meat has fueled a global shift in consumer preferences toward naturally raised livestock products. This trend is driving feed producers and integrators to replace antibiotic growth promoters with plant-based alternatives like phytogenics.

Consumers in developed markets, as well as health-conscious segments in emerging economies, are actively seeking poultry, meat, and dairy products sourced from animals fed on natural diets. This shift is influencing regulatory policies and pushing producers toward clean-label practices.

  • Increased demand for residue-free meat and eggs
  • Growing public concern over antimicrobial resistance
  • Consumer preference for clean-label animal products

Regulatory Pressure on Antibiotic Growth Promoters (AGPs)

Tightening regulatory frameworks across key livestock-producing regions have become a major catalyst for the adoption of phytogenic feed additives. Countries in the European Union have long banned AGPs, and similar trends are emerging across Asia and Latin America. Regulatory compliance is no longer optional, forcing producers to look for effective natural substitutes that ensure animal health and productivity without antibiotics. As governments promote safe animal husbandry practices, phytogenics have emerged as a viable solution.
  • Global bans and restrictions on AGPs
  • Mandatory compliance with residue and traceability norms
  • Rise in regulatory audits across livestock operations

Analysis of Top Countries Producing and Specializing Feed Phytogenic Globally

Country Wise Analysis Of Feed Phytogenic Market

The report covers a detailed analysis of 40+ countries and the top five countries have been shared as a reference.

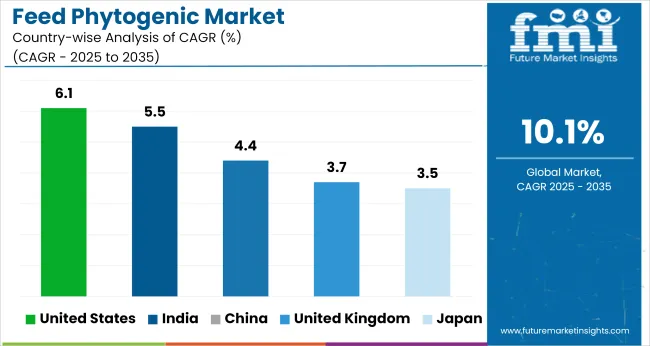
Countries CAGR (2025 to 2035)
United States 6.1%
United Kingdom 3.7%
Japan 3.5%
China 4.4%
India 5.5%

The feed phytogenic market is projected to grow at varying rates across key global economies. The United States, with a CAGR of 6.1%, leads among developed nations due to its advanced regulatory enforcement and rising demand for antibiotic-free meat, while India follows with 5.5%, driven by rapid poultry sector expansion and urban demand for safe protein.

China is set to grow at 4.4%, supported by large-scale swine farming and a post-ASF focus on practices. The United Kingdom (3.7%) and Japan (3.5%) reflect more mature markets emphasizing food safety and ethical production. The USA, UK, and Japan belong to the OECD, while China and India are part of BRICS, showing divergent maturity and growth dynamics.

Growth Analysis of Feed Phytogenic Market in the United States

The USA feed phytogenic market is anticipated to expand at a CAGR of 6.1% from 2025 to 2035, reflecting the country's gradual yet steady shift toward natural feed solutions amid strong food safety regulations and consumer advocacy for antibiotic-free meat. Although the CAGR is below the global average, the USA market remains highly lucrative due to its scale, technological infrastructure, and pressure on producers to eliminate AGPs.

Large-scale poultry and swine producers are incorporating phytogenic additives to meet rising retail and export standards for clean-label meat. Consumer demand is further supported by health-conscious purchasing behavior and stringent USDA oversight. With major players like Cargill and Kemin based in the region, product and supply chain efficiency also contribute to market momentum.

  • Robust demand for antibiotic-free poultry and pork in mainstream retail
  • Strong presence of multinational feed additive companies
  • Strict USDA and FDA regulations pushing producers toward natural alternatives

Demand Forecast for Feed Phytogenic Market in India

India’s feed phytogenic market is projected to grow at a CAGR of 5.5% from 2025 to 2035, driven by the country’s large and expanding livestock population, particularly in poultry and dairy sectors. Although still emerging compared to mature markets, India shows strong potential due to increasing awareness about antibiotic residues and rising exports of meat and animal products.

Regulatory attention is growing, and consumers in urban centers are demanding safer, quality-assured animal protein. Indian feed manufacturers are increasingly partnering with global and regional phytogenic suppliers to develop cost-effective, performance-enhancing solutions for commercial poultry and aquaculture. The expansion of contract poultry farming and organized livestock systems is also boosting phytogenic adoption.

  • Expanding poultry production and consumption in urban and semi-urban areas
  • Rising awareness about food safety and AGP restrictions
  • Collaborations between local feed mills and international phytogenic brands

Outlook for Feed Phytogenic Market Expansion in China

China’s feed phytogenic market is expected to register a CAGR of 4.4% between 2025 and 2035, as the country transitions toward safer, animal production systems in the post-ASF (African Swine Fever) era. While the CAGR is below the global average, China's volume potential is immense due to the size of its livestock industry.

The government’s increasing scrutiny on antibiotic use, coupled with consumer demand for residue-free pork and poultry, is gradually driving phytogenic adoption. Feed producers and integrators are under pressure to meet both domestic quality expectations and international trade standards. Domestic manufacturers are investing in local production of plant-derived feed solutions, helping reduce dependency on imports.

  • Large-scale swine and poultry operations seeking alternatives to AGPs
  • Government-led antibiotic reduction initiatives post-ASF outbreak
  • Growth in domestic phytogenic production to serve regional demand

Future Prospects for Feed Phytogenic Market in the United Kingdom

The feed phytogenic market in the United Kingdom is forecast to grow at a CAGR of approximately 3.7% from 2025 to 2035, supported by the country’s proactive stance on food traceability, antibiotic-free meat production, and animal welfare.

Although the CAGR trails global growth rates, the UK presents a mature, regulated environment that supports the long-term adoption of phytogenic additives. Poultry and dairy producers are increasingly reformulating feed with plant-based ingredients to meet both regulatory and supermarket-driven standards.

Consumer preferences strongly favor natural, ethically produced meat, making phytogenics a strategic priority for integrators and contract farmers alike. Post-Brexit trade realignments are prompting exporters to align more closely with EU-style production standards.

  • High consumer demand for ethical and antibiotic-free meat products
  • Strong retailer influences encouraging feed reformulation
  • Compliance with UK/EU-level food safety and animal health standards

Feed Phytogenic Market Growth Overview in Japan

Japan’s feed phytogenic market is projected to grow at a CAGR of 3.5% from 2025 to 2035, shaped by its focus on premium-quality meat, animal health, and food safety. Although the market is relatively small in volume, it is characterized by high-value applications, particularly in swine and poultry segments.

The country’s strict food safety regulations and aging population are pushing for safer animal protein with fewer chemical residues. Japan also emphasizes traceability, encouraging livestock producers to adopt feed solutions that align with consumer expectations for transparency and clean-label nutrition. Imported phytogenic ingredients, especially essential oils, are gaining traction in niche and specialized farming systems.
  • Focus on premium, residue-free meat aligned with consumer health concerns
  • Strong traceability and food safety enforcement by Japanese authorities
  • Demand for phytogenics in high-value animal protein production systems

Leading Feed Phytogenic Suppliers

Feed Phytogenic Market By Company

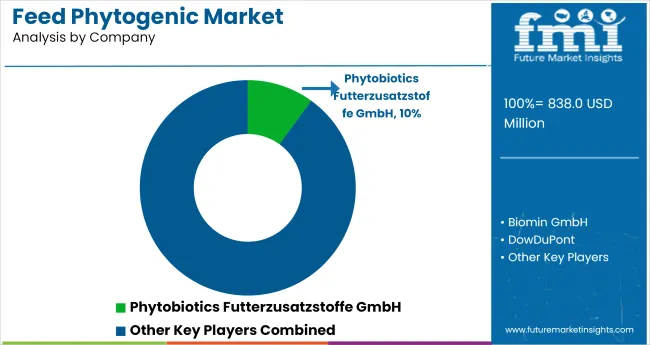
In the feed phytogenic market, key players are leveraging plant-based, regulatory compliance, and species-specific formulations to gain competitive advantage. Companies like Phytobiotics Futterzusatzstoffe GmbH, Biomin GmbH, and Delacon Biotechnik GmbH are advancing precision-formulated additives using essential oils and plant extracts to enhance gut health and feed efficiency, particularly in poultry and swine. Multinational firms such as DowDuPont and Pancosma are capitalizing on global distribution and R&D infrastructure to scale their phytogenic portfolios across regulated and emerging markets.

Regional players like Natural Remedies Pvt. Ltd., Nutricare Life Sciences Limited, and Igusol are addressing local demand with cost-effective blends tailored for high-growth countries. Companies such as Dostofarm GmbH and Natural Herbs & Formulations are focusing on residue-free certification and clean-label ingredients. Competitive dynamics are increasingly shaped by the shift away from antibiotic growth promoters, driving players to invest in traceable sourcing, microencapsulation technology, and performance-driven formulations.

Recent Feed Phytogenic Industry News

  • In February 2025 Phytobiotics Futterzusatzstoffe GmbH announced the formation of a joint venture with Feed Expert Sp. z o.o., resulting in the creation of Phytobiotics CEE Sp. z o.o. in Poland. This partnership is designed to expand the company’s presence and deliver innovative feed additive solutions across Central and Eastern Europe.

Leading Players

  • Phytobiotics Futterzusatzstoffe GmbH
  • Biomin GmbH
  • DowDuPont
  • Pancosma
  • Delacon Biotechnik GmbH
  • Igusol
  • Natural Remedies Pvt. Ltd.
  • Nutricare Life Sciences Limited
  • Dostofarm GmbH
  • Natural Herbs & Formulations
  • Other Market Players

Report Coverage and Scope Summary

Report Attributes Details
Market Size (2025) USD 838.02 million
Projected Market Size (2035) USD 2,193.4 million
CAGR (2025 to 2035) 10.1%
Base Year for Estimation 2024
Historical Period 2020 to 2024
Projections Period 2025 to 2035
Quantitative Units USD million for value and volume in metric tons
Product Type Analyzed (Segment 1) Essential Oils, Herbs & Spices, Oleoresins, and Other Product Types.
Livestock Analyzed (Segment 2) Poultry, Ruminants, Swine, Aquatic Animals, and Other Livestock Animals.
Function Analyzed (Segment 3) Performance Enhancers, Palatability Enhancers, and Other Functions.
Regions Covered North America, Europe, Asia Pacific, Middle East & Africa, Latin America
Countries Covered United States, Canada, Germany, United Kingdom, France, Italy, Spain, China, Japan, South Korea, India, Australia, Brazil, Mexico, Argentina, Saudi Arabia, UAE, South Africa
Key Players Phytobiotics Futterzusatzstoffe GmbH, Biomin GmbH, DowDuPont, Pancosma, Delacon Biotechnik GmbH, Igusol, Natural Remedies Pvt. Ltd., Nutricare Life Sciences Limited, Dostofarm GmbH, Natural Herbs & Formulations, and other market players.
Additional Attributes Dollar sales, share, leading product types, fastest-growing livestock segments, regional demand trends, key competitors, distribution channels, regulatory shifts, and future growth opportunities.

Key Segments

By Product Type:

The industry is segmented into essential oils, herbs & spices, oleoresins, and other product types.

By Livestock:

The industry is segmented into poultry, ruminants, swine, aquatic animals, and other livestock animals.

By Function:

The industry finds performance enhancers, palatability enhancers, and other functions.

By Region:

The industry covers regions including North America, Europe, Asia Pacific, Latin America, and the Middle East & Africa.

Table of Content

  1. Executive Summary
    • Global Market Outlook
    • Demand-side Trends
    • Supply-side Trends
    • Technology Roadmap Analysis
    • Analysis and Recommendations
  2. Market Overview
    • Market Coverage/Taxonomy
    • Market Definition/Scope/Limitations
  3. Market Background
    • Market Dynamics
      • Drivers
      • Restraints
      • Opportunity
      • Trends
    • Scenario Forecast
      • Demand in Optimistic Scenario
      • Demand in Likely Scenario
      • Demand in Conservative Scenario
    • Opportunity Map Analysis
    • Product Life Cycle Analysis
    • Supply Chain Analysis
      • Supply Side Participants and their Roles
        • Producers
        • Mid-Level Participants (Traders/ Agents/ Brokers)
        • Wholesalers and Distributors
      • Value Added and Value Created at Node in the Supply Chain
      • List of Raw Material Suppliers
      • List of Existing and Potential Buyer’s
    • Investment Feasibility Matrix
    • Value Chain Analysis
      • Profit Margin Analysis
      • Wholesalers and Distributors
      • Retailers
    • PESTLE and Porter’s Analysis
    • Regulatory Landscape
      • By Key Regions
      • By Key Countries
    • Regional Parent Market Outlook
    • Production and Consumption Statistics
    • Import and Export Statistics
  4. Global Market Analysis 2020 to 2024 and Forecast, 2025 to 2035
    • Historical Market Size Value (USD Million) & Volume (Metric tons) Analysis, 2020 to 2024
    • Current and Future Market Size Value (USD Million) & Volume (Metric tons) Projections, 2025 to 2035
      • Y-o-Y Growth Trend Analysis
      • Absolute $ Opportunity Analysis
  5. Global Market Pricing Analysis 2020 to 2024 and Forecast 2025 to 2035
  6. Global Market Analysis 2020 to 2024 and Forecast 2025 to 2035, By Product Type
    • Introduction/Key Findings
    • Historical Market Size Value (USD Million) & Volume (Metric tons) Analysis By Product Type, 2020 to 2024
    • Current and Future Market Size Value (USD Million) & Volume (Metric tons) Analysis and Forecast By Product Type, 2025 to 2035
      • Essential Oils
      • Herbs & Spices
      • Oleoresins
      • Others Product Type
      • Ice Cream & Yoghurt
    • Y-o-Y Growth Trend Analysis By Product Type, 2020 to 2024
    • Absolute $ Opportunity Analysis By Product Type, 2025 to 2035
  7. Global Market Analysis 2020 to 2024 and Forecast 2025 to 2035, By Livestock
    • Introduction/Key Findings
    • Historical Market Size Value (USD Million) & Volume (Metric tons) Analysis By Livestock, 2020 to 2024
    • Current and Future Market Size Value (USD Million) & Volume (Metric tons) Analysis and Forecast By Livestock, 2025 to 2035
      • Poultry
      • Ruminants
      • Swine
      • Aquatic Animals
      • Other Livestock Animals
    • Y-o-Y Growth Trend Analysis By Livestock, 2020 to 2024
    • Absolute $ Opportunity Analysis By Livestock, 2025 to 2035
  8. Global Market Analysis 2020 to 2024 and Forecast 2025 to 2035, By Function
    • Introduction/Key Findings
    • Historical Market Size Value (USD Million) & Volume (Metric tons) Analysis By Function, 2020 to 2024
    • Current and Future Market Size Value (USD Million) & Volume (Metric tons) Analysis and Forecast By Function, 2025 to 2035
      • Performance Enhancers
      • Palatability Enhancers
      • Other Functions
    • Y-o-Y Growth Trend Analysis By Function, 2020 to 2024
    • Absolute $ Opportunity Analysis By Function, 2025 to 2035
  9. Global Market Analysis 2020 to 2024 and Forecast 2025 to 2035, By Region
    • Introduction
    • Historical Market Size Value (USD Million) & Volume (Metric tons) Analysis By Region, 2020 to 2024
    • Current Market Size Value (USD Million) & Volume (Metric tons) Analysis and Forecast By Region, 2025 to 2035
      • North America
      • Latin America
      • Western Europe
      • Eastern Europe
      • East Asia
      • South Asia & Pacific
      • Middle East and Africa
    • Market Attractiveness Analysis By Region
  10. North America Market Analysis 2020 to 2024 and Forecast 2025 to 2035, By Country
    • Historical Market Size Value (USD Million) & Volume (Metric tons) Trend Analysis By Market Taxonomy, 2020 to 2024
    • Market Size Value (USD Million) & Volume (Metric tons) Forecast By Market Taxonomy, 2025 to 2035
      • By Country
        • USA
        • Canada
        • Mexico
      • By Product Type
      • By Livestock
      • By Function
    • Market Attractiveness Analysis
      • By Country
      • By Product Type
      • By Livestock
      • By Function
    • Key Takeaways
  11. Latin America Market Analysis 2020 to 2024 and Forecast 2025 to 2035, By Country
    • Historical Market Size Value (USD Million) & Volume (Metric tons) Trend Analysis By Market Taxonomy, 2020 to 2024
    • Market Size Value (USD Million) & Volume (Metric tons) Forecast By Market Taxonomy, 2025 to 2035
      • By Country
        • Brazil
        • Argentina
        • Rest of LATAM
      • By Product Type
      • By Livestock
      • By Function
    • Market Attractiveness Analysis
      • By Country
      • By Product Type
      • By Livestock
      • By Function
    • Key Takeaways
  12. Western Europe Market Analysis 2020 to 2024 and Forecast 2025 to 2035, By Country
    • Historical Market Size Value (USD Million) & Volume (Metric tons) Trend Analysis By Market Taxonomy, 2020 to 2024
    • Market Size Value (USD Million) & Volume (Metric tons) Forecast By Market Taxonomy, 2025 to 2035
      • By Country
        • Germany
        • Italy
        • France
        • UK
        • Spain
        • BENELUX
        • Nordic
        • Rest of W.Europe
      • By Product Type
      • By Livestock
      • By Function
    • Market Attractiveness Analysis
      • By Country
      • By Product Type
      • By Livestock
      • By Function
    • Key Takeaways
  13. Eastern Europe Market Analysis 2020 to 2024 and Forecast 2025 to 2035, By Country
    • Historical Market Size Value (USD Million) & Volume (Metric tons) Trend Analysis By Market Taxonomy, 2020 to 2024
    • Market Size Value (USD Million) & Volume (Metric tons) Forecast By Market Taxonomy, 2025 to 2035
      • By Country
        • Russia
        • Hungary
        • Poland
        • Balkan & Baltics
        • Rest of E. Europe
      • By Product Type
      • By Livestock
      • By Function
    • Market Attractiveness Analysis
      • By Country
      • By Product Type
      • By Livestock
      • By Function
    • Key Takeaways
  14. East Asia Market Analysis 2020 to 2024 and Forecast 2025 to 2035, By Country
    • Historical Market Size Value (USD Million) & Volume (Metric tons) Trend Analysis By Market Taxonomy, 2020 to 2024
    • Market Size Value (USD Million) & Volume (Metric tons) Forecast By Market Taxonomy, 2025 to 2035
      • By Country
        • China
        • Japan
        • South Korea
      • By Product Type
      • By Livestock
      • By Function
    • Market Attractiveness Analysis
      • By Country
      • By Product Type
      • By Livestock
      • By Function
    • Key Takeaways
  15. South Asia & Pacific Market Analysis 2020 to 2024 and Forecast 2025 to 2035, By Country
    • Historical Market Size Value (USD Million) & Volume (Metric tons) Trend Analysis By Market Taxonomy, 2020 to 2024
    • Market Size Value (USD Million) & Volume (Metric tons) Forecast By Market Taxonomy, 2025 to 2035
      • By Country
        • India
        • Australia & New Zealand
        • ASEAN
        • Rest of SAP
      • By Product Type
      • By Livestock
      • By Function
    • Market Attractiveness Analysis
      • By Country
      • By Product Type
      • By Livestock
      • By Function
    • Key Takeaways
  16. Middle East and Africa Market Analysis 2020 to 2024 and Forecast 2025 to 2035, By Country
    • Historical Market Size Value (USD Million) & Volume (Metric tons) Trend Analysis By Market Taxonomy, 2020 to 2024
    • Market Size Value (USD Million) & Volume (Metric tons) Forecast By Market Taxonomy, 2025 to 2035
      • By Country
        • GCC Countries
        • Northern Africa
        • South Africa
        • Turkiye
        • Rest of MEA
      • By Product Type
      • By Livestock
      • By Function
    • Market Attractiveness Analysis
      • By Country
      • By Product Type
      • By Livestock
      • By Function
    • Key Takeaways
  17. Key Countries Market Analysis
    • USA
      • Pricing Analysis
      • Market Share Analysis, 2024
        • By Product Type
        • By Livestock
        • By Function
    • Canada
      • Pricing Analysis
      • Market Share Analysis, 2024
        • By Product Type
        • By Livestock
        • By Function
    • Brazil
      • Pricing Analysis
      • Market Share Analysis, 2024
        • By Product Type
        • By Livestock
        • By Function
    • Mexico
      • Pricing Analysis
      • Market Share Analysis, 2024
        • By Product Type
        • By Livestock
        • By Function
    • Argentina
      • Pricing Analysis
      • Market Share Analysis, 2024
        • By Product Type
        • By Livestock
        • By Function
  18. Market Structure Analysis
    • Competition Dashboard
    • Competition Benchmarking
    • Market Share Analysis of Top Players
      • By Regional
      • By Product Type
      • By Livestock
      • By Function
  19. Competition Analysis
    • Competition Deep Dive
      • Phytobiotics Futterzusatzstoffe GmbH
        • Overview
        • Product Portfolio
        • Profitability by Market Segments (Product/Age /Sales Channel/Region)
        • Sales Footprint
        • Strategy Overview
          • Marketing Strategy
          • Product Strategy
          • Channel Strategy
      • Biomin GmbH
        • Overview
        • Product Portfolio
        • Profitability by Market Segments (Product/Age /Sales Channel/Region)
        • Sales Footprint
        • Strategy Overview
          • Marketing Strategy
          • Product Strategy
          • Channel Strategy
      • DowDuPont
        • Overview
        • Product Portfolio
        • Profitability by Market Segments (Product/Age /Sales Channel/Region)
        • Sales Footprint
        • Strategy Overview
          • Marketing Strategy
          • Product Strategy
          • Channel Strategy
      • Pancosma
        • Overview
        • Product Portfolio
        • Profitability by Market Segments (Product/Age /Sales Channel/Region)
        • Sales Footprint
        • Strategy Overview
          • Marketing Strategy
          • Product Strategy
          • Channel Strategy
      • Delacon Biotechnik GmbH
        • Overview
        • Product Portfolio
        • Profitability by Market Segments (Product/Age /Sales Channel/Region)
        • Sales Footprint
        • Strategy Overview
          • Marketing Strategy
          • Product Strategy
          • Channel Strategy
      • Igusol
        • Overview
        • Product Portfolio
        • Profitability by Market Segments (Product/Age /Sales Channel/Region)
        • Sales Footprint
        • Strategy Overview
          • Marketing Strategy
          • Product Strategy
          • Channel Strategy
      • Natural Remedies Pvt. Ltd.
        • Overview
        • Product Portfolio
        • Profitability by Market Segments (Product/Age /Sales Channel/Region)
        • Sales Footprint
        • Strategy Overview
          • Marketing Strategy
          • Product Strategy
          • Channel Strategy
      • Nutricare Life Sciences Limited
        • Overview
        • Product Portfolio
        • Profitability by Market Segments (Product/Age /Sales Channel/Region)
        • Sales Footprint
        • Strategy Overview
          • Marketing Strategy
          • Product Strategy
          • Channel Strategy
      • Dostofarm GmbH
        • Overview
        • Product Portfolio
        • Profitability by Market Segments (Product/Age /Sales Channel/Region)
        • Sales Footprint
        • Strategy Overview
          • Marketing Strategy
          • Product Strategy
          • Channel Strategy
      • Natural Herbs & Formulations
        • Overview
        • Product Portfolio
        • Profitability by Market Segments (Product/Age /Sales Channel/Region)
        • Sales Footprint
        • Strategy Overview
          • Marketing Strategy
          • Product Strategy
          • Channel Strategy
      • Other Market Players
        • Overview
        • Product Portfolio
        • Profitability by Market Segments (Product/Age /Sales Channel/Region)
        • Sales Footprint
        • Strategy Overview
          • Marketing Strategy
          • Product Strategy
          • Channel Strategy
  20. Assumptions & Acronyms Used
  21. Research Methodology

List of Tables

  • Table 1: Global Market Value (USD Million) Forecast by Region, 2020-2035
  • Table 2: Global Market Volume (Metric tons) Forecast by Region, 2020-2035
  • Table 3: Global Market Value (USD Million) Forecast by Product Type, 2020-2035
  • Table 4: Global Market Volume (Metric tons) Forecast by Product Type, 2020-2035
  • Table 5: Global Market Value (USD Million) Forecast by Livestock, 2020-2035
  • Table 6: Global Market Volume (Metric tons) Forecast by Livestock, 2020-2035
  • Table 7: Global Market Value (USD Million) Forecast by Function, 2020-2035
  • Table 8: Global Market Volume (Metric tons) Forecast by Function, 2020-2035
  • Table 9: North America Market Value (USD Million) Forecast by Country, 2020-2035
  • Table 10: North America Market Volume (Metric tons) Forecast by Country, 2020-2035
  • Table 11: North America Market Value (USD Million) Forecast by Product Type, 2020-2035
  • Table 12: North America Market Volume (Metric tons) Forecast by Product Type, 2020-2035
  • Table 13: North America Market Value (USD Million) Forecast by Livestock, 2020-2035
  • Table 14: North America Market Volume (Metric tons) Forecast by Livestock, 2020-2035
  • Table 15: North America Market Value (USD Million) Forecast by Function, 2020-2035
  • Table 16: North America Market Volume (Metric tons) Forecast by Function, 2020-2035
  • Table 17: Latin America Market Value (USD Million) Forecast by Country, 2020-2035
  • Table 18: Latin America Market Volume (Metric tons) Forecast by Country, 2020-2035
  • Table 19: Latin America Market Value (USD Million) Forecast by Product Type, 2020-2035
  • Table 20: Latin America Market Volume (Metric tons) Forecast by Product Type, 2020-2035
  • Table 21: Latin America Market Value (USD Million) Forecast by Livestock, 2020-2035
  • Table 22: Latin America Market Volume (Metric tons) Forecast by Livestock, 2020-2035
  • Table 23: Latin America Market Value (USD Million) Forecast by Function, 2020-2035
  • Table 24: Latin America Market Volume (Metric tons) Forecast by Function, 2020-2035
  • Table 25: Western Europe Market Value (USD Million) Forecast by Country, 2020-2035
  • Table 26: Western Europe Market Volume (Metric tons) Forecast by Country, 2020-2035
  • Table 27: Western Europe Market Value (USD Million) Forecast by Product Type, 2020-2035
  • Table 28: Western Europe Market Volume (Metric tons) Forecast by Product Type, 2020-2035
  • Table 29: Western Europe Market Value (USD Million) Forecast by Livestock, 2020-2035
  • Table 30: Western Europe Market Volume (Metric tons) Forecast by Livestock, 2020-2035
  • Table 31: Western Europe Market Value (USD Million) Forecast by Function, 2020-2035
  • Table 32: Western Europe Market Volume (Metric tons) Forecast by Function, 2020-2035
  • Table 33: Eastern Europe Market Value (USD Million) Forecast by Country, 2020-2035
  • Table 34: Eastern Europe Market Volume (Metric tons) Forecast by Country, 2020-2035
  • Table 35: Eastern Europe Market Value (USD Million) Forecast by Product Type, 2020-2035
  • Table 36: Eastern Europe Market Volume (Metric tons) Forecast by Product Type, 2020-2035
  • Table 37: Eastern Europe Market Value (USD Million) Forecast by Livestock, 2020-2035
  • Table 38: Eastern Europe Market Volume (Metric tons) Forecast by Livestock, 2020-2035
  • Table 39: Eastern Europe Market Value (USD Million) Forecast by Function, 2020-2035
  • Table 40: Eastern Europe Market Volume (Metric tons) Forecast by Function, 2020-2035
  • Table 41: East Asia Market Value (USD Million) Forecast by Country, 2020-2035
  • Table 42: East Asia Market Volume (Metric tons) Forecast by Country, 2020-2035
  • Table 43: East Asia Market Value (USD Million) Forecast by Product Type, 2020-2035
  • Table 44: East Asia Market Volume (Metric tons) Forecast by Product Type, 2020-2035
  • Table 45: East Asia Market Value (USD Million) Forecast by Livestock, 2020-2035
  • Table 46: East Asia Market Volume (Metric tons) Forecast by Livestock, 2020-2035
  • Table 47: East Asia Market Value (USD Million) Forecast by Function, 2020-2035
  • Table 48: East Asia Market Volume (Metric tons) Forecast by Function, 2020-2035
  • Table 49: South Asia & Pacific Market Value (USD Million) Forecast by Country, 2020-2035
  • Table 50: South Asia & Pacific Market Volume (Metric tons) Forecast by Country, 2020-2035
  • Table 51: South Asia & Pacific Market Value (USD Million) Forecast by Product Type, 2020-2035
  • Table 52: South Asia & Pacific Market Volume (Metric tons) Forecast by Product Type, 2020-2035
  • Table 53: South Asia & Pacific Market Value (USD Million) Forecast by Livestock, 2020-2035
  • Table 54: South Asia & Pacific Market Volume (Metric tons) Forecast by Livestock, 2020-2035
  • Table 55: South Asia & Pacific Market Value (USD Million) Forecast by Function, 2020-2035
  • Table 56: South Asia & Pacific Market Volume (Metric tons) Forecast by Function, 2020-2035
  • Table 57: Middle East and Africa Market Value (USD Million) Forecast by Country, 2020-2035
  • Table 58: Middle East and Africa Market Volume (Metric tons) Forecast by Country, 2020-2035
  • Table 59: Middle East and Africa Market Value (USD Million) Forecast by Product Type, 2020-2035
  • Table 60: Middle East and Africa Market Volume (Metric tons) Forecast by Product Type, 2020-2035
  • Table 61: Middle East and Africa Market Value (USD Million) Forecast by Livestock, 2020-2035
  • Table 62: Middle East and Africa Market Volume (Metric tons) Forecast by Livestock, 2020-2035
  • Table 63: Middle East and Africa Market Value (USD Million) Forecast by Function, 2020-2035
  • Table 64: Middle East and Africa Market Volume (Metric tons) Forecast by Function, 2020-2035

List of Figures

  • Figure 1: Global Market Volume (Metric tons) Forecast 2020-2035
  • Figure 2: Global Market Pricing Analysis
  • Figure 3: Global Market Value (USD Million) Forecast 2020-2035
  • Figure 4: Global Market Value Share and BPS Analysis by Product Type, 2025 and 2035
  • Figure 5: Global Market Y-o-Y Growth Comparison by Product Type, 2025-2035
  • Figure 6: Global Market Attractiveness Analysis by Product Type
  • Figure 7: Global Market Value Share and BPS Analysis by Livestock, 2025 and 2035
  • Figure 8: Global Market Y-o-Y Growth Comparison by Livestock, 2025-2035
  • Figure 9: Global Market Attractiveness Analysis by Livestock
  • Figure 10: Global Market Value Share and BPS Analysis by Function, 2025 and 2035
  • Figure 11: Global Market Y-o-Y Growth Comparison by Function, 2025-2035
  • Figure 12: Global Market Attractiveness Analysis by Function
  • Figure 13: Global Market Value (USD Million) Share and BPS Analysis by Region, 2025 and 2035
  • Figure 14: Global Market Y-o-Y Growth Comparison by Region, 2025-2035
  • Figure 15: Global Market Attractiveness Analysis by Region
  • Figure 16: North America Market Incremental $ Opportunity, 2025-2035
  • Figure 17: Latin America Market Incremental $ Opportunity, 2025-2035
  • Figure 18: Western Europe Market Incremental $ Opportunity, 2025-2035
  • Figure 19: Eastern Europe Market Incremental $ Opportunity, 2025-2035
  • Figure 20: East Asia Market Incremental $ Opportunity, 2025-2035
  • Figure 21: South Asia & Pacific Market Incremental $ Opportunity, 2025-2035
  • Figure 22: Middle East and Africa Market Incremental $ Opportunity, 2025-2035
  • Figure 23: North America Market Value Share and BPS Analysis by Country, 2025 and 2035
  • Figure 24: North America Market Value Share and BPS Analysis by Product Type, 2025 and 2035
  • Figure 25: North America Market Y-o-Y Growth Comparison by Product Type, 2025-2035
  • Figure 26: North America Market Attractiveness Analysis by Product Type
  • Figure 27: North America Market Value Share and BPS Analysis by Livestock, 2025 and 2035
  • Figure 28: North America Market Y-o-Y Growth Comparison by Livestock, 2025-2035
  • Figure 29: North America Market Attractiveness Analysis by Livestock
  • Figure 30: North America Market Value Share and BPS Analysis by Function, 2025 and 2035
  • Figure 31: North America Market Y-o-Y Growth Comparison by Function, 2025-2035
  • Figure 32: North America Market Attractiveness Analysis by Function
  • Figure 33: Latin America Market Value Share and BPS Analysis by Country, 2025 and 2035
  • Figure 34: Latin America Market Value Share and BPS Analysis by Product Type, 2025 and 2035
  • Figure 35: Latin America Market Y-o-Y Growth Comparison by Product Type, 2025-2035
  • Figure 36: Latin America Market Attractiveness Analysis by Product Type
  • Figure 37: Latin America Market Value Share and BPS Analysis by Livestock, 2025 and 2035
  • Figure 38: Latin America Market Y-o-Y Growth Comparison by Livestock, 2025-2035
  • Figure 39: Latin America Market Attractiveness Analysis by Livestock
  • Figure 40: Latin America Market Value Share and BPS Analysis by Function, 2025 and 2035
  • Figure 41: Latin America Market Y-o-Y Growth Comparison by Function, 2025-2035
  • Figure 42: Latin America Market Attractiveness Analysis by Function
  • Figure 43: Western Europe Market Value Share and BPS Analysis by Country, 2025 and 2035
  • Figure 44: Western Europe Market Value Share and BPS Analysis by Product Type, 2025 and 2035
  • Figure 45: Western Europe Market Y-o-Y Growth Comparison by Product Type, 2025-2035
  • Figure 46: Western Europe Market Attractiveness Analysis by Product Type
  • Figure 47: Western Europe Market Value Share and BPS Analysis by Livestock, 2025 and 2035
  • Figure 48: Western Europe Market Y-o-Y Growth Comparison by Livestock, 2025-2035
  • Figure 49: Western Europe Market Attractiveness Analysis by Livestock
  • Figure 50: Western Europe Market Value Share and BPS Analysis by Function, 2025 and 2035
  • Figure 51: Western Europe Market Y-o-Y Growth Comparison by Function, 2025-2035
  • Figure 52: Western Europe Market Attractiveness Analysis by Function
  • Figure 53: Eastern Europe Market Value Share and BPS Analysis by Country, 2025 and 2035
  • Figure 54: Eastern Europe Market Value Share and BPS Analysis by Product Type, 2025 and 2035
  • Figure 55: Eastern Europe Market Y-o-Y Growth Comparison by Product Type, 2025-2035
  • Figure 56: Eastern Europe Market Attractiveness Analysis by Product Type
  • Figure 57: Eastern Europe Market Value Share and BPS Analysis by Livestock, 2025 and 2035
  • Figure 58: Eastern Europe Market Y-o-Y Growth Comparison by Livestock, 2025-2035
  • Figure 59: Eastern Europe Market Attractiveness Analysis by Livestock
  • Figure 60: Eastern Europe Market Value Share and BPS Analysis by Function, 2025 and 2035
  • Figure 61: Eastern Europe Market Y-o-Y Growth Comparison by Function, 2025-2035
  • Figure 62: Eastern Europe Market Attractiveness Analysis by Function
  • Figure 63: East Asia Market Value Share and BPS Analysis by Country, 2025 and 2035
  • Figure 64: East Asia Market Value Share and BPS Analysis by Product Type, 2025 and 2035
  • Figure 65: East Asia Market Y-o-Y Growth Comparison by Product Type, 2025-2035
  • Figure 66: East Asia Market Attractiveness Analysis by Product Type
  • Figure 67: East Asia Market Value Share and BPS Analysis by Livestock, 2025 and 2035
  • Figure 68: East Asia Market Y-o-Y Growth Comparison by Livestock, 2025-2035
  • Figure 69: East Asia Market Attractiveness Analysis by Livestock
  • Figure 70: East Asia Market Value Share and BPS Analysis by Function, 2025 and 2035
  • Figure 71: East Asia Market Y-o-Y Growth Comparison by Function, 2025-2035
  • Figure 72: East Asia Market Attractiveness Analysis by Function
  • Figure 73: South Asia & Pacific Market Value Share and BPS Analysis by Country, 2025 and 2035
  • Figure 74: South Asia & Pacific Market Value Share and BPS Analysis by Product Type, 2025 and 2035
  • Figure 75: South Asia & Pacific Market Y-o-Y Growth Comparison by Product Type, 2025-2035
  • Figure 76: South Asia & Pacific Market Attractiveness Analysis by Product Type
  • Figure 77: South Asia & Pacific Market Value Share and BPS Analysis by Livestock, 2025 and 2035
  • Figure 78: South Asia & Pacific Market Y-o-Y Growth Comparison by Livestock, 2025-2035
  • Figure 79: South Asia & Pacific Market Attractiveness Analysis by Livestock
  • Figure 80: South Asia & Pacific Market Value Share and BPS Analysis by Function, 2025 and 2035
  • Figure 81: South Asia & Pacific Market Y-o-Y Growth Comparison by Function, 2025-2035
  • Figure 82: South Asia & Pacific Market Attractiveness Analysis by Function
  • Figure 83: Middle East and Africa Market Value Share and BPS Analysis by Country, 2025 and 2035
  • Figure 84: Middle East and Africa Market Value Share and BPS Analysis by Product Type, 2025 and 2035
  • Figure 85: Middle East and Africa Market Y-o-Y Growth Comparison by Product Type, 2025-2035
  • Figure 86: Middle East and Africa Market Attractiveness Analysis by Product Type
  • Figure 87: Middle East and Africa Market Value Share and BPS Analysis by Livestock, 2025 and 2035
  • Figure 88: Middle East and Africa Market Y-o-Y Growth Comparison by Livestock, 2025-2035
  • Figure 89: Middle East and Africa Market Attractiveness Analysis by Livestock
  • Figure 90: Middle East and Africa Market Value Share and BPS Analysis by Function, 2025 and 2035
  • Figure 91: Middle East and Africa Market Y-o-Y Growth Comparison by Function, 2025-2035
  • Figure 92: Middle East and Africa Market Attractiveness Analysis by Function
  • Figure 93: Global Market - Tier Structure Analysis
  • Figure 94: Global Market - Company Share Analysis

Frequently Asked Questions

What is the estimated market size of the feed phytogenic industry in 2025?

The industry is valued at USD 838.02 million in 2025.

What is the projected industry size of the feed phytogenic industry by 2035?

It is forecasted to reach USD 2,193.4 million by 2035.

What is the expected CAGR for the feed phytogenic industry between 2025 and 2035?

The industry is anticipated to grow at a CAGR of 10.1% during this period.

Which segment is expected to lead the feed phytogenic market in 2025?

Performance enhancers are projected to lead the market with a 62.3% share in 2025.

Which region is expected to witness the highest growth in the feed phytogenic market?

North America, particularly the United States, is expected to be the key growth region with a projected growth rate of 6.1%.

Explore Similar Insights

Future Market Insights

Feed Phytogenic Market