Feed Premix Market Size and Share Forecast Outlook 2025 to 2035

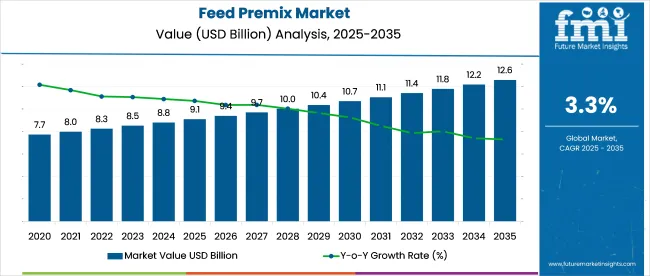
The global feed premix market is estimated to reach a valuation of USD 9.1 billion in 2025 and is anticipated to grow to USD 12.5 billion by 2035. This market is expected to grow at a CAGR of 3.3% over the forecast period. Between 2020 and 2025, the market expanded at a CAGR of 3.1%, indicating a gradual but consistent upward trend that is expected to continue.
Quick Stats of Feed Premix Market

  • Market Value (2025): USD 9.1 billion
  • Forecast Value (2035): USD 12.5 billion
  • Forecast CAGR (2025 to 2035): 3.3%
  • Leading Segment in 2025: Powder (80% share)
  • Key Growth Region: Asia Pacific (India is the fastest growing market with 3.4% CAGR)
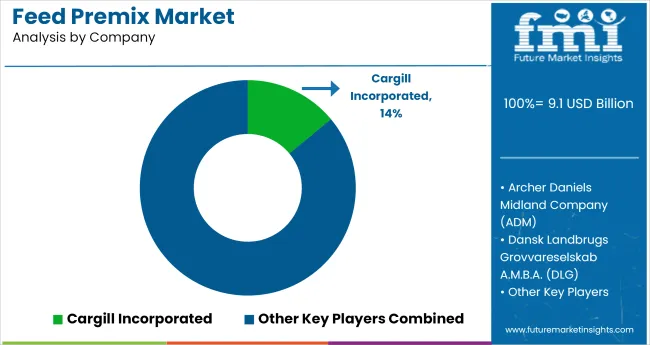
  • Key Players: Cargill Incorporated, Archer Daniels Midland Company (ADM), Dansk Landbrugs Grovvareselskab A.M.B.A. (DLG), BASF SE, Land O'Lakes, Inc., Godrej Agrovet, Koninklijke DSM N.V., Corbion N.V., Farbest-Tallman Foods Corporation, and Glanbia plc.

Feed Premix Market

Attribute Values
Estimated Industry Size (2025E) USD 9.1 billion
Projected Industry Value (2035F) USD 12.5 billion
CAGR (2025 to 2035) 3.3%

This growth trajectory underscores the market’s resilience and responsiveness to evolving agricultural and livestock management practices. With increased attention on food safety, animal health, and productivity, feed premixes have become a vital component in commercial livestock operations worldwide.

The industry registers 10-15% of the global animal feed market, which itself is valued at over USD 100 billion. Within the animal nutrition market, feed premixes represent around 20%, given their critical role in micronutrient delivery. In the broader agriculture inputs market, including fertilizers, crop protection, and animal inputs, feed premixes contribute a modest 5-7% share.

When considering the livestock farming market, which encompasses breeding, equipment, and feed, premixes represent around 8-10%, largely driven by intensive production systems. Within the food and beverage supply chain, feed premix accounts for less than 3%, due to its upstream role in animal production. These figures underscore the role of premixes as a niche yet essential component across interlinked value chains.

The broader structural shifts in agriculture, especially the rise of vertically integrated farming models, are reinforcing this demand for performance-driven feed solutions. Technological advancements in feed formulation, biotechnology, and data-enabled nutrition planning have allowed producers to optimize feed conversion ratios, reduce environmental impact, and align with sustainability targets.

As livestock operations consolidate and become more sophisticated, the value proposition of premixes grows, offering not just nutritional benefits but also cost efficiencies, environmental compliance, and long-term productivity gains. This strategic evolution positions premixes as a critical lever in the transformation of global animal protein supply chains.

Analysis of Feed Premix Market by Top Investment Segments 

Powder form dominates the market due to its superior handling, stability, and efficient nutrient delivery, making it ideal for consistent and scalable livestock feeding. Antibiotics lead the product segment, valued for their effectiveness in enhancing animal growth, preventing diseases, and supporting productivity in high-density farming, despite increasing regulatory oversight.
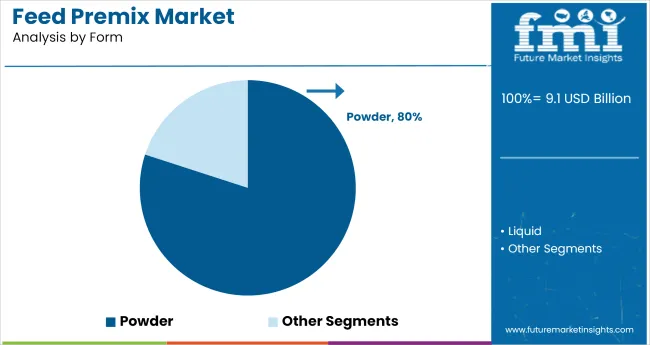
Powder Dominant Form Segment with 80% Share

Feed Premix Market By Form

The powder form is the leading segment in the market, accounting for 80% of the market share in 2025, primarily due to its superior handling, stability, and cost-effectiveness.
  • Powdered premixes offer exceptional uniformity, which ensures consistent nutrient distribution across feed batches, critical for maintaining animal health and performance.
  • Liquid forms, powders are less prone to contamination, require minimal preservation additives, and are more adaptable across diverse climatic conditions.
  • Advances in micro encapsulation and particle size optimization have further improved the nutrient delivery efficiency of powdered formulations, reinforcing their dominance in this segment.

Antibiotics in Command, Driving Animal Health and Performance

Feed Premix Market By Product

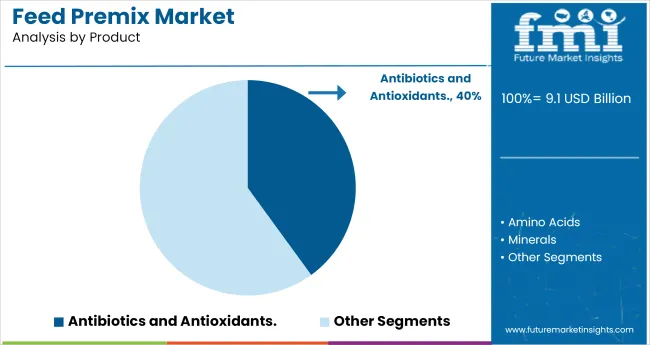
The antibiotics segment leads the market with a substantial 40% market share in 2025, driven by its proven role in enhancing feed efficiency, supporting animal growth, and preventing disease outbreaks.

  • In high-density farming systems, antibiotics are widely incorporated into premixes to ensure consistent health outcomes, reduce mortality, and optimize production cycles.
  • Despite rising regulatory scrutiny, the use of antibiotics remains indispensable in many regions where bio security infrastructure is limited.
  • Tailored formulations using targeted classes such as tetracyclines, macrolides, and penicillins help maintain efficacy while aligning with evolving guidelines.

Top Feed Premix Market Dynamics

Feed premix producers are adopting precision nutrient formulations to reduce additive waste and align with species-specific needs, improving inventory turnover and feed efficiency. Simultaneously, rising demand for antibiotic-free solutions is driving regulatory-compliant, dual-track formulations with a focus on traceable, audit-ready ingredients.

Nutrient Optimization Reshaping Feed Premix Formulations

Feed premix buyers are strategically streamlining nutrient profiles to meet animal-specific requirements while minimizing excess micronutrient usage. Across Latin America and Southeast Asia, producers have shifted from broad-spectrum formulations to precision inclusion of trace minerals and vitamins.

This shift is driven by fluctuating raw material costs and updated species-specific feeding guidelines that encourage more accurate dosing. As a result, feed converters report up to 9% less wastage of key additives. Contract manufacturers are adjusting batch sizes based on seasonally adjusted formulations, improving inventory turnover by 13%. This recalibration also aligns feed schedules with life cycle-driven nutrient needs, enhancing both feed conversion ratios and animal welfare outcomes.

  • Reformulation strategies minimize additive overuse
  • Batch sizes adjusted to reflect seasonal livestock cycles
  • Up to 9% additive wastage reduction reported by regional converters

Shifts in Antimicrobial Usage Driving Formulation Compliance

Changing regulatory and retail stances on antimicrobial use are transforming product design in the market. Following the enforcement of non-medicated feed mandates in regions like the EU and Australia, premix producers are phasing out growth-promoting antibiotic blends and adopting immune-supportive botanicals and acidifiers.

Distributors report that 31% of poultry premix contracts in Europe now require antibiotic-free labeling, reshaping demand across the supply chain. Compliance pressures have also altered procurement strategies, with buyers prioritizing ingredient traceability and supplier audit transparency. These shifts are fostering a dual-track portfolio strategy: one targeting conventional systems, another for export-aligned antibiotic-free operations.
  • Antibiotic-free demand driving dual formulation strategies
  • Labeling mandates influencing regional contract terms
  • Procurement pivoting toward traceable, audit-ready ingredients

Top Countries Manufacturing, Regulating, and Scaling Feed Premix Demand

Country Wise Analysis Of Feed Premix Market

The report covers a detailed analysis of 40+ countries, and the top five countries have been shared as a reference.

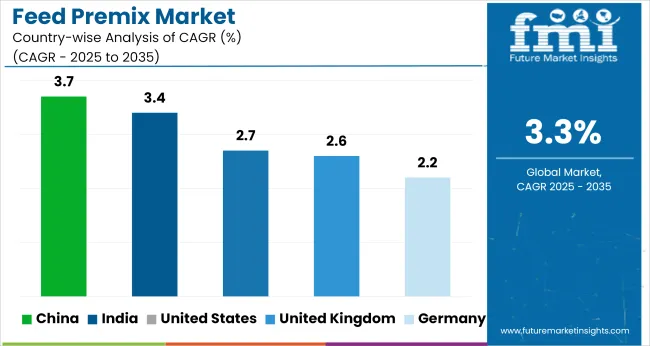
Countries CAGR (2025 to 2035)
United States 2.7%
United Kingdom 2.6%
Germany 2.2%
China 3.7%
India 3.4%

The global feed premix market is forecast to grow at a CAGR of 3.3% between 2025 and 2035, with regional growth diverging across economic blocs. India, a BRICS member, leads with a projected 4.7% CAGR, supported by its expanding poultry and dairy sectors and the rising use of micronutrient blends to correct regional mineral deficiencies. Local producers are investing in compound premix plants near consumption zones to reduce freight costs and customize formulations by species.

China posts a 4.3% CAGR, with demand concentrated in integrated pig and aquaculture systems that rely on tailored vitamin and amino acid premixes to boost feed efficiency. ASEAN countries like Vietnam and the Philippines average 3.8%, driven by livestock consolidation and health-related feed regulations. OECD countries such as Germany and Canada report lower growth, 2.6% and 2.4% respectively, due to saturated livestock volumes and stricter controls on additive inclusion, reflecting a more mature stage of market evolution.

United States Feed Premix Industry Expansion

The USA feed premix market is estimated to grow at a 2.7% CAGR during the forecast period from 2025 to 2035. The market in the USA is largely driven by the intensification of commercial livestock operations, particularly in the poultry and swine sectors, where nutritional precision and performance efficiency are paramount.

A well-established animal protein industry, combined with ongoing reforms in feed safety and quality assurance, has encouraged the adoption of value-added premixes. USA producers are increasingly integrating product formulations into vertically coordinated supply chains to maintain consistency and traceability across large-scale operations. The growing consumer demand for antibiotic-free and premium meat is further pushing feed manufacturers to explore alternative functional additives within premixes.

  • Strong poultry and swine sectors demand precise nutrition strategies
  • Growing retail and consumer push for antibiotic-free meat
  • Integration of traceable premix solutions within advanced supply chains

Regulatory-Driven Expansion of Feed Premix Market in Germany

Germany’s feed premix market is projected to expand at a 2.2% CAGR between 2025 and 2035. As one of the EU's most regulated markets for livestock feed, Germany’s industry is shaped by stringent compliance norms, particularly around antimicrobial usage, animal welfare, and sourcing.

German livestock producers, especially in swine and dairy sectors, are increasingly turning to customized premix solutions that align with Green Deal-aligned environmental goals and animal health optimization. With a strong emphasis on traceability and ingredient transparency, feed manufacturers are reformulating products to meet the evolving retail certification standards. The rise of organic and specialty livestock farming has created niche opportunities for tailored, antibiotic-free, and mineral-balanced premixes.

  • Regulatory reforms encourage tailored, compliant formulations
  • Demand from organic and animal welfare-certified farms
  • Growth of the dairy sector is reliant on life cycle-specific nutrient premixes

Demand Forecast for Feed Premix Market in China

China’s feed premix market is set to register a 3.7% CAGR from 2025 to 2035, emerging as one of the fastest-growing markets globally. Following the restructuring of its swine industry post-ASF (African Swine Fever) outbreaks, China has modernized its livestock production facilities, leading to increased demand for premixes that enhance bio security, immunity, and performance.

Urbanization and rising incomes are shifting consumer preferences toward high-quality animal protein, encouraging producers to adopt advanced feeding systems. Government policies supporting feed safety, domestic production quality, and vertical integration across supply chains have further boosted the market. With consolidation across the livestock sector, large farms are increasingly adopting premix-based feeding strategies that allow nutrient customization, automation, and efficiency gains.

  • Modernization of the swine industry post-ASF drives feed
  • Growing preference for safe, traceable, high-quality animal protein
  • Government-backed upgrades to feed safety and efficiency standards

Feed Premix Market Growth Outlook in India

India’s feed premix market is expected to grow at a 3.4% CAGR between 2025 and 2035, slightly above the global average. The expansion is underpinned by the rapid development of the poultry and dairy industries, which are seeing a shift from backyard farming to organized production. Rising protein consumption in urban and semi-urban areas has led to greater demand for quality animal products, prompting producers to adopt nutritionally balanced premixes.

India’s fragmented but expanding feed industry is increasingly embracing premixes as a cost-effective method to address deficiencies in local feed raw materials. Government-led efforts under programs like the National Livestock Mission are incentivizing the use of fortified feed to improve productivity in indigenous breeds and reduce disease incidence.

  • Poultry and dairy sector modernization fueling premix uptake
  • Fortified premixes addressing gaps in traditional feed formulations
  • Government support is accelerating feed quality improvements in rural areas

Future Outlook for Feed Premix Market in the United Kingdom

The UK feed premix market is forecast to expand at a 2.6% CAGR from 2025 to 2035, driven by a focus on animal health standards, premium meat production, and post-Brexit supply chain realignments. In the wake of stricter veterinary medicine regulations and growing consumer interest in welfare-certified and antibiotic-free meat, British producers are reformulating feed strategies with targeted premix solutions.

The UK also sees growing demand for value-added livestock products in export markets, especially under private labeling and welfare-based branding. These dynamics are encouraging feed companies to deliver traceable, high-quality premix inputs that meet both domestic and EU-equivalent standards. The country’s expanding aquaculture and specialty animal sectors are contributing to new, formulation-specific premix needs.
  • Stricter antibiotic regulations are reshaping livestock feed strategies
  • Export-oriented producers adopting traceable, high-spec premix blends
  • Growth in aquaculture and niche livestock is creating new product demand

Leading Feed Premix Suppliers

Feed Premix Market By Company

The industry is shaped by global agribusiness leaders and regional specialists focused on advanced nutrition, traceability, and animal health. Key players such as Cargill Incorporated, Archer Daniels Midland Company (ADM), and BASF SE lead the market with integrated supply chains and research-backed formulations.

Koninklijke DSM N.V. and Corbion N.V. drive in micronutrient precision and bio-based additives. Land O'Lakes, Inc. and Glanbia plc support growth through co-operative models and tailored livestock solutions. Regional firms like Godrej Agrovet in India and Farbest-Tallman Foods Corporation in the USA meet localized demand with species-specific blends. DLG (Dansk Landbrugs Grovvareselskab A.M.B.A.) strengthens European presence through feed strategies.

Recent Feed Premix Industry News

  • In September 2024, Cargill announced the acquisition of two feed mills in the United States,one in Denver, Colorado, and another in Kansas City, Kansas, from Compana Pet Brands.

Leading Players

  • Cargill Incorporated
  • Archer Daniels Midland Company (ADM)
  • Dansk Landbrugs Grovvareselskab A.M.B.A. (DLG)
  • BASF SE
  • Land O'Lakes, Inc.
  • Godrej Agrovet
  • Koninklijke DSM N.V.
  • Corbion N.V.
  • Farbest-Tallman Foods Corporation
  • Glanbia plc

Report Coverage and Scope Summary

Report Attributes Details
Market Size (2025) USD 9.1 billion
Projected Market Size (2035) USD 12.5 billion
CAGR (2025 to 2035) 3.3%
Base Year for Estimation 2024
Historical Period 2020 to 2024
Projections Period 2025 to 2035
Quantitative Units USD billion for value and volume in metric tons
Form Analyzed (Segment 1) Powder and Liquid.
Product Analyzed (Segment 2) Amino Acids, Vitamins, Minerals, Antibiotics, And Antioxidants.
Regions Covered North America, Europe, Asia Pacific, Middle East & Africa, Latin America
Countries Covered United States, Canada, Germany, United Kingdom, France, Italy, Spain, China, Japan, South Korea, India, Australia, Brazil, Mexico, Argentina, Saudi Arabia, UAE, South Africa
Key Players Cargill Incorporated, Archer Daniels Midland Company (ADM), Dansk Landbrugs Grovvareselskab A.M.B.A. (DLG), BASF SE, Land O'Lakes, Inc., Godrej Agrovet, Koninklijke DSM N.V., Corbion N.V., Farbest -Tallman Foods Corporation, and Glanbia plc.
Additional Attributes D ollar sales, share, growth rate by form and product type, regional demand shifts, regulatory trends, top buyer segments, distribution channel performance, and competitor positioning.

Key Segments

By Form:

The industry is segmented into powder and liquid.

By Product:

The industry is segmented into amino acids, vitamins, minerals, antibiotics, and antioxidants.

By Region:

The industry covers regions including North America, Europe, Asia Pacific, Latin America, and the Middle East & Africa.

Table of Content

  1. Executive Summary
    • Global Market Outlook
    • Demand-side Trends
    • Supply-side Trends
    • Technology Roadmap Analysis
    • Analysis and Recommendations
  2. Market Overview
    • Market Coverage/Taxonomy
    • Market Definition/Scope/Limitations
  3. Market Background
    • Market Dynamics
      • Drivers
      • Restraints
      • Opportunity
      • Trends
    • Scenario Forecast
      • Demand in Optimistic Scenario
      • Demand in Likely Scenario
      • Demand in Conservative Scenario
    • Opportunity Map Analysis
    • Product Life Cycle Analysis
    • Supply Chain Analysis
      • Supply Side Participants and their Roles
        • Producers
        • Mid-Level Participants (Traders/ Agents/ Brokers)
        • Wholesalers and Distributors
      • Value Added and Value Created at Node in the Supply Chain
      • List of Raw Material Suppliers
      • List of Existing and Potential Buyer’s
    • Investment Feasibility Matrix
    • Value Chain Analysis
      • Profit Margin Analysis
      • Wholesalers and Distributors
      • Retailers
    • PESTLE and Porter’s Analysis
    • Regulatory Landscape
      • By Key Regions
      • By Key Countries
    • Regional Parent Market Outlook
    • Production and Consumption Statistics
    • Import and Export Statistics
  4. Global Market Analysis 2020 to 2024 and Forecast, 2025 to 2035
    • Historical Market Size Value (USD Billion) & Volume (Metric tons) Analysis, 2020 to 2024
    • Current and Future Market Size Value (USD Billion) & Volume (Metric tons) Projections, 2025 to 2035
      • Y-o-Y Growth Trend Analysis
      • Absolute $ Opportunity Analysis
  5. Global Market Pricing Analysis 2020 to 2024 and Forecast 2025 to 2035
  6. Global Market Analysis 2020 to 2024 and Forecast 2025 to 2035, By Form
    • Introduction/Key Findings
    • Historical Market Size Value (USD Billion) & Volume (Metric tons) Analysis By Form, 2020 to 2024
    • Current and Future Market Size Value (USD Billion) & Volume (Metric tons) Analysis and Forecast By Form, 2025 to 2035
      • Powder
      • Liquid
    • Y-o-Y Growth Trend Analysis By Form, 2020 to 2024
    • Absolute $ Opportunity Analysis By Form, 2025 to 2035
  7. Global Market Analysis 2020 to 2024 and Forecast 2025 to 2035, By Product
    • Introduction/Key Findings
    • Historical Market Size Value (USD Billion) & Volume (Metric tons) Analysis By Product, 2020 to 2024
    • Current and Future Market Size Value (USD Billion) & Volume (Metric tons) Analysis and Forecast By Product, 2025 to 2035
      • Amino acids
      • Vitamins
      • Minerals
      • Antibiotics and Antioxidants
    • Y-o-Y Growth Trend Analysis By Product, 2020 to 2024
    • Absolute $ Opportunity Analysis By Product, 2025 to 2035
  8. Global Market Analysis 2020 to 2024 and Forecast 2025 to 2035, By Region
    • Introduction
    • Historical Market Size Value (USD Billion) & Volume (Metric tons) Analysis By Region, 2020 to 2024
    • Current Market Size Value (USD Billion) & Volume (Metric tons) Analysis and Forecast By Region, 2025 to 2035
      • North America
      • Latin America
      • Western Europe
      • Eastern Europe
      • East Asia
      • South Asia & Pacific
      • Middle East and Africa
    • Market Attractiveness Analysis By Region
  9. North America Market Analysis 2020 to 2024 and Forecast 2025 to 2035, By Country
    • Historical Market Size Value (USD Billion) & Volume (Metric tons) Trend Analysis By Market Taxonomy, 2020 to 2024
    • Market Size Value (USD Billion) & Volume (Metric tons) Forecast By Market Taxonomy, 2025 to 2035
      • By Country
        • USA
        • Canada
        • Mexico
      • By Form
      • By Product
    • Market Attractiveness Analysis
      • By Country
      • By Form
      • By Product
    • Key Takeaways
  10. Latin America Market Analysis 2020 to 2024 and Forecast 2025 to 2035, By Country
    • Historical Market Size Value (USD Billion) & Volume (Metric tons) Trend Analysis By Market Taxonomy, 2020 to 2024
    • Market Size Value (USD Billion) & Volume (Metric tons) Forecast By Market Taxonomy, 2025 to 2035
      • By Country
        • Brazil
        • Argentina
        • Rest of LATAM
      • By Form
      • By Product
    • Market Attractiveness Analysis
      • By Country
      • By Form
      • By Product
    • Key Takeaways
  11. Western Europe Market Analysis 2020 to 2024 and Forecast 2025 to 2035, By Country
    • Historical Market Size Value (USD Billion) & Volume (Metric tons) Trend Analysis By Market Taxonomy, 2020 to 2024
    • Market Size Value (USD Billion) & Volume (Metric tons) Forecast By Market Taxonomy, 2025 to 2035
      • By Country
        • Germany
        • Italy
        • France
        • UK
        • Spain
        • BENELUX
        • Nordic
        • Rest of W.Europe
      • By Form
      • By Product
    • Market Attractiveness Analysis
      • By Country
      • By Form
      • By Product
    • Key Takeaways
  12. Eastern Europe Market Analysis 2020 to 2024 and Forecast 2025 to 2035, By Country
    • Historical Market Size Value (USD Billion) & Volume (Metric tons) Trend Analysis By Market Taxonomy, 2020 to 2024
    • Market Size Value (USD Billion) & Volume (Metric tons) Forecast By Market Taxonomy, 2025 to 2035
      • By Country
        • Russia
        • Hungary
        • Poland
        • Balkan & Baltics
        • Rest of E. Europe
      • By Form
      • By Product
    • Market Attractiveness Analysis
      • By Country
      • By Form
      • By Product
    • Key Takeaways
  13. East Asia Market Analysis 2020 to 2024 and Forecast 2025 to 2035, By Country
    • Historical Market Size Value (USD Billion) & Volume (Metric tons) Trend Analysis By Market Taxonomy, 2020 to 2024
    • Market Size Value (USD Billion) & Volume (Metric tons) Forecast By Market Taxonomy, 2025 to 2035
      • By Country
        • China
        • Japan
        • South Korea
      • By Form
      • By Product
    • Market Attractiveness Analysis
      • By Country
      • By Form
      • By Product
    • Key Takeaways
  14. South Asia & Pacific Market Analysis 2020 to 2024 and Forecast 2025 to 2035, By Country
    • Historical Market Size Value (USD Billion) & Volume (Metric tons) Trend Analysis By Market Taxonomy, 2020 to 2024
    • Market Size Value (USD Billion) & Volume (Metric tons) Forecast By Market Taxonomy, 2025 to 2035
      • By Country
        • India
        • Australia & New Zealand
        • ASEAN
        • Rest of SAP
      • By Form
      • By Product
    • Market Attractiveness Analysis
      • By Country
      • By Form
      • By Product
    • Key Takeaways
  15. Middle East and Africa Market Analysis 2020 to 2024 and Forecast 2025 to 2035, By Country
    • Historical Market Size Value (USD Billion) & Volume (Metric tons) Trend Analysis By Market Taxonomy, 2020 to 2024
    • Market Size Value (USD Billion) & Volume (Metric tons) Forecast By Market Taxonomy, 2025 to 2035
      • By Country
        • GCC Countries
        • Northern Africa
        • South Africa
        • Turkiye
        • Rest of MEA
      • By Form
      • By Product
    • Market Attractiveness Analysis
      • By Country
      • By Form
      • By Product
    • Key Takeaways
  16. Key Countries Market Analysis
    • USA
      • Pricing Analysis
      • Market Share Analysis, 2024
        • By Form
        • By Product
    • Canada
      • Pricing Analysis
      • Market Share Analysis, 2024
        • By Form
        • By Product
    • Brazil
      • Pricing Analysis
      • Market Share Analysis, 2024
        • By Form
        • By Product
    • Mexico
      • Pricing Analysis
      • Market Share Analysis, 2024
        • By Form
        • By Product
    • Argentina
      • Pricing Analysis
      • Market Share Analysis, 2024
        • By Form
        • By Product
  17. Market Structure Analysis
    • Competition Dashboard
    • Competition Benchmarking
    • Market Share Analysis of Top Players
      • By Regional
      • By Form
      • By Product
  18. Competition Analysis
    • Competition Deep Dive
      • Cargill Incorporated
        • Overview
        • Product Portfolio
        • Profitability by Market Segments (Product/Age /Sales Channel/Region)
        • Sales Footprint
        • Strategy Overview
          • Marketing Strategy
          • Product Strategy
          • Channel Strategy
      • Archer Daniels Midland Company (ADM)
        • Overview
        • Product Portfolio
        • Profitability by Market Segments (Product/Age /Sales Channel/Region)
        • Sales Footprint
        • Strategy Overview
          • Marketing Strategy
          • Product Strategy
          • Channel Strategy
      • Dansk Landbrugs Grovvareselskab A.M.B.A. (DLG)
        • Overview
        • Product Portfolio
        • Profitability by Market Segments (Product/Age /Sales Channel/Region)
        • Sales Footprint
        • Strategy Overview
          • Marketing Strategy
          • Product Strategy
          • Channel Strategy
      • BASF SE
        • Overview
        • Product Portfolio
        • Profitability by Market Segments (Product/Age /Sales Channel/Region)
        • Sales Footprint
        • Strategy Overview
          • Marketing Strategy
          • Product Strategy
          • Channel Strategy
      • Land O'Lakes, Inc.
        • Overview
        • Product Portfolio
        • Profitability by Market Segments (Product/Age /Sales Channel/Region)
        • Sales Footprint
        • Strategy Overview
          • Marketing Strategy
          • Product Strategy
          • Channel Strategy
      • Godrej Agrovet
        • Overview
        • Product Portfolio
        • Profitability by Market Segments (Product/Age /Sales Channel/Region)
        • Sales Footprint
        • Strategy Overview
          • Marketing Strategy
          • Product Strategy
          • Channel Strategy
      • Koninklijke DSM N.V.
        • Overview
        • Product Portfolio
        • Profitability by Market Segments (Product/Age /Sales Channel/Region)
        • Sales Footprint
        • Strategy Overview
          • Marketing Strategy
          • Product Strategy
          • Channel Strategy
      • Corbion N.V.
        • Overview
        • Product Portfolio
        • Profitability by Market Segments (Product/Age /Sales Channel/Region)
        • Sales Footprint
        • Strategy Overview
          • Marketing Strategy
          • Product Strategy
          • Channel Strategy
      • Farbest-Tallman Foods Corporation
        • Overview
        • Product Portfolio
        • Profitability by Market Segments (Product/Age /Sales Channel/Region)
        • Sales Footprint
        • Strategy Overview
          • Marketing Strategy
          • Product Strategy
          • Channel Strategy
      • Glanbia plc
        • Overview
        • Product Portfolio
        • Profitability by Market Segments (Product/Age /Sales Channel/Region)
        • Sales Footprint
        • Strategy Overview
          • Marketing Strategy
          • Product Strategy
          • Channel Strategy
  19. Assumptions & Acronyms Used
  20. Research Methodology

List of Tables

  • Table 1: Global Market Value (USD Billion) Forecast by Region, 2020-2035
  • Table 2: Global Market Volume (Metric tons) Forecast by Region, 2020-2035
  • Table 3: Global Market Value (USD Billion) Forecast by Form, 2020-2035
  • Table 4: Global Market Volume (Metric tons) Forecast by Form, 2020-2035
  • Table 5: Global Market Value (USD Billion) Forecast by Product, 2020-2035
  • Table 6: Global Market Volume (Metric tons) Forecast by Product, 2020-2035
  • Table 7: North America Market Value (USD Billion) Forecast by Country, 2020-2035
  • Table 8: North America Market Volume (Metric tons) Forecast by Country, 2020-2035
  • Table 9: North America Market Value (USD Billion) Forecast by Form, 2020-2035
  • Table 10: North America Market Volume (Metric tons) Forecast by Form, 2020-2035
  • Table 11: North America Market Value (USD Billion) Forecast by Product, 2020-2035
  • Table 12: North America Market Volume (Metric tons) Forecast by Product, 2020-2035
  • Table 13: Latin America Market Value (USD Billion) Forecast by Country, 2020-2035
  • Table 14: Latin America Market Volume (Metric tons) Forecast by Country, 2020-2035
  • Table 15: Latin America Market Value (USD Billion) Forecast by Form, 2020-2035
  • Table 16: Latin America Market Volume (Metric tons) Forecast by Form, 2020-2035
  • Table 17: Latin America Market Value (USD Billion) Forecast by Product, 2020-2035
  • Table 18: Latin America Market Volume (Metric tons) Forecast by Product, 2020-2035
  • Table 19: Western Europe Market Value (USD Billion) Forecast by Country, 2020-2035
  • Table 20: Western Europe Market Volume (Metric tons) Forecast by Country, 2020-2035
  • Table 21: Western Europe Market Value (USD Billion) Forecast by Form, 2020-2035
  • Table 22: Western Europe Market Volume (Metric tons) Forecast by Form, 2020-2035
  • Table 23: Western Europe Market Value (USD Billion) Forecast by Product, 2020-2035
  • Table 24: Western Europe Market Volume (Metric tons) Forecast by Product, 2020-2035
  • Table 25: Eastern Europe Market Value (USD Billion) Forecast by Country, 2020-2035
  • Table 26: Eastern Europe Market Volume (Metric tons) Forecast by Country, 2020-2035
  • Table 27: Eastern Europe Market Value (USD Billion) Forecast by Form, 2020-2035
  • Table 28: Eastern Europe Market Volume (Metric tons) Forecast by Form, 2020-2035
  • Table 29: Eastern Europe Market Value (USD Billion) Forecast by Product, 2020-2035
  • Table 30: Eastern Europe Market Volume (Metric tons) Forecast by Product, 2020-2035
  • Table 31: East Asia Market Value (USD Billion) Forecast by Country, 2020-2035
  • Table 32: East Asia Market Volume (Metric tons) Forecast by Country, 2020-2035
  • Table 33: East Asia Market Value (USD Billion) Forecast by Form, 2020-2035
  • Table 34: East Asia Market Volume (Metric tons) Forecast by Form, 2020-2035
  • Table 35: East Asia Market Value (USD Billion) Forecast by Product, 2020-2035
  • Table 36: East Asia Market Volume (Metric tons) Forecast by Product, 2020-2035
  • Table 37: South Asia & Pacific Market Value (USD Billion) Forecast by Country, 2020-2035
  • Table 38: South Asia & Pacific Market Volume (Metric tons) Forecast by Country, 2020-2035
  • Table 39: South Asia & Pacific Market Value (USD Billion) Forecast by Form, 2020-2035
  • Table 40: South Asia & Pacific Market Volume (Metric tons) Forecast by Form, 2020-2035
  • Table 41: South Asia & Pacific Market Value (USD Billion) Forecast by Product, 2020-2035
  • Table 42: South Asia & Pacific Market Volume (Metric tons) Forecast by Product, 2020-2035
  • Table 43: Middle East and Africa Market Value (USD Billion) Forecast by Country, 2020-2035
  • Table 44: Middle East and Africa Market Volume (Metric tons) Forecast by Country, 2020-2035
  • Table 45: Middle East and Africa Market Value (USD Billion) Forecast by Form, 2020-2035
  • Table 46: Middle East and Africa Market Volume (Metric tons) Forecast by Form, 2020-2035
  • Table 47: Middle East and Africa Market Value (USD Billion) Forecast by Product, 2020-2035
  • Table 48: Middle East and Africa Market Volume (Metric tons) Forecast by Product, 2020-2035

List of Figures

  • Figure 1: Global Market Volume (Metric tons) Forecast 2020-2035
  • Figure 2: Global Market Pricing Analysis
  • Figure 3: Global Market Value (USD Billion) Forecast 2020-2035
  • Figure 4: Global Market Value Share and BPS Analysis by Form, 2025 and 2035
  • Figure 5: Global Market Y-o-Y Growth Comparison by Form, 2025-2035
  • Figure 6: Global Market Attractiveness Analysis by Form
  • Figure 7: Global Market Value Share and BPS Analysis by Product, 2025 and 2035
  • Figure 8: Global Market Y-o-Y Growth Comparison by Product, 2025-2035
  • Figure 9: Global Market Attractiveness Analysis by Product
  • Figure 10: Global Market Value (USD Billion) Share and BPS Analysis by Region, 2025 and 2035
  • Figure 11: Global Market Y-o-Y Growth Comparison by Region, 2025-2035
  • Figure 12: Global Market Attractiveness Analysis by Region
  • Figure 13: North America Market Incremental $ Opportunity, 2025-2035
  • Figure 14: Latin America Market Incremental $ Opportunity, 2025-2035
  • Figure 15: Western Europe Market Incremental $ Opportunity, 2025-2035
  • Figure 16: Eastern Europe Market Incremental $ Opportunity, 2025-2035
  • Figure 17: East Asia Market Incremental $ Opportunity, 2025-2035
  • Figure 18: South Asia & Pacific Market Incremental $ Opportunity, 2025-2035
  • Figure 19: Middle East and Africa Market Incremental $ Opportunity, 2025-2035
  • Figure 20: North America Market Value Share and BPS Analysis by Country, 2025 and 2035
  • Figure 21: North America Market Value Share and BPS Analysis by Form, 2025 and 2035
  • Figure 22: North America Market Y-o-Y Growth Comparison by Form, 2025-2035
  • Figure 23: North America Market Attractiveness Analysis by Form
  • Figure 24: North America Market Value Share and BPS Analysis by Product, 2025 and 2035
  • Figure 25: North America Market Y-o-Y Growth Comparison by Product, 2025-2035
  • Figure 26: North America Market Attractiveness Analysis by Product
  • Figure 27: Latin America Market Value Share and BPS Analysis by Country, 2025 and 2035
  • Figure 28: Latin America Market Value Share and BPS Analysis by Form, 2025 and 2035
  • Figure 29: Latin America Market Y-o-Y Growth Comparison by Form, 2025-2035
  • Figure 30: Latin America Market Attractiveness Analysis by Form
  • Figure 31: Latin America Market Value Share and BPS Analysis by Product, 2025 and 2035
  • Figure 32: Latin America Market Y-o-Y Growth Comparison by Product, 2025-2035
  • Figure 33: Latin America Market Attractiveness Analysis by Product
  • Figure 34: Western Europe Market Value Share and BPS Analysis by Country, 2025 and 2035
  • Figure 35: Western Europe Market Value Share and BPS Analysis by Form, 2025 and 2035
  • Figure 36: Western Europe Market Y-o-Y Growth Comparison by Form, 2025-2035
  • Figure 37: Western Europe Market Attractiveness Analysis by Form
  • Figure 38: Western Europe Market Value Share and BPS Analysis by Product, 2025 and 2035
  • Figure 39: Western Europe Market Y-o-Y Growth Comparison by Product, 2025-2035
  • Figure 40: Western Europe Market Attractiveness Analysis by Product
  • Figure 41: Eastern Europe Market Value Share and BPS Analysis by Country, 2025 and 2035
  • Figure 42: Eastern Europe Market Value Share and BPS Analysis by Form, 2025 and 2035
  • Figure 43: Eastern Europe Market Y-o-Y Growth Comparison by Form, 2025-2035
  • Figure 44: Eastern Europe Market Attractiveness Analysis by Form
  • Figure 45: Eastern Europe Market Value Share and BPS Analysis by Product, 2025 and 2035
  • Figure 46: Eastern Europe Market Y-o-Y Growth Comparison by Product, 2025-2035
  • Figure 47: Eastern Europe Market Attractiveness Analysis by Product
  • Figure 48: East Asia Market Value Share and BPS Analysis by Country, 2025 and 2035
  • Figure 49: East Asia Market Value Share and BPS Analysis by Form, 2025 and 2035
  • Figure 50: East Asia Market Y-o-Y Growth Comparison by Form, 2025-2035
  • Figure 51: East Asia Market Attractiveness Analysis by Form
  • Figure 52: East Asia Market Value Share and BPS Analysis by Product, 2025 and 2035
  • Figure 53: East Asia Market Y-o-Y Growth Comparison by Product, 2025-2035
  • Figure 54: East Asia Market Attractiveness Analysis by Product
  • Figure 55: South Asia & Pacific Market Value Share and BPS Analysis by Country, 2025 and 2035
  • Figure 56: South Asia & Pacific Market Value Share and BPS Analysis by Form, 2025 and 2035
  • Figure 57: South Asia & Pacific Market Y-o-Y Growth Comparison by Form, 2025-2035
  • Figure 58: South Asia & Pacific Market Attractiveness Analysis by Form
  • Figure 59: South Asia & Pacific Market Value Share and BPS Analysis by Product, 2025 and 2035
  • Figure 60: South Asia & Pacific Market Y-o-Y Growth Comparison by Product, 2025-2035
  • Figure 61: South Asia & Pacific Market Attractiveness Analysis by Product
  • Figure 62: Middle East and Africa Market Value Share and BPS Analysis by Country, 2025 and 2035
  • Figure 63: Middle East and Africa Market Value Share and BPS Analysis by Form, 2025 and 2035
  • Figure 64: Middle East and Africa Market Y-o-Y Growth Comparison by Form, 2025-2035
  • Figure 65: Middle East and Africa Market Attractiveness Analysis by Form
  • Figure 66: Middle East and Africa Market Value Share and BPS Analysis by Product, 2025 and 2035
  • Figure 67: Middle East and Africa Market Y-o-Y Growth Comparison by Product, 2025-2035
  • Figure 68: Middle East and Africa Market Attractiveness Analysis by Product
  • Figure 69: Global Market - Tier Structure Analysis
  • Figure 70: Global Market - Company Share Analysis

Frequently Asked Questions

What is the estimated market size of the feed premix industry in 2025?

The industry is valued at USD 9.1 billion in 2025.

What is the projected industry size of the feed premix industry by 2035?

It is forecasted to reach USD 12.5 billion by 2035.

What is the expected CAGR for the feed premix industry between 2025 and 2035?

The industry is anticipated to grow at a CAGR of 3.3% during this period.

Which segment is expected to lead the feed premix market in 2025?

Powder is projected to lead the market with an 80% share in 2025.

Which region is expected to witness the highest growth in the feed premix market?

Asia Pacific, particularly India, is expected to be the key growth region with a projected growth rate of 3.4%

Explore Similar Insights

Future Market Insights

Feed Premix Market