Feed Mixer Market Size and Forecast Outlook (2024 to 2034)

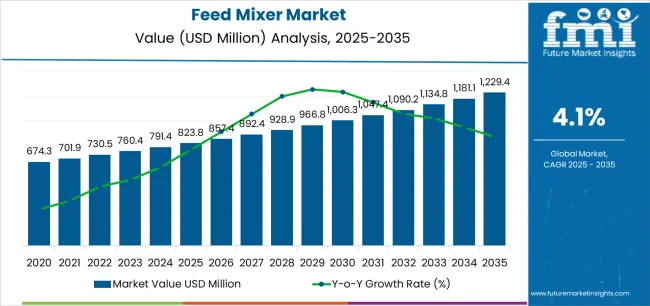
As per Future Market Insights’ latest analysis, the global feed mixer market size is projected to reach USD 789.8 million in 2024. It is set to record a CAGR of 4.3% during the next decade, with total market revenue reaching USD 1205.0 million by 2034.

As meat consumption shows no signs of slowing down, the feed mixing equipment industry continues to find new growth opportunities. It will probably grow 1.5 times its current value by 2034 amid surging demand for animal-based products and high-quality animal feed.

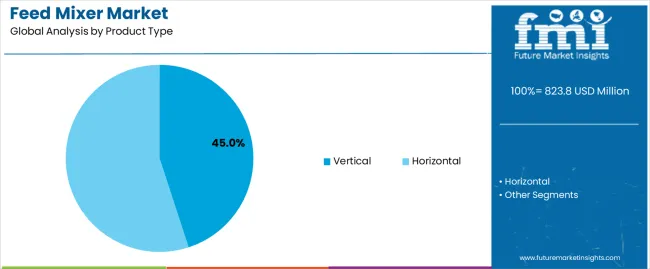
Demand remains particularly high for vertical feed mixing equipment owing to their high adoption across small and mid-sized farms and feed companies. The target segment counted for a revenue share of 65% in 2023 and is set to progress at 4.1% CAGR through 2034.

Feed producers are constantly seeking feed mixing equipment that offers optimal efficiency and performance to meet escalating demand for animal feed. Thus, high adoption of feed mixing equipment across the feed industry will boost sales growth.

To capitalize on emerging opportunities and meet the evolving needs of end users, top players are incorporating automation, AI, and IoT in feed mixer equipment. As these technologies have the tendency to improve efficiency and accuracy, they will become key to the industry's future growth.

Market Size and Forecast for Feed Mixers

Attributes Key Insights
Base Market Value (2023) USD 750.0 million
Global Market Size in 2024 USD 789.8 million
Market Revenue in 2034 USD 1205.0 million
Value-based CAGR (2024 to 2034) 4.3%
Historical CAGR (2019 to 2023) 6.0% CAGR

Key Drivers Supporting the Expansion of the Feed Mixer Market

Thriving Livestock Sector Creating Growth Prospects for Feed Mixers

The livestock sector is experiencing rapid growth globally due to exploding population and surging demand for dairy, meat, and other livestock products. This, in turn, is creating a high need for efficient feed mixing solutions to ensure better nutrition and growth of livestock.

More and more people are consuming animal proteins to stay fit and healthy. According to the OECD-FAO Agricultural Outlook, global meat protein consumption is estimated to grow 14% by 2030. To meet this demand, farms will need to raise more animals, which necessitates using more efficient feed practices and feed mixing tools.

Farmers are also focusing on improving the health and well-being of their animals. This will further propel feed mixer demand as they ensure consistent, balanced meals, leading to healthier animals.

High Adoption of Innovative Feeding Equipment

Farm mechanization continues to penetrate its roots, especially across nations like India and China. This is anticipated to positively impact the global feed mixer industry during the assessment period.

More and more farms and feed factories are installing advanced feed mixing solutions like automatic ones to enhance productivity and reduce costs. These technologies also allow end users to manage larger herds and meet their feed requirements.

Emerging Trends Influencing Growth in the Feed Mixer Industry

Rise of Precision Animal Nutrition

The growing popularity of precision livestock farming, as well as precision animal nutrition, is setting a new platform for the feed mixing equipment market growth. These novel approaches create a strong demand for efficient feed mixing solutions to allow the proper amount of feed with a suitable composition to be supplied to animals in a timely manner.

Feed mixing equipment is becoming key to precision nutrition, allowing animals to get customized feed mixes that meet their exact requirements. They ensure a homogenous mixture of various feed ingredients, maximizing nutrient intake and reducing waste.

With more and more farmers showing interest in precision feeding, adoption of feed mixing solutions is bound to grow significantly. This will play a key role in boosting market growth during the assessment period.

Impact of Adjacent Market Trends on Feed Mixer Demand

The section comprehensively evaluates three interrelated markets: the global feed mixing equipment industry, the vibratory feeder machine market, and the animal feed processing equipment industry. It dissects each market's distinctive characteristics, encompassing their respective CAGRs, while delving into the pivotal factors influencing their growth trajectories.

Global Feed Mixer Market Analysis:

Attribute Global Feed Mixer Market Analysis
CAGR (2024 to 2034) 4.3%
Growth Factors Surging demand for high-quality animal feed is a key factor boosting market growth.
Key Trends in Feed Mixer Market Jey growth shaping trends include the growing interest in precision feeding and ongoing innovation and technological advancements in feed mixers.

Global Vibratory Feeder Machine Market Forecast:

Attribute Global Vibratory Feeder Machine Market Forecast
CAGR (2024 to 2034) 4.3%
Growth Factor Increasing adoption of vibratory feeder machines across diverse industries is boosting market growth.
Key Trends High penetration of automation is a key trend influencing market growth.

Global Animal Feed Processing Equipment Industry Analysis:

Attribute Global Animal Feed Processing Equipment Industry Analysis
CAGR (2024 to 2034) 4.2%
Growth Factor Increasing livestock production and surging demand for high-quality feed are key factors fueling market growth.
Key Trends Key growth influencing trends include surging popularity of automation and robotics and increasing interest in precision feeding.

Country-wise Insights into Feed Mixer Adoption Across Livestock Sectors

The table below shows the projected growth rates of the top countries. South Korea and Japan are forecast to record high CAGRs of 6.5% and 5.9%, respectively, through 2034.

Countries CAGR (2024 to 2034)
United States 4.6%
United Kingdom 5.6%
China 4.9%
Japan 5.9%
South Korea 6.5%

The table below highlights key countries’ market revenues. The United States and China are set to remain the top consumers of feed mixing machines, with predicted valuations of USD 214.7 million and USD 188.9 million, respectively, in 2034.

Countries Market Revenue (2034)
United States USD 214.7 million
United Kingdom USD 49.1 million
China USD 188.9 million
Japan USD 133.8 million
South Korea USD 78.2 million

Growing Emphasis on Animal Health Spurring Demand in the United States

The latest trends predict the United States to remain a key consumer of feed mixing machines, accumulating a total revenue of USD 214.7 million by 2034. Demand in the nation is set to surge at 4.6% CAGR throughout the forecast period.

Several factors are anticipated to propel growth of the market in the United States. These include growing focus on animal health, increasing importance of precision feeding, and high adoption of automated feeding systems to enhance farm productivity.

American farmers have become aware of the importance of animal health for both economic and ethical reasons. As a result, they are widely using advanced feeding systems, including mixers, to ensure that animals receive a consistent and properly mixed diet.

Feed mixing machines have the ability to create a homogenous feed mix, thereby helping farmers provide high-quality, balanced feed to their livestock. Thus, as the awareness regarding animal feed nutrition grows, so will demand for feed mixers.

Escalating demand for animal products, especially meat, in the United States is acting as a catalyst triggering market growth. Meat to Americans is more popular than Taylor Swift and Elvis Presley put together, and there is no end in sight for the meat industry.

According to the United States Department of Agriculture (USDA), the United States had access to 224.6 pounds of poultry and red meat in 2022. Further, beef consumption per capita in the nation reached around 58.8 pounds in 2023. This leads to an increased demand for efficient feed mixing equipment to ensure optimal nutrition and growth of livestock.

Booming Livestock Industry Triggering Sales in China

The livestock industry in China is witnessing robust growth fueled by surging demand for animal products and a rise in meat exports. To meet this demand, animal and dairy farms are increasingly adopting efficient and reliable feed mixing solutions, thereby boosting sales growth.

As per Future Market Insights’ latest report, sales of feed mixers in China are estimated to grow at 4.9% CAGR during the forecast period. By 2034, China's market size is predicted to reach USD 188.9 million.

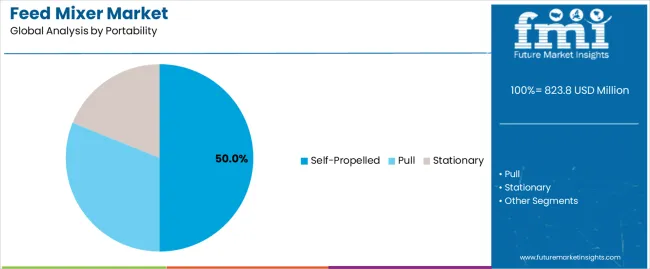
End users in China are also inclined towards using advanced feed mixing tools, such as self-propelled models. High adoption of these advanced mixers in the feed mixing process for greater precision, efficiency, and automation will boost market growth.

The Chinese government is also supporting the country’s feed production sector by encouraging the development and adoption of advanced feed mixing technologies. This will bode well for China’s feed mixing machine market.

Feed Mixer Market by Type, Capacity, End Use, and Region

The section below offers key insights into leading segments and their respective shares and growth rates. This information can be useful for companies to invest in popular products.

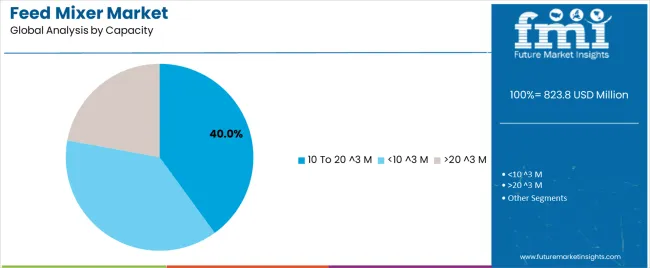
By product type, vertical mixer segment dominates the market and is poised to grow at 4.1% CAGR through 2034. Based on capacity, the 10 to 20 ^3 M category will record a CAGR of 3.8% from 2024 to 2034.

Multiple Advantages of Vertical Mixers Make Them Popular Products

Top Segment Vertical (Product Type)
CAGR (2024 to 2034) 4.1%

As per the latest report, vertical mixer segment dominated the global industry with a share of 65% in 2023. Over the next ten years, demand for vertical mixers is projected to surge at 4.1% CAGR. This can be attributed to their advantages, like versatility and cost-effectiveness.

Vertical mixers have become workhorses in the agricultural landscape. They are widely used in small farms due to their lower cost, smaller footprint, simple design, and other benefits. This will continue to boost segment growth through 2034.

From small trailer-mounted options to large ones, vertical mixers come in various sizes to suit different farming operations. These mixers are more energy-efficient and require less space, which is improving their popularity.

Surging popularity of vertical mixers, especially across space-constrained environments like small farms or feed factors, will continue to fuel their demand through 2034. On the other hand, horizontal mixers are set to witness significant demand amid their adoption across large farms or factors.

Glass Remains the Most Widely Used Material

Top Segment 10 to 20 ^3 M (Capacity)
CAGR (2024 to 2034) 3.8%

Based on capacity, 10 to 20 ^3 M segment leads the market with a share of 44.0% in 2023. Further, a CAGR of 3.8% has been assigned for the same segment by Future Market Insights’ analysts between 2024 and 2034.

High adoption of mixer machines across medium-sized farms seeking a balance between efficiency and affordability is boosting segment growth. Similarly, growing trend of precision framing will benefit the target segment.

Mid-sized mixers (10 to 20 ^3 M) offer a unique combination of efficiency and practicality for farms. These mixers help farmers improve mixing time and feed quality without investing in much larger mixers.

10 to 20 ^3 M mixers are perfect for implementing TMR (total mixed ratio) feeding systems, ensuring precise nutrient delivery to livestock. Thus, surging demand for consistent, high-quality feed due to automation and big data in agriculture will further boost segment growth.
Competitive Landscape of the Global Feed Mixer Industry

The global market is becoming competitive due to high presence of regional and domestic players. It offers lucrative opportunities, prompting manufacturers of mixers to invest in product innovation strategies.

Top players are constantly launching new feed mixing equipment to cater to different farm sizes. They are incorporating advanced technologies like precision weighing mechanisms and automated loading/unloading systems in their products to enhance their functionality and efficiency.

Several players are also looking to reduce feed mixing equipment prices to address the initial investment barrier for smaller farms. Similarly, strategies like partnerships, distribution agreements, exhibitions, and acquisitions are becoming popular as companies look to strengthen their presence.

Recent Developments

Date and Approach Description
March 2023, New Product Launch Sweden-based DeLaval introduced DeLaval Optimat, a new autonomous feeding solution that provides everything from weighing, cutting, and mixing to delivering the feed to the feed table.
October 2023, New Product Launch Italy-based FARESIN Industries launched a new self-propelled electric mixer for animal husbandry.
New Product Launch Recently, Switzerland-based Bucher Industries showcased its new agricultural equipment, including an autonomous feed mixer.

Leading Companies in the Global Feed Mixer Equipment Sector

  • Bucher Industries AG
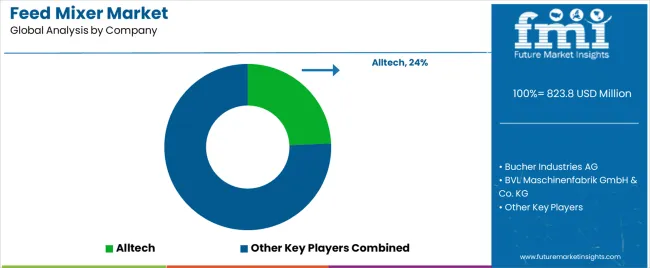
  • Alltech
  • BVL Maschinenfabrik GmbH & Co. KG
  • Faresin Industries S.p.A
  • Hi-Tech Industries Inc.
  • Lachish Industries Ltd.
  • Others

Core Topics Covered in the Feed Mixer Market Research Report

  • Top Market Trends and Drivers for Feed Mixers
  • Impact of Livestock Population Growth on the Demand for Feed Mixers
  • Consumer Preferences and Buying Behavior for Feed Mixers in the Agriculture Sector
  • Assessment of Efficiency and Effectiveness of Different Types of Feed Mixers
  • Analysis of Emerging Trends in Animal Nutrition and their Influence on Feed Mixer Design
  • Evaluation of the Economic Implications of Feed Mixing Techniques on Overall Farm Profitability
  • Market Opportunities for Portable and Easy-to-use Feed Mixers for Small-scale Farmers
  • Challenges and Solutions for Integrating Feed Mixing Technology into Modern Farming Practices
  • Regulatory Landscape Impacting Feed Mixers Industry
  • Consumer Awareness and Education Campaigns Regarding the Benefits of Using Feed Mixers
  • Impact of Strategic Partnerships and Collaborations Between Feed Mixer Manufacturers and Agricultural Organizations on Market Growth
  • Market Entry Strategies for New Players Entering the Feed Mixer Segment
  • Popular Distribution Channels for Feed Mixers

Segmentation of the Feed Mixer Market by Machine Type, Mixing Mechanism, and Livestock Application

By Product Type:

  • Vertical
  • Horizontal

By Portability:

  • Self-Propelled
  • Pull
  • Stationary

By Capacity:

  • <10 ^3 M
  • 10 to 20 ^3 M
  • >20 ^3 M

By Application:

  • Farms
  • Feed Factory

By Region:

  • North America
  • Latin America
  • Europe
  • East Asia
  • South Asia
  • Middle East & Africa

Table of Content

  • 1. Executive Summary
  • 2. Market Overview
  • 3. Market Background
  • 4. Global Market Analysis 2019 to 2023 and Forecast, 2024 to 2034
  • 5. Global Market Analysis 2019 to 2023 and Forecast 2024 to 2034, By Product Type
    • 5.1. Vertical
    • 5.2. Horizontal
  • 6. Global Market Analysis 2019 to 2023 and Forecast 2024 to 2034, By Portability
    • 6.1. Self-propelled
    • 6.2. Pull
    • 6.3. Stationary
  • 7. Global Market Analysis 2019 to 2023 and Forecast 2024 to 2034, By Capacity
    • 7.1. <10 ^3 M
    • 7.2. 10 to 20 ^3 M
    • 7.3. >20 ^3 M
  • 8. Global Market Analysis 2019 to 2023 and Forecast 2024 to 2034, By Application
    • 8.1. Farms
    • 8.2. Feed Factory
  • 9. Global Market Analysis 2019 to 2023 and Forecast 2024 to 2034, By Region
    • 9.1. North America
    • 9.2. Latin America
    • 9.3. Western Europe
    • 9.4. Eastern Europe
    • 9.5. South Asia and Pacific
    • 9.6. East Asia
    • 9.7. Middle East and Africa
  • 10. North America Market Analysis 2019 to 2023 and Forecast 2024 to 2034, By Country
  • 11. Latin America Market Analysis 2019 to 2023 and Forecast 2024 to 2034, By Country
  • 12. Western Europe Market Analysis 2019 to 2023 and Forecast 2024 to 2034, By Country
  • 13. Eastern Europe Market Analysis 2019 to 2023 and Forecast 2024 to 2034, By Country
  • 14. South Asia and Pacific Market Analysis 2019 to 2023 and Forecast 2024 to 2034, By Country
  • 15. East Asia Market Analysis 2019 to 2023 and Forecast 2024 to 2034, By Country
  • 16. Middle East and Africa Market Analysis 2019 to 2023 and Forecast 2024 to 2034, By Country
  • 17. Key Countries Market Analysis
  • 18. Market Structure Analysis
  • 19. Competition Analysis
    • 19.1. Alltech
    • 19.2. Bucher Industries AG
    • 19.3. BVL Maschinenfabrik GmbH & Co. KG
    • 19.4. Faresin Industries S.p.A.
    • 19.5. Groupe Anderson
    • 19.6. Vermeer Corporation
    • 19.7. Trioliet B.V.
    • 19.8. Tetra Laval International S.A.
    • 19.9. Supreme International Limited
    • 19.10. Seko Industries S.r.l.
  • 20. Assumptions & Acronyms Used
  • 21. Research Methodology

List of Tables

Table 1: Global Market Value (US$ million) Forecast by Region, 2019 to 2034

Table 2: Global Market Volume (Units) Forecast by Region, 2019 to 2034

Table 3: Global Market Value (US$ million) Forecast by Product Type, 2019 to 2034

Table 4: Global Market Volume (Units) Forecast by Product Type, 2019 to 2034

Table 5: Global Market Value (US$ million) Forecast by Portability, 2019 to 2034

Table 6: Global Market Volume (Units) Forecast by Portability, 2019 to 2034

Table 7: Global Market Value (US$ million) Forecast by Capacity, 2019 to 2034

Table 8: Global Market Volume (Units) Forecast by Capacity, 2019 to 2034

Table 9: Global Market Value (US$ million) Forecast by Application, 2019 to 2034

Table 10: Global Market Volume (Units) Forecast by Application, 2019 to 2034

Table 11: North America Market Value (US$ million) Forecast by Country, 2019 to 2034

Table 12: North America Market Volume (Units) Forecast by Country, 2019 to 2034

Table 13: North America Market Value (US$ million) Forecast by Product Type, 2019 to 2034

Table 14: North America Market Volume (Units) Forecast by Product Type, 2019 to 2034

Table 15: North America Market Value (US$ million) Forecast by Portability, 2019 to 2034

Table 16: North America Market Volume (Units) Forecast by Portability, 2019 to 2034

Table 17: North America Market Value (US$ million) Forecast by Capacity, 2019 to 2034

Table 18: North America Market Volume (Units) Forecast by Capacity, 2019 to 2034

Table 19: North America Market Value (US$ million) Forecast by Application, 2019 to 2034

Table 20: North America Market Volume (Units) Forecast by Application, 2019 to 2034

Table 21: Latin America Market Value (US$ million) Forecast by Country, 2019 to 2034

Table 22: Latin America Market Volume (Units) Forecast by Country, 2019 to 2034

Table 23: Latin America Market Value (US$ million) Forecast by Product Type, 2019 to 2034

Table 24: Latin America Market Volume (Units) Forecast by Product Type, 2019 to 2034

Table 25: Latin America Market Value (US$ million) Forecast by Portability, 2019 to 2034

Table 26: Latin America Market Volume (Units) Forecast by Portability, 2019 to 2034

Table 27: Latin America Market Value (US$ million) Forecast by Capacity, 2019 to 2034

Table 28: Latin America Market Volume (Units) Forecast by Capacity, 2019 to 2034

Table 29: Latin America Market Value (US$ million) Forecast by Application, 2019 to 2034

Table 30: Latin America Market Volume (Units) Forecast by Application, 2019 to 2034

Table 31: Western Europe Market Value (US$ million) Forecast by Country, 2019 to 2034

Table 32: Western Europe Market Volume (Units) Forecast by Country, 2019 to 2034

Table 33: Western Europe Market Value (US$ million) Forecast by Product Type, 2019 to 2034

Table 34: Western Europe Market Volume (Units) Forecast by Product Type, 2019 to 2034

Table 35: Western Europe Market Value (US$ million) Forecast by Portability, 2019 to 2034

Table 36: Western Europe Market Volume (Units) Forecast by Portability, 2019 to 2034

Table 37: Western Europe Market Value (US$ million) Forecast by Capacity, 2019 to 2034

Table 38: Western Europe Market Volume (Units) Forecast by Capacity, 2019 to 2034

Table 39: Western Europe Market Value (US$ million) Forecast by Application, 2019 to 2034

Table 40: Western Europe Market Volume (Units) Forecast by Application, 2019 to 2034

Table 41: Eastern Europe Market Value (US$ million) Forecast by Country, 2019 to 2034

Table 42: Eastern Europe Market Volume (Units) Forecast by Country, 2019 to 2034

Table 43: Eastern Europe Market Value (US$ million) Forecast by Product Type, 2019 to 2034

Table 44: Eastern Europe Market Volume (Units) Forecast by Product Type, 2019 to 2034

Table 45: Eastern Europe Market Value (US$ million) Forecast by Portability, 2019 to 2034

Table 46: Eastern Europe Market Volume (Units) Forecast by Portability, 2019 to 2034

Table 47: Eastern Europe Market Value (US$ million) Forecast by Capacity, 2019 to 2034

Table 48: Eastern Europe Market Volume (Units) Forecast by Capacity, 2019 to 2034

Table 49: Eastern Europe Market Value (US$ million) Forecast by Application, 2019 to 2034

Table 50: Eastern Europe Market Volume (Units) Forecast by Application, 2019 to 2034

Table 51: South Asia and Pacific Market Value (US$ million) Forecast by Country, 2019 to 2034

Table 52: South Asia and Pacific Market Volume (Units) Forecast by Country, 2019 to 2034

Table 53: South Asia and Pacific Market Value (US$ million) Forecast by Product Type, 2019 to 2034

Table 54: South Asia and Pacific Market Volume (Units) Forecast by Product Type, 2019 to 2034

Table 55: South Asia and Pacific Market Value (US$ million) Forecast by Portability, 2019 to 2034

Table 56: South Asia and Pacific Market Volume (Units) Forecast by Portability, 2019 to 2034

Table 57: South Asia and Pacific Market Value (US$ million) Forecast by Capacity, 2019 to 2034

Table 58: South Asia and Pacific Market Volume (Units) Forecast by Capacity, 2019 to 2034

Table 59: South Asia and Pacific Market Value (US$ million) Forecast by Application, 2019 to 2034

Table 60: South Asia and Pacific Market Volume (Units) Forecast by Application, 2019 to 2034

Table 61: East Asia Market Value (US$ million) Forecast by Country, 2019 to 2034

Table 62: East Asia Market Volume (Units) Forecast by Country, 2019 to 2034

Table 63: East Asia Market Value (US$ million) Forecast by Product Type, 2019 to 2034

Table 64: East Asia Market Volume (Units) Forecast by Product Type, 2019 to 2034

Table 65: East Asia Market Value (US$ million) Forecast by Portability, 2019 to 2034

Table 66: East Asia Market Volume (Units) Forecast by Portability, 2019 to 2034

Table 67: East Asia Market Value (US$ million) Forecast by Capacity, 2019 to 2034

Table 68: East Asia Market Volume (Units) Forecast by Capacity, 2019 to 2034

Table 69: East Asia Market Value (US$ million) Forecast by Application, 2019 to 2034

Table 70: East Asia Market Volume (Units) Forecast by Application, 2019 to 2034

Table 71: Middle East and Africa Market Value (US$ million) Forecast by Country, 2019 to 2034

Table 72: Middle East and Africa Market Volume (Units) Forecast by Country, 2019 to 2034

Table 73: Middle East and Africa Market Value (US$ million) Forecast by Product Type, 2019 to 2034

Table 74: Middle East and Africa Market Volume (Units) Forecast by Product Type, 2019 to 2034

Table 75: Middle East and Africa Market Value (US$ million) Forecast by Portability, 2019 to 2034

Table 76: Middle East and Africa Market Volume (Units) Forecast by Portability, 2019 to 2034

Table 77: Middle East and Africa Market Value (US$ million) Forecast by Capacity, 2019 to 2034

Table 78: Middle East and Africa Market Volume (Units) Forecast by Capacity, 2019 to 2034

Table 79: Middle East and Africa Market Value (US$ million) Forecast by Application, 2019 to 2034

Table 80: Middle East and Africa Market Volume (Units) Forecast by Application, 2019 to 2034

List of Figures

Figure 1: Global Market Value (US$ million) by Product Type, 2024 to 2034

Figure 2: Global Market Value (US$ million) by Portability, 2024 to 2034

Figure 3: Global Market Value (US$ million) by Capacity, 2024 to 2034

Figure 4: Global Market Value (US$ million) by Application, 2024 to 2034

Figure 5: Global Market Value (US$ million) by Region, 2024 to 2034

Figure 6: Global Market Value (US$ million) Analysis by Region, 2019 to 2034

Figure 7: Global Market Volume (Units) Analysis by Region, 2019 to 2034

Figure 8: Global Market Value Share (%) and BPS Analysis by Region, 2024 to 2034

Figure 9: Global Market Y-o-Y Growth (%) Projections by Region, 2024 to 2034

Figure 10: Global Market Value (US$ million) Analysis by Product Type, 2019 to 2034

Figure 11: Global Market Volume (Units) Analysis by Product Type, 2019 to 2034

Figure 12: Global Market Value Share (%) and BPS Analysis by Product Type, 2024 to 2034

Figure 13: Global Market Y-o-Y Growth (%) Projections by Product Type, 2024 to 2034

Figure 14: Global Market Value (US$ million) Analysis by Portability, 2019 to 2034

Figure 15: Global Market Volume (Units) Analysis by Portability, 2019 to 2034

Figure 16: Global Market Value Share (%) and BPS Analysis by Portability, 2024 to 2034

Figure 17: Global Market Y-o-Y Growth (%) Projections by Portability, 2024 to 2034

Figure 18: Global Market Value (US$ million) Analysis by Capacity, 2019 to 2034

Figure 19: Global Market Volume (Units) Analysis by Capacity, 2019 to 2034

Figure 20: Global Market Value Share (%) and BPS Analysis by Capacity, 2024 to 2034

Figure 21: Global Market Y-o-Y Growth (%) Projections by Capacity, 2024 to 2034

Figure 22: Global Market Value (US$ million) Analysis by Application, 2019 to 2034

Figure 23: Global Market Volume (Units) Analysis by Application, 2019 to 2034

Figure 24: Global Market Value Share (%) and BPS Analysis by Application, 2024 to 2034

Figure 25: Global Market Y-o-Y Growth (%) Projections by Application, 2024 to 2034

Figure 26: Global Market Attractiveness by Product Type, 2024 to 2034

Figure 27: Global Market Attractiveness by Portability, 2024 to 2034

Figure 28: Global Market Attractiveness by Capacity, 2024 to 2034

Figure 29: Global Market Attractiveness by Application, 2024 to 2034

Figure 30: Global Market Attractiveness by Region, 2024 to 2034

Figure 31: North America Market Value (US$ million) by Product Type, 2024 to 2034

Figure 32: North America Market Value (US$ million) by Portability, 2024 to 2034

Figure 33: North America Market Value (US$ million) by Capacity, 2024 to 2034

Figure 34: North America Market Value (US$ million) by Application, 2024 to 2034

Figure 35: North America Market Value (US$ million) by Country, 2024 to 2034

Figure 36: North America Market Value (US$ million) Analysis by Country, 2019 to 2034

Figure 37: North America Market Volume (Units) Analysis by Country, 2019 to 2034

Figure 38: North America Market Value Share (%) and BPS Analysis by Country, 2024 to 2034

Figure 39: North America Market Y-o-Y Growth (%) Projections by Country, 2024 to 2034

Figure 40: North America Market Value (US$ million) Analysis by Product Type, 2019 to 2034

Figure 41: North America Market Volume (Units) Analysis by Product Type, 2019 to 2034

Figure 42: North America Market Value Share (%) and BPS Analysis by Product Type, 2024 to 2034

Figure 43: North America Market Y-o-Y Growth (%) Projections by Product Type, 2024 to 2034

Figure 44: North America Market Value (US$ million) Analysis by Portability, 2019 to 2034

Figure 45: North America Market Volume (Units) Analysis by Portability, 2019 to 2034

Figure 46: North America Market Value Share (%) and BPS Analysis by Portability, 2024 to 2034

Figure 47: North America Market Y-o-Y Growth (%) Projections by Portability, 2024 to 2034

Figure 48: North America Market Value (US$ million) Analysis by Capacity, 2019 to 2034

Figure 49: North America Market Volume (Units) Analysis by Capacity, 2019 to 2034

Figure 50: North America Market Value Share (%) and BPS Analysis by Capacity, 2024 to 2034

Figure 51: North America Market Y-o-Y Growth (%) Projections by Capacity, 2024 to 2034

Figure 52: North America Market Value (US$ million) Analysis by Application, 2019 to 2034

Figure 53: North America Market Volume (Units) Analysis by Application, 2019 to 2034

Figure 54: North America Market Value Share (%) and BPS Analysis by Application, 2024 to 2034

Figure 55: North America Market Y-o-Y Growth (%) Projections by Application, 2024 to 2034

Figure 56: North America Market Attractiveness by Product Type, 2024 to 2034

Figure 57: North America Market Attractiveness by Portability, 2024 to 2034

Figure 58: North America Market Attractiveness by Capacity, 2024 to 2034

Figure 59: North America Market Attractiveness by Application, 2024 to 2034

Figure 60: North America Market Attractiveness by Country, 2024 to 2034

Figure 61: Latin America Market Value (US$ million) by Product Type, 2024 to 2034

Figure 62: Latin America Market Value (US$ million) by Portability, 2024 to 2034

Figure 63: Latin America Market Value (US$ million) by Capacity, 2024 to 2034

Figure 64: Latin America Market Value (US$ million) by Application, 2024 to 2034

Figure 65: Latin America Market Value (US$ million) by Country, 2024 to 2034

Figure 66: Latin America Market Value (US$ million) Analysis by Country, 2019 to 2034

Figure 67: Latin America Market Volume (Units) Analysis by Country, 2019 to 2034

Figure 68: Latin America Market Value Share (%) and BPS Analysis by Country, 2024 to 2034

Figure 69: Latin America Market Y-o-Y Growth (%) Projections by Country, 2024 to 2034

Figure 70: Latin America Market Value (US$ million) Analysis by Product Type, 2019 to 2034

Figure 71: Latin America Market Volume (Units) Analysis by Product Type, 2019 to 2034

Figure 72: Latin America Market Value Share (%) and BPS Analysis by Product Type, 2024 to 2034

Figure 73: Latin America Market Y-o-Y Growth (%) Projections by Product Type, 2024 to 2034

Figure 74: Latin America Market Value (US$ million) Analysis by Portability, 2019 to 2034

Figure 75: Latin America Market Volume (Units) Analysis by Portability, 2019 to 2034

Figure 76: Latin America Market Value Share (%) and BPS Analysis by Portability, 2024 to 2034

Figure 77: Latin America Market Y-o-Y Growth (%) Projections by Portability, 2024 to 2034

Figure 78: Latin America Market Value (US$ million) Analysis by Capacity, 2019 to 2034

Figure 79: Latin America Market Volume (Units) Analysis by Capacity, 2019 to 2034

Figure 80: Latin America Market Value Share (%) and BPS Analysis by Capacity, 2024 to 2034

Figure 81: Latin America Market Y-o-Y Growth (%) Projections by Capacity, 2024 to 2034

Figure 82: Latin America Market Value (US$ million) Analysis by Application, 2019 to 2034

Figure 83: Latin America Market Volume (Units) Analysis by Application, 2019 to 2034

Figure 84: Latin America Market Value Share (%) and BPS Analysis by Application, 2024 to 2034

Figure 85: Latin America Market Y-o-Y Growth (%) Projections by Application, 2024 to 2034

Figure 86: Latin America Market Attractiveness by Product Type, 2024 to 2034

Figure 87: Latin America Market Attractiveness by Portability, 2024 to 2034

Figure 88: Latin America Market Attractiveness by Capacity, 2024 to 2034

Figure 89: Latin America Market Attractiveness by Application, 2024 to 2034

Figure 90: Latin America Market Attractiveness by Country, 2024 to 2034

Figure 91: Western Europe Market Value (US$ million) by Product Type, 2024 to 2034

Figure 92: Western Europe Market Value (US$ million) by Portability, 2024 to 2034

Figure 93: Western Europe Market Value (US$ million) by Capacity, 2024 to 2034

Figure 94: Western Europe Market Value (US$ million) by Application, 2024 to 2034

Figure 95: Western Europe Market Value (US$ million) by Country, 2024 to 2034

Figure 96: Western Europe Market Value (US$ million) Analysis by Country, 2019 to 2034

Figure 97: Western Europe Market Volume (Units) Analysis by Country, 2019 to 2034

Figure 98: Western Europe Market Value Share (%) and BPS Analysis by Country, 2024 to 2034

Figure 99: Western Europe Market Y-o-Y Growth (%) Projections by Country, 2024 to 2034

Figure 100: Western Europe Market Value (US$ million) Analysis by Product Type, 2019 to 2034

Figure 101: Western Europe Market Volume (Units) Analysis by Product Type, 2019 to 2034

Figure 102: Western Europe Market Value Share (%) and BPS Analysis by Product Type, 2024 to 2034

Figure 103: Western Europe Market Y-o-Y Growth (%) Projections by Product Type, 2024 to 2034

Figure 104: Western Europe Market Value (US$ million) Analysis by Portability, 2019 to 2034

Figure 105: Western Europe Market Volume (Units) Analysis by Portability, 2019 to 2034

Figure 106: Western Europe Market Value Share (%) and BPS Analysis by Portability, 2024 to 2034

Figure 107: Western Europe Market Y-o-Y Growth (%) Projections by Portability, 2024 to 2034

Figure 108: Western Europe Market Value (US$ million) Analysis by Capacity, 2019 to 2034

Figure 109: Western Europe Market Volume (Units) Analysis by Capacity, 2019 to 2034

Figure 110: Western Europe Market Value Share (%) and BPS Analysis by Capacity, 2024 to 2034

Figure 111: Western Europe Market Y-o-Y Growth (%) Projections by Capacity, 2024 to 2034

Figure 112: Western Europe Market Value (US$ million) Analysis by Application, 2019 to 2034

Figure 113: Western Europe Market Volume (Units) Analysis by Application, 2019 to 2034

Figure 114: Western Europe Market Value Share (%) and BPS Analysis by Application, 2024 to 2034

Figure 115: Western Europe Market Y-o-Y Growth (%) Projections by Application, 2024 to 2034

Figure 116: Western Europe Market Attractiveness by Product Type, 2024 to 2034

Figure 117: Western Europe Market Attractiveness by Portability, 2024 to 2034

Figure 118: Western Europe Market Attractiveness by Capacity, 2024 to 2034

Figure 119: Western Europe Market Attractiveness by Application, 2024 to 2034

Figure 120: Western Europe Market Attractiveness by Country, 2024 to 2034

Figure 121: Eastern Europe Market Value (US$ million) by Product Type, 2024 to 2034

Figure 122: Eastern Europe Market Value (US$ million) by Portability, 2024 to 2034

Figure 123: Eastern Europe Market Value (US$ million) by Capacity, 2024 to 2034

Figure 124: Eastern Europe Market Value (US$ million) by Application, 2024 to 2034

Figure 125: Eastern Europe Market Value (US$ million) by Country, 2024 to 2034

Figure 126: Eastern Europe Market Value (US$ million) Analysis by Country, 2019 to 2034

Figure 127: Eastern Europe Market Volume (Units) Analysis by Country, 2019 to 2034

Figure 128: Eastern Europe Market Value Share (%) and BPS Analysis by Country, 2024 to 2034

Figure 129: Eastern Europe Market Y-o-Y Growth (%) Projections by Country, 2024 to 2034

Figure 130: Eastern Europe Market Value (US$ million) Analysis by Product Type, 2019 to 2034

Figure 131: Eastern Europe Market Volume (Units) Analysis by Product Type, 2019 to 2034

Figure 132: Eastern Europe Market Value Share (%) and BPS Analysis by Product Type, 2024 to 2034

Figure 133: Eastern Europe Market Y-o-Y Growth (%) Projections by Product Type, 2024 to 2034

Figure 134: Eastern Europe Market Value (US$ million) Analysis by Portability, 2019 to 2034

Figure 135: Eastern Europe Market Volume (Units) Analysis by Portability, 2019 to 2034

Figure 136: Eastern Europe Market Value Share (%) and BPS Analysis by Portability, 2024 to 2034

Figure 137: Eastern Europe Market Y-o-Y Growth (%) Projections by Portability, 2024 to 2034

Figure 138: Eastern Europe Market Value (US$ million) Analysis by Capacity, 2019 to 2034

Figure 139: Eastern Europe Market Volume (Units) Analysis by Capacity, 2019 to 2034

Figure 140: Eastern Europe Market Value Share (%) and BPS Analysis by Capacity, 2024 to 2034

Figure 141: Eastern Europe Market Y-o-Y Growth (%) Projections by Capacity, 2024 to 2034

Figure 142: Eastern Europe Market Value (US$ million) Analysis by Application, 2019 to 2034

Figure 143: Eastern Europe Market Volume (Units) Analysis by Application, 2019 to 2034

Figure 144: Eastern Europe Market Value Share (%) and BPS Analysis by Application, 2024 to 2034

Figure 145: Eastern Europe Market Y-o-Y Growth (%) Projections by Application, 2024 to 2034

Figure 146: Eastern Europe Market Attractiveness by Product Type, 2024 to 2034

Figure 147: Eastern Europe Market Attractiveness by Portability, 2024 to 2034

Figure 148: Eastern Europe Market Attractiveness by Capacity, 2024 to 2034

Figure 149: Eastern Europe Market Attractiveness by Application, 2024 to 2034

Figure 150: Eastern Europe Market Attractiveness by Country, 2024 to 2034

Figure 151: South Asia and Pacific Market Value (US$ million) by Product Type, 2024 to 2034

Figure 152: South Asia and Pacific Market Value (US$ million) by Portability, 2024 to 2034

Figure 153: South Asia and Pacific Market Value (US$ million) by Capacity, 2024 to 2034

Figure 154: South Asia and Pacific Market Value (US$ million) by Application, 2024 to 2034

Figure 155: South Asia and Pacific Market Value (US$ million) by Country, 2024 to 2034

Figure 156: South Asia and Pacific Market Value (US$ million) Analysis by Country, 2019 to 2034

Figure 157: South Asia and Pacific Market Volume (Units) Analysis by Country, 2019 to 2034

Figure 158: South Asia and Pacific Market Value Share (%) and BPS Analysis by Country, 2024 to 2034

Figure 159: South Asia and Pacific Market Y-o-Y Growth (%) Projections by Country, 2024 to 2034

Figure 160: South Asia and Pacific Market Value (US$ million) Analysis by Product Type, 2019 to 2034

Figure 161: South Asia and Pacific Market Volume (Units) Analysis by Product Type, 2019 to 2034

Figure 162: South Asia and Pacific Market Value Share (%) and BPS Analysis by Product Type, 2024 to 2034

Figure 163: South Asia and Pacific Market Y-o-Y Growth (%) Projections by Product Type, 2024 to 2034

Figure 164: South Asia and Pacific Market Value (US$ million) Analysis by Portability, 2019 to 2034

Figure 165: South Asia and Pacific Market Volume (Units) Analysis by Portability, 2019 to 2034

Figure 166: South Asia and Pacific Market Value Share (%) and BPS Analysis by Portability, 2024 to 2034

Figure 167: South Asia and Pacific Market Y-o-Y Growth (%) Projections by Portability, 2024 to 2034

Figure 168: South Asia and Pacific Market Value (US$ million) Analysis by Capacity, 2019 to 2034

Figure 169: South Asia and Pacific Market Volume (Units) Analysis by Capacity, 2019 to 2034

Figure 170: South Asia and Pacific Market Value Share (%) and BPS Analysis by Capacity, 2024 to 2034

Figure 171: South Asia and Pacific Market Y-o-Y Growth (%) Projections by Capacity, 2024 to 2034

Figure 172: South Asia and Pacific Market Value (US$ million) Analysis by Application, 2019 to 2034

Figure 173: South Asia and Pacific Market Volume (Units) Analysis by Application, 2019 to 2034

Figure 174: South Asia and Pacific Market Value Share (%) and BPS Analysis by Application, 2024 to 2034

Figure 175: South Asia and Pacific Market Y-o-Y Growth (%) Projections by Application, 2024 to 2034

Figure 176: South Asia and Pacific Market Attractiveness by Product Type, 2024 to 2034

Figure 177: South Asia and Pacific Market Attractiveness by Portability, 2024 to 2034

Figure 178: South Asia and Pacific Market Attractiveness by Capacity, 2024 to 2034

Figure 179: South Asia and Pacific Market Attractiveness by Application, 2024 to 2034

Figure 180: South Asia and Pacific Market Attractiveness by Country, 2024 to 2034

Figure 181: East Asia Market Value (US$ million) by Product Type, 2024 to 2034

Figure 182: East Asia Market Value (US$ million) by Portability, 2024 to 2034

Figure 183: East Asia Market Value (US$ million) by Capacity, 2024 to 2034

Figure 184: East Asia Market Value (US$ million) by Application, 2024 to 2034

Figure 185: East Asia Market Value (US$ million) by Country, 2024 to 2034

Figure 186: East Asia Market Value (US$ million) Analysis by Country, 2019 to 2034

Figure 187: East Asia Market Volume (Units) Analysis by Country, 2019 to 2034

Figure 188: East Asia Market Value Share (%) and BPS Analysis by Country, 2024 to 2034

Figure 189: East Asia Market Y-o-Y Growth (%) Projections by Country, 2024 to 2034

Figure 190: East Asia Market Value (US$ million) Analysis by Product Type, 2019 to 2034

Figure 191: East Asia Market Volume (Units) Analysis by Product Type, 2019 to 2034

Figure 192: East Asia Market Value Share (%) and BPS Analysis by Product Type, 2024 to 2034

Figure 193: East Asia Market Y-o-Y Growth (%) Projections by Product Type, 2024 to 2034

Figure 194: East Asia Market Value (US$ million) Analysis by Portability, 2019 to 2034

Figure 195: East Asia Market Volume (Units) Analysis by Portability, 2019 to 2034

Figure 196: East Asia Market Value Share (%) and BPS Analysis by Portability, 2024 to 2034

Figure 197: East Asia Market Y-o-Y Growth (%) Projections by Portability, 2024 to 2034

Figure 198: East Asia Market Value (US$ million) Analysis by Capacity, 2019 to 2034

Figure 199: East Asia Market Volume (Units) Analysis by Capacity, 2019 to 2034

Figure 200: East Asia Market Value Share (%) and BPS Analysis by Capacity, 2024 to 2034

Figure 201: East Asia Market Y-o-Y Growth (%) Projections by Capacity, 2024 to 2034

Figure 202: East Asia Market Value (US$ million) Analysis by Application, 2019 to 2034

Figure 203: East Asia Market Volume (Units) Analysis by Application, 2019 to 2034

Figure 204: East Asia Market Value Share (%) and BPS Analysis by Application, 2024 to 2034

Figure 205: East Asia Market Y-o-Y Growth (%) Projections by Application, 2024 to 2034

Figure 206: East Asia Market Attractiveness by Product Type, 2024 to 2034

Figure 207: East Asia Market Attractiveness by Portability, 2024 to 2034

Figure 208: East Asia Market Attractiveness by Capacity, 2024 to 2034

Figure 209: East Asia Market Attractiveness by Application, 2024 to 2034

Figure 210: East Asia Market Attractiveness by Country, 2024 to 2034

Figure 211: Middle East and Africa Market Value (US$ million) by Product Type, 2024 to 2034

Figure 212: Middle East and Africa Market Value (US$ million) by Portability, 2024 to 2034

Figure 213: Middle East and Africa Market Value (US$ million) by Capacity, 2024 to 2034

Figure 214: Middle East and Africa Market Value (US$ million) by Application, 2024 to 2034

Figure 215: Middle East and Africa Market Value (US$ million) by Country, 2024 to 2034

Figure 216: Middle East and Africa Market Value (US$ million) Analysis by Country, 2019 to 2034

Figure 217: Middle East and Africa Market Volume (Units) Analysis by Country, 2019 to 2034

Figure 218: Middle East and Africa Market Value Share (%) and BPS Analysis by Country, 2024 to 2034

Figure 219: Middle East and Africa Market Y-o-Y Growth (%) Projections by Country, 2024 to 2034

Figure 220: Middle East and Africa Market Value (US$ million) Analysis by Product Type, 2019 to 2034

Figure 221: Middle East and Africa Market Volume (Units) Analysis by Product Type, 2019 to 2034

Figure 222: Middle East and Africa Market Value Share (%) and BPS Analysis by Product Type, 2024 to 2034

Figure 223: Middle East and Africa Market Y-o-Y Growth (%) Projections by Product Type, 2024 to 2034

Figure 224: Middle East and Africa Market Value (US$ million) Analysis by Portability, 2019 to 2034

Figure 225: Middle East and Africa Market Volume (Units) Analysis by Portability, 2019 to 2034

Figure 226: Middle East and Africa Market Value Share (%) and BPS Analysis by Portability, 2024 to 2034

Figure 227: Middle East and Africa Market Y-o-Y Growth (%) Projections by Portability, 2024 to 2034

Figure 228: Middle East and Africa Market Value (US$ million) Analysis by Capacity, 2019 to 2034

Figure 229: Middle East and Africa Market Volume (Units) Analysis by Capacity, 2019 to 2034

Figure 230: Middle East and Africa Market Value Share (%) and BPS Analysis by Capacity, 2024 to 2034

Figure 231: Middle East and Africa Market Y-o-Y Growth (%) Projections by Capacity, 2024 to 2034

Figure 232: Middle East and Africa Market Value (US$ million) Analysis by Application, 2019 to 2034

Figure 233: Middle East and Africa Market Volume (Units) Analysis by Application, 2019 to 2034

Figure 234: Middle East and Africa Market Value Share (%) and BPS Analysis by Application, 2024 to 2034

Figure 235: Middle East and Africa Market Y-o-Y Growth (%) Projections by Application, 2024 to 2034

Figure 236: Middle East and Africa Market Attractiveness by Product Type, 2024 to 2034

Figure 237: Middle East and Africa Market Attractiveness by Portability, 2024 to 2034

Figure 238: Middle East and Africa Market Attractiveness by Capacity, 2024 to 2034

Figure 239: Middle East and Africa Market Attractiveness by Application, 2024 to 2034

Figure 240: Middle East and Africa Market Attractiveness by Country, 2024 to 2034

Frequently Asked Questions

How big is the feed mixer market?

The global market is estimated to be valued at USD 789.8 million in 2024.

What is the demand outlook for the global market?

Global demand is forecast to surge at a CAGR of 4.3% through 2034.

What is the predicted market size for 2034?

By 2034, the global market size is forecast to reach USD 1205.0 million.

What was the historical CAGR of the industry?

The target industry registered a CAGR of 6.0% from 2019 to 2023.

What is the demand outlook for the United States market?

The United States is set to record a CAGR of 4.6% through 2034.

What is a feed mixer?

Equipment used in feed mills to mix feed ingredients and premixes.

Which type of mixer is most commonly used in the feed industry?

Horizontal mixer.

What is a horizontal feed mixer?

Horizontal mixers consist of a horizontal mixing chamber, usually in the form of trough and or drum.

What is a vertical feed mixer electric used for?

Vertical mixers are mostly used for poultry and fish feed.

Explore Similar Insights

Future Market Insights

Feed Mixer Market